Simon Kuestenmacher
@simongerman600.bsky.social
German #geographer and #demographer in #Melbourne. I love and share #maps and #data that explain how the #world works.
This map by @maroni_editor shows the global air connections of Chinese and US American airports. In Central Europe there is an overlap.

November 11, 2025 at 6:03 PM
This map by @maroni_editor shows the global air connections of Chinese and US American airports. In Central Europe there is an overlap.
Tree diversity in Texas ranks from pretty much nothing in the north west to a lot in the east.

November 11, 2025 at 3:22 PM
Tree diversity in Texas ranks from pretty much nothing in the north west to a lot in the east.
In this map @researchremora shows us the urban footprint around the world. I pondered this map for quite a bit. Few of us venture outside of the pink areas for any long stretch of time.

November 11, 2025 at 12:05 PM
In this map @researchremora shows us the urban footprint around the world. I pondered this map for quite a bit. Few of us venture outside of the pink areas for any long stretch of time.
That chart is well worth studying. Share of daily transactions taking place in cash around the world. As an Australian, I’m very much used to cashless everything by now. I’m still totally against going fully cashless.

November 11, 2025 at 6:26 AM
That chart is well worth studying. Share of daily transactions taking place in cash around the world. As an Australian, I’m very much used to cashless everything by now. I’m still totally against going fully cashless.
This map shows the shift in vote margin from the 2025 NYC mayoral Democratic primary to general election by neighborhood.

November 11, 2025 at 6:21 AM
This map shows the shift in vote margin from the 2025 NYC mayoral Democratic primary to general election by neighborhood.
This map shows the most efficient driving route through all 48 contiguous US states. Only takes 113 hours of driving. If I wanted to see all states in a single trip, I might consider the least efficient route to slow down life as much as I can. Source: buff.ly/S0eGqZL

November 10, 2025 at 9:27 PM
This map shows the most efficient driving route through all 48 contiguous US states. Only takes 113 hours of driving. If I wanted to see all states in a single trip, I might consider the least efficient route to slow down life as much as I can. Source: buff.ly/S0eGqZL
Does your US State have a higher or lower Human Development Index than Germany? Source: buff.ly/NU3L634

November 10, 2025 at 6:03 PM
Does your US State have a higher or lower Human Development Index than Germany? Source: buff.ly/NU3L634
Calm down Wales, calm down… Map shows the longest place names in Europe. HT @Maps_interlude

November 10, 2025 at 3:22 PM
Calm down Wales, calm down… Map shows the longest place names in Europe. HT @Maps_interlude
The map shows the largest national identity in UK local authorities. Displayed is the most popular national identity reported by UK citizens in 2021/2022 censuses. Figures refer to exclusive identities (“Welsh” data don't include the “Welsh & British” option). Source: buff.ly/Pl2A7Q3

November 10, 2025 at 12:05 PM
The map shows the largest national identity in UK local authorities. Displayed is the most popular national identity reported by UK citizens in 2021/2022 censuses. Figures refer to exclusive identities (“Welsh” data don't include the “Welsh & British” option). Source: buff.ly/Pl2A7Q3
An outrageously cool view in 3D of the topography and bathymetry around Gibralta - Europe’s funnest rock. Great work by @pythonmaps

November 10, 2025 at 6:26 AM
An outrageously cool view in 3D of the topography and bathymetry around Gibralta - Europe’s funnest rock. Great work by @pythonmaps
Hand on heart, how expensive do YOU want housing to be? The answer depends on who you are (homeowner, renter, investor, banker, politician, concerned citizen, foster child etc.) and how much you put your own concerns above the collective concerns: buff.ly/9fDUTpW

How expensive do you want housing to be?
The real question isn’t whether house prices in Australia will keep on rising – it’s whether we want them to.
buff.ly
November 9, 2025 at 10:28 PM
Hand on heart, how expensive do YOU want housing to be? The answer depends on who you are (homeowner, renter, investor, banker, politician, concerned citizen, foster child etc.) and how much you put your own concerns above the collective concerns: buff.ly/9fDUTpW
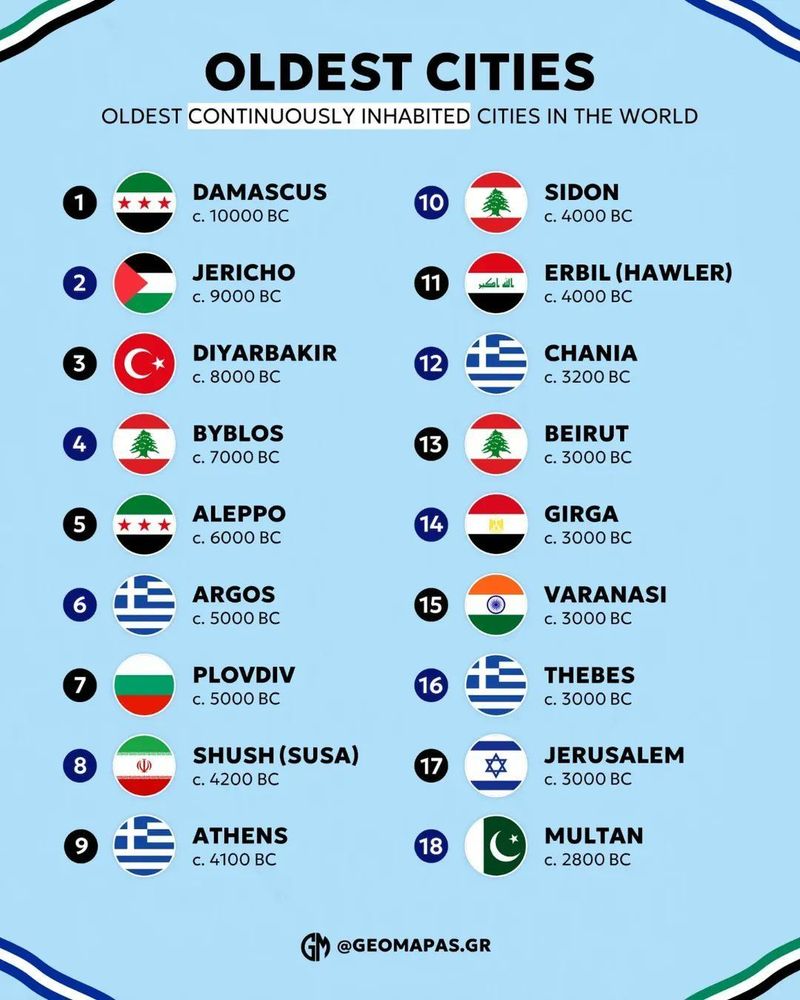
Damascus has long been on my list of cities that I want to visit. It’s the oldest continuously inhabited city in the world.

November 9, 2025 at 9:27 PM
Damascus has long been on my list of cities that I want to visit. It’s the oldest continuously inhabited city in the world.
This map of the 2025 Canadian election shows results by individual polling district. Rather typical inner-city vs fringe patterns. Source: buff.ly/NU3L634

November 9, 2025 at 6:03 PM
This map of the 2025 Canadian election shows results by individual polling district. Rather typical inner-city vs fringe patterns. Source: buff.ly/NU3L634
This chart shows US job openings and the value of the S&P 500. The vertical line shows the release date of ChatGPT. Jobs no longer move in line with the stock market. Fewer workers needed to create growth. Source: buff.ly/YhMttNr

November 9, 2025 at 3:22 PM
This chart shows US job openings and the value of the S&P 500. The vertical line shows the release date of ChatGPT. Jobs no longer move in line with the stock market. Fewer workers needed to create growth. Source: buff.ly/YhMttNr
Socially, a lot can change in a few decades. Even if people think such change to be impossible.

November 9, 2025 at 12:05 PM
Socially, a lot can change in a few decades. Even if people think such change to be impossible.
I keep looking to South Korea to see if birth rates can be pushed upwards from insanely low lows (less than one child per woman). Source: buff.ly/L2YSO9J

November 9, 2025 at 6:26 AM
I keep looking to South Korea to see if birth rates can be pushed upwards from insanely low lows (less than one child per woman). Source: buff.ly/L2YSO9J
In this map @researchremora shows us the tree canopy height across Paris. Urban greenery matters!

November 8, 2025 at 9:27 PM
In this map @researchremora shows us the tree canopy height across Paris. Urban greenery matters!
Woof, woof. This map by @xruiztru shows us the word for "dog" in African languages.

November 8, 2025 at 6:03 PM
Woof, woof. This map by @xruiztru shows us the word for "dog" in African languages.
Today's absolutely pointless geography trivia: Only five countries currently have no Swiss citizens living there.

November 8, 2025 at 3:22 PM
Today's absolutely pointless geography trivia: Only five countries currently have no Swiss citizens living there.
Reposted by Simon Kuestenmacher
Insane data from Germany shows how social media is geared towards more fringe political views. The left bar shows the share of uploaded videos by party on TikTok and the right bar shows what videos are shown in the feed. Social media loves the extremes and is NOT a fair mirror of reality.

November 7, 2025 at 3:22 PM
Insane data from Germany shows how social media is geared towards more fringe political views. The left bar shows the share of uploaded videos by party on TikTok and the right bar shows what videos are shown in the feed. Social media loves the extremes and is NOT a fair mirror of reality.
The world as known in the time of Columbus (1492).

November 8, 2025 at 12:05 PM
The world as known in the time of Columbus (1492).
This map shows the densest 3km circles in the largest cities in the US. Source: buff.ly/NU3L634

November 8, 2025 at 6:26 AM
This map shows the densest 3km circles in the largest cities in the US. Source: buff.ly/NU3L634
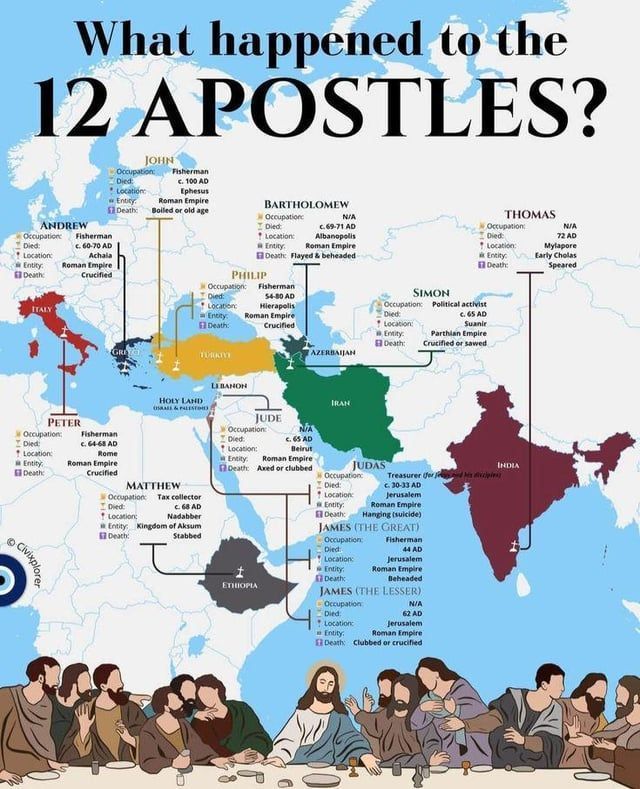
Where did the 12 Apostles go to after that delicious supper? HT @civixplorer

November 7, 2025 at 9:27 PM
Where did the 12 Apostles go to after that delicious supper? HT @civixplorer
Dear European country, by how much can you expect to live longer or shorter than your friends in the US? This map has the answer. Source: buff.ly/riBqOig

November 7, 2025 at 6:04 PM
Dear European country, by how much can you expect to live longer or shorter than your friends in the US? This map has the answer. Source: buff.ly/riBqOig
Insane data from Germany shows how social media is geared towards more fringe political views. The left bar shows the share of uploaded videos by party on TikTok and the right bar shows what videos are shown in the feed. Social media loves the extremes and is NOT a fair mirror of reality.

November 7, 2025 at 3:22 PM
Insane data from Germany shows how social media is geared towards more fringe political views. The left bar shows the share of uploaded videos by party on TikTok and the right bar shows what videos are shown in the feed. Social media loves the extremes and is NOT a fair mirror of reality.

