


Satyen Baindur
@satyenbaindur.bsky.social
Indian-born, US-educated, Canadian theoretical physicist
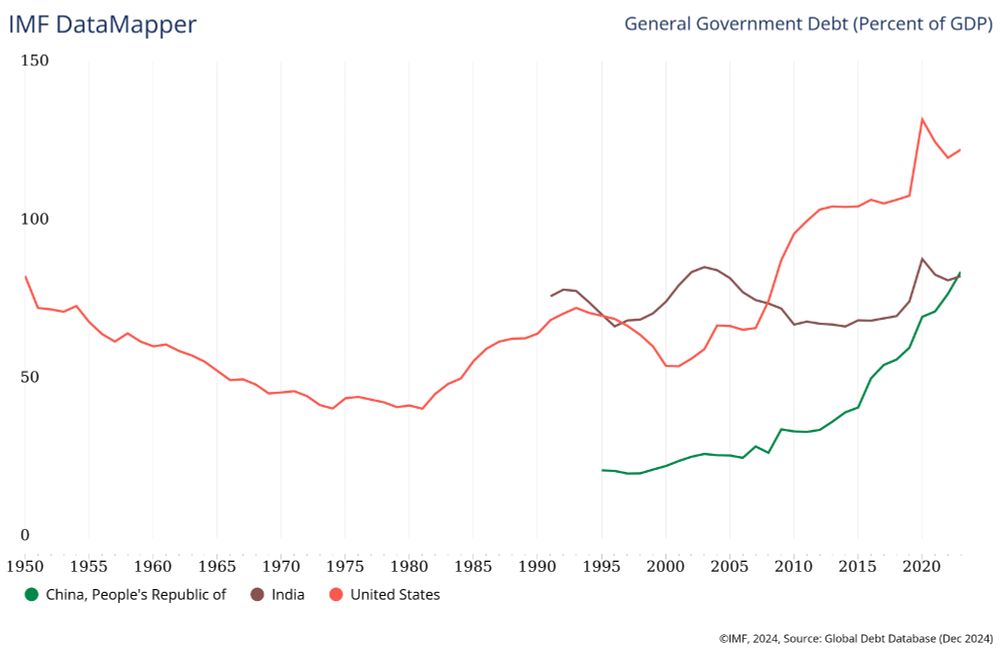
🙏for posting and Happy New Year! The IMF Database is only up to 2023, but one can check the Government Debt ↙️ vs Private Debt ↘️breakdown. Chart maps USA in Red; IND in brown; CHN in green. Private debt/GDP 2023 CHN 205%; USA 150%; IND 98%. Public debt/GDP 2023 CHN 84%; USA 123%; IND 83%.

January 2, 2025 at 8:03 AM
🙏for posting and Happy New Year! The IMF Database is only up to 2023, but one can check the Government Debt ↙️ vs Private Debt ↘️breakdown. Chart maps USA in Red; IND in brown; CHN in green. Private debt/GDP 2023 CHN 205%; USA 150%; IND 98%. Public debt/GDP 2023 CHN 84%; USA 123%; IND 83%.
Reminded me of this great 1971 Carpenters' classic. Or is it too obvious an allusion☺️ youtu.be/PjFoQxjgbrs

Carpenters - Rainy Days And Mondays
YouTube video by CarpentersVEVO
youtu.be
January 2, 2025 at 7:22 AM
Reminded me of this great 1971 Carpenters' classic. Or is it too obvious an allusion☺️ youtu.be/PjFoQxjgbrs

There is a related (and ungated) piece 👇 he wrote back in March, at the uOttawa CIPS website. I'm linking it here. Also, another piece ⏬ on another very compelling issue - international students in Canada - that I'm linking in the reply below. 🙏 www.cips-cepi.ca/2024/03/26/t...
The End of Canada’s Exorbitant Privilege: Mapping Where We Go From Here – Centre for International Policy Studies
Canada's leading centre for analysis and debate of international affairs.
www.cips-cepi.ca
December 1, 2024 at 4:28 AM
There is a related (and ungated) piece 👇 he wrote back in March, at the uOttawa CIPS website. I'm linking it here. Also, another piece ⏬ on another very compelling issue - international students in Canada - that I'm linking in the reply below. 🙏 www.cips-cepi.ca/2024/03/26/t...
Above images are screengrabs from @willdalrymple.bsky.social talk in New Delhi based on his book 'An Empire of Ideas' #Ignition2024 www.youtube.com/live/KfIfU2r...
YouTube
Share your videos with friends, family, and the world
www.youtube.com
November 30, 2024 at 9:18 AM
Above images are screengrabs from @willdalrymple.bsky.social talk in New Delhi based on his book 'An Empire of Ideas' #Ignition2024 www.youtube.com/live/KfIfU2r...
Oops. I meant to say 'US' trade deficit with India', not 'India's trade deficit.' Apologies.
November 30, 2024 at 4:05 AM
Oops. I meant to say 'US' trade deficit with India', not 'India's trade deficit.' Apologies.
Incidentally, the Project 2025 document (on p. 772) shows a Table of 8 major US trading partners, graphing their average differential tariff with the US vs their trade deficit. India's trade deficit as of ~2019 was less than $50B but the tariff differential was in the highest bin 8%-10% 👇. 🙏

November 30, 2024 at 3:17 AM
Incidentally, the Project 2025 document (on p. 772) shows a Table of 8 major US trading partners, graphing their average differential tariff with the US vs their trade deficit. India's trade deficit as of ~2019 was less than $50B but the tariff differential was in the highest bin 8%-10% 👇. 🙏
The Chart from India's Press Information Bureau citing the National Statistics Office 👇. The quarter ended September is 2Q 2024-25 since the FY starts April 1. Chart shows both GDP (left scale) and growth rate (right scale). YoY growth has declined for the third successive quarter since 4Q 2023-24.

November 30, 2024 at 1:48 AM
The Chart from India's Press Information Bureau citing the National Statistics Office 👇. The quarter ended September is 2Q 2024-25 since the FY starts April 1. Chart shows both GDP (left scale) and growth rate (right scale). YoY growth has declined for the third successive quarter since 4Q 2023-24.
About 65% of Nickel used is in austenitic steel, a common form of stainless steel, while about 12% is used in superalloys such as Inconel 600, used for turbine blades in jet engines as well as power generating stations. The other 23% goes into rechargeable batteries, catalysts and plating. (USGS).
November 29, 2024 at 3:53 AM
About 65% of Nickel used is in austenitic steel, a common form of stainless steel, while about 12% is used in superalloys such as Inconel 600, used for turbine blades in jet engines as well as power generating stations. The other 23% goes into rechargeable batteries, catalysts and plating. (USGS).
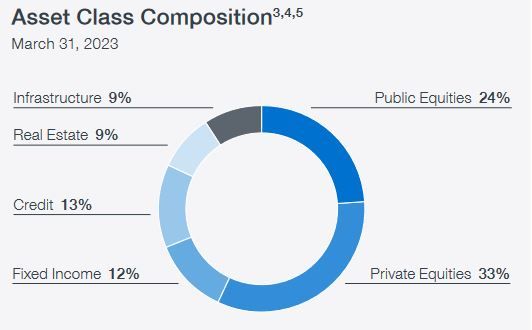
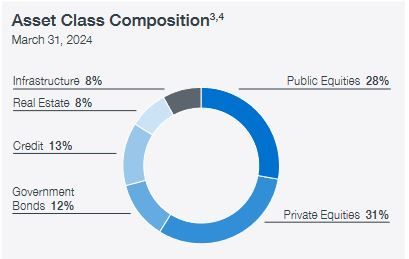
Most significant change is the increase 2023 to 2024 in the US portfolio weight in CPPIB's assets: from 36% to 42% (and the decrease in Asia's 26% to 21%). Nearly as significant is the increase #PublicEquity 24% 2023 to 28% 2024. #PrivateEquity, Infrastructure, Real Estate each declined to make up.
November 29, 2024 at 3:14 AM
Most significant change is the increase 2023 to 2024 in the US portfolio weight in CPPIB's assets: from 36% to 42% (and the decrease in Asia's 26% to 21%). Nearly as significant is the increase #PublicEquity 24% 2023 to 28% 2024. #PrivateEquity, Infrastructure, Real Estate each declined to make up.
The CPP Investment Board, of course, invests in 56 countries (as at 3/31/24). What I found really interesting is how, between 2023 and 2024, in response to geopolitical, but also macroeconomic factors, it varied its investments, both geographically 👇 and by asset class ⏬


November 29, 2024 at 3:02 AM
The CPP Investment Board, of course, invests in 56 countries (as at 3/31/24). What I found really interesting is how, between 2023 and 2024, in response to geopolitical, but also macroeconomic factors, it varied its investments, both geographically 👇 and by asset class ⏬
RBNZ MPC reduced the Official Cash Rate by 50 bp to 4.25%, noting that economic activity in New Zealand remained subdued; output below potential, but geopolitical conditions and [international] policy uncertainty could contribute to higher GDP & inflation volatility www.rbnz.govt.nz/hub/news/202...
OCR 4.25% - OCR lowered further as inflation returns to target
Monetary Policy Statement media release and the MPC’s Record of Meeting, which summarises the committee's discussions, leading to the decision.
www.rbnz.govt.nz
November 27, 2024 at 7:59 AM
RBNZ MPC reduced the Official Cash Rate by 50 bp to 4.25%, noting that economic activity in New Zealand remained subdued; output below potential, but geopolitical conditions and [international] policy uncertainty could contribute to higher GDP & inflation volatility www.rbnz.govt.nz/hub/news/202...
Panel was in September 2022; JG was then (as now) a lawyer with King & Spalding. Excerpt from his initial remarks at the panel 👇 Mary Lovely @piie.com responds.

November 27, 2024 at 7:42 AM
Panel was in September 2022; JG was then (as now) a lawyer with King & Spalding. Excerpt from his initial remarks at the panel 👇 Mary Lovely @piie.com responds.
Reposted by Satyen Baindur
Geographical variation of inflation within the Eurozone is actually quite considerable👇 In September 2024, Cyprus and Latvia each had 1.6%, while Belgium had the highest 4.3% and Ireland the lowest 0.0%! France, Germany and Italy had 1.4% 1.8% and 0.7%. Eurozone HICP for 09/24 is 1.7% closest to DEU

November 27, 2024 at 5:06 AM
Geographical variation of inflation within the Eurozone is actually quite considerable👇 In September 2024, Cyprus and Latvia each had 1.6%, while Belgium had the highest 4.3% and Ireland the lowest 0.0%! France, Germany and Italy had 1.4% 1.8% and 0.7%. Eurozone HICP for 09/24 is 1.7% closest to DEU
Geographical variation of inflation within the Eurozone is actually quite considerable👇 In September 2024, Cyprus and Latvia each had 1.6%, while Belgium had the highest 4.3% and Ireland the lowest 0.0%! France, Germany and Italy had 1.4% 1.8% and 0.7%. Eurozone HICP for 09/24 is 1.7% closest to DEU
November 27, 2024 at 5:06 AM
Geographical variation of inflation within the Eurozone is actually quite considerable👇 In September 2024, Cyprus and Latvia each had 1.6%, while Belgium had the highest 4.3% and Ireland the lowest 0.0%! France, Germany and Italy had 1.4% 1.8% and 0.7%. Eurozone HICP for 09/24 is 1.7% closest to DEU