


Robin Hawkes
@robhawkes.bsky.social
🐙 DataViz at @octopus.energy
⚡️ Obsessed with maps and energy
✨ Creator of ViziCities
👨💻 Previously Wood Mackenzie & devrel at Mozilla
⚡️ Obsessed with maps and energy
✨ Creator of ViziCities
👨💻 Previously Wood Mackenzie & devrel at Mozilla
Wind output and curtailment in Scotland during Storm Floris
August 11, 2025 at 12:13 PM
Wind output and curtailment in Scotland during Storm Floris
Experimenting with the styling of the wind particles as well as the colour ramp for the wind speed layer.
Kinda loving how much detail you can see now from the Meteomatics EURO1k weather model
Kinda loving how much detail you can see now from the Meteomatics EURO1k weather model
August 10, 2025 at 3:25 PM
Experimenting with the styling of the wind particles as well as the colour ramp for the wind speed layer.
Kinda loving how much detail you can see now from the Meteomatics EURO1k weather model
Kinda loving how much detail you can see now from the Meteomatics EURO1k weather model
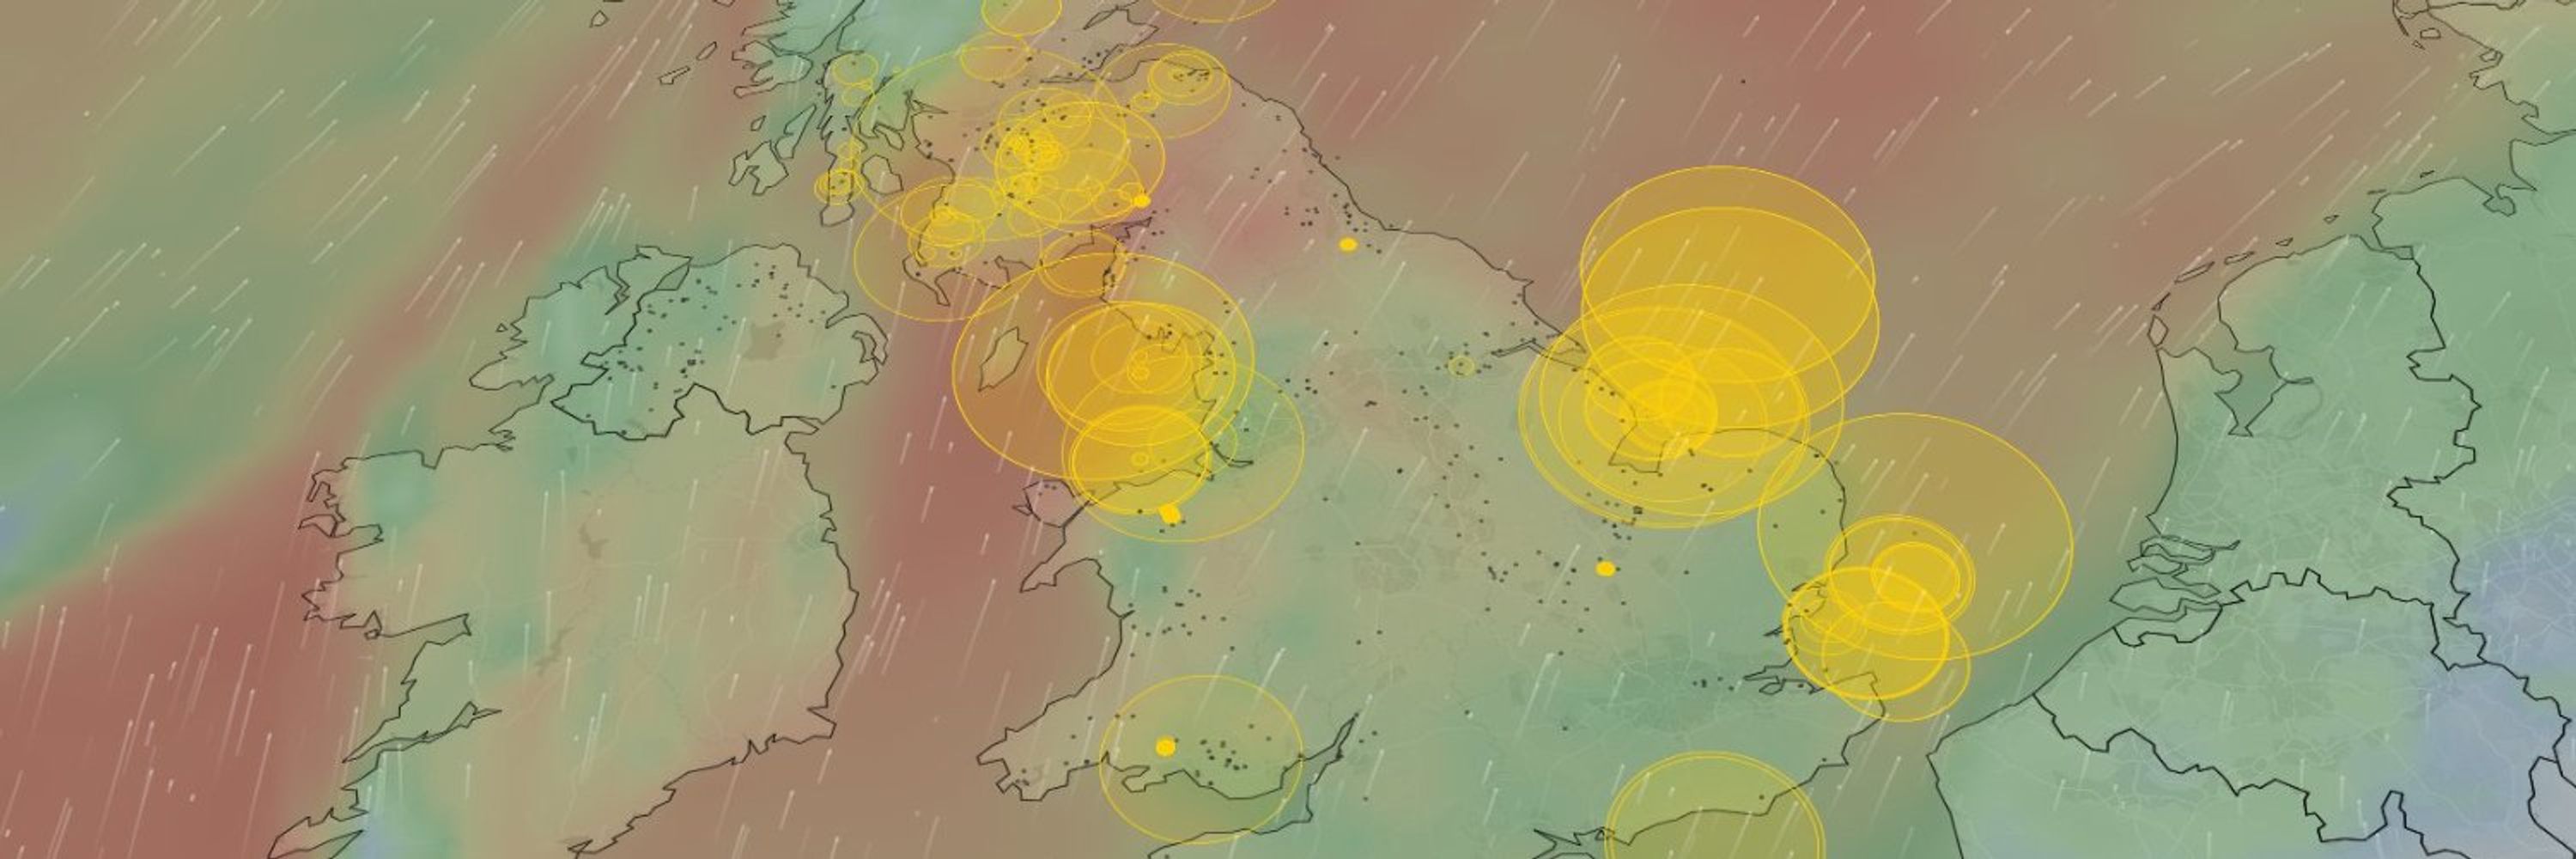
A zoomed in view of wind farm curtailment in Scotland during Storm Floris…
The yellow rings are showing the curtailed volume at each wind farm as a proportion of their installed capacity.
The yellow rings are showing the curtailed volume at each wind farm as a proportion of their installed capacity.
August 8, 2025 at 8:10 AM
A zoomed in view of wind farm curtailment in Scotland during Storm Floris…
The yellow rings are showing the curtailed volume at each wind farm as a proportion of their installed capacity.
The yellow rings are showing the curtailed volume at each wind farm as a proportion of their installed capacity.
Experimenting with adding gas power plants on the map so you can see turn-up in the south in response to wind curtailment in the north.
The red rings show gas turn-up scaled to the capacity of each power plant. I'm currently showing all gas offers so it still needs work.
The red rings show gas turn-up scaled to the capacity of each power plant. I'm currently showing all gas offers so it still needs work.
July 25, 2025 at 8:54 PM
Experimenting with adding gas power plants on the map so you can see turn-up in the south in response to wind curtailment in the north.
The red rings show gas turn-up scaled to the capacity of each power plant. I'm currently showing all gas offers so it still needs work.
The red rings show gas turn-up scaled to the capacity of each power plant. I'm currently showing all gas offers so it still needs work.
Switching off wind farms on July 4th lost 113,831MWh of clean energy, only to replace it with gas.
The map shows how much wind farms were curtailed that day alongside boundary capacity:
🟢 Spare cap. at boundary
🟠 Close to limit (poss. constrained)
🔴 At limit (constrained)
The map shows how much wind farms were curtailed that day alongside boundary capacity:
🟢 Spare cap. at boundary
🟠 Close to limit (poss. constrained)
🔴 At limit (constrained)
July 24, 2025 at 12:13 PM
Switching off wind farms on July 4th lost 113,831MWh of clean energy, only to replace it with gas.
The map shows how much wind farms were curtailed that day alongside boundary capacity:
🟢 Spare cap. at boundary
🟠 Close to limit (poss. constrained)
🔴 At limit (constrained)
The map shows how much wind farms were curtailed that day alongside boundary capacity:
🟢 Spare cap. at boundary
🟠 Close to limit (poss. constrained)
🔴 At limit (constrained)
Experimenting with showing transmission boundaries on my renewables map, colour-coded based on forecast flow limits (red = boundary at limit)
This is critical context for understanding the reason why wind farms are often switched off in Scotland, even when it's windy
This is critical context for understanding the reason why wind farms are often switched off in Scotland, even when it's windy
July 23, 2025 at 5:04 PM
Experimenting with showing transmission boundaries on my renewables map, colour-coded based on forecast flow limits (red = boundary at limit)
This is critical context for understanding the reason why wind farms are often switched off in Scotland, even when it's windy
This is critical context for understanding the reason why wind farms are often switched off in Scotland, even when it's windy
Generation and curtailment at British wind farms during Storm Éowyn earlier this year 🌬️⚡
Notice the wind farms in Scotland turning off as the storm passes due to very high wind speeds and transmission constraints
You can see live and historic generation on the map:
renewables-map.robinhawkes.com
Notice the wind farms in Scotland turning off as the storm passes due to very high wind speeds and transmission constraints
You can see live and historic generation on the map:
renewables-map.robinhawkes.com
July 21, 2025 at 1:01 PM
Generation and curtailment at British wind farms during Storm Éowyn earlier this year 🌬️⚡
Notice the wind farms in Scotland turning off as the storm passes due to very high wind speeds and transmission constraints
You can see live and historic generation on the map:
renewables-map.robinhawkes.com
Notice the wind farms in Scotland turning off as the storm passes due to very high wind speeds and transmission constraints
You can see live and historic generation on the map:
renewables-map.robinhawkes.com
The new wind farms doing their thing…
Well, aside from Moray West which was 100% curtailed at the time I recorded the animation 🫠
Well, aside from Moray West which was 100% curtailed at the time I recorded the animation 🫠
July 18, 2025 at 8:21 AM
The new wind farms doing their thing…
Well, aside from Moray West which was 100% curtailed at the time I recorded the animation 🫠
Well, aside from Moray West which was 100% curtailed at the time I recorded the animation 🫠
July 17, 2025 at 10:20 PM
I still can't get over the resolution of the @meteomatics.com wind data, I swear you can see the wake effects from Gwynt-y-Mor in this example 🤯
Their EURO1k model supports wake effects, so it's definitely possible…
Their EURO1k model supports wake effects, so it's definitely possible…
July 17, 2025 at 7:56 PM
I still can't get over the resolution of the @meteomatics.com wind data, I swear you can see the wake effects from Gwynt-y-Mor in this example 🤯
Their EURO1k model supports wake effects, so it's definitely possible…
Their EURO1k model supports wake effects, so it's definitely possible…
I'm experimenting with @meteomatics.com high-res weather data on my live renewables map to replace the low-res GFS data that I've used up to now.
The difference is incredible… 🤯
The difference is incredible… 🤯
July 15, 2025 at 8:29 AM
I'm experimenting with @meteomatics.com high-res weather data on my live renewables map to replace the low-res GFS data that I've used up to now.
The difference is incredible… 🤯
The difference is incredible… 🤯