


Ralitza Soultanova
@ralitzas.bsky.social
Data Interpreter & Visualizer: Transforming Complex Data into Compelling Visual Stories. Writes about DataViz, R, Science Communication. Teaching statistics to undergraduate students.
30 Days of Charts – Day 2: Slope
Did you ever tried running or biking up Rue du Mystère in Brussels? A street with a slope of 11.3%
It might not look daunting on a graph, but trust me, it's a challenge when you are out there!
#Brussels #RueDuMystère #30DayChartChallenge #DataViz #DataVisualization
Did you ever tried running or biking up Rue du Mystère in Brussels? A street with a slope of 11.3%
It might not look daunting on a graph, but trust me, it's a challenge when you are out there!
#Brussels #RueDuMystère #30DayChartChallenge #DataViz #DataVisualization

April 2, 2025 at 4:25 PM
30 Days of Charts – Day 2: Slope
Did you ever tried running or biking up Rue du Mystère in Brussels? A street with a slope of 11.3%
It might not look daunting on a graph, but trust me, it's a challenge when you are out there!
#Brussels #RueDuMystère #30DayChartChallenge #DataViz #DataVisualization
Did you ever tried running or biking up Rue du Mystère in Brussels? A street with a slope of 11.3%
It might not look daunting on a graph, but trust me, it's a challenge when you are out there!
#Brussels #RueDuMystère #30DayChartChallenge #DataViz #DataVisualization
30 Days of Charts — Day 1 - Fractions
Education on the Rise
In Brussels, the share of young adults (aged 25–34) with a higher education diploma has steadily increased over the past 20 years. Rising from 46% in 2004 to 60% in 2024.
#30DayChartChallenge,
#fractions #dataviz
Education on the Rise
In Brussels, the share of young adults (aged 25–34) with a higher education diploma has steadily increased over the past 20 years. Rising from 46% in 2004 to 60% in 2024.
#30DayChartChallenge,
#fractions #dataviz

April 1, 2025 at 2:24 PM
30 Days of Charts — Day 1 - Fractions
Education on the Rise
In Brussels, the share of young adults (aged 25–34) with a higher education diploma has steadily increased over the past 20 years. Rising from 46% in 2004 to 60% in 2024.
#30DayChartChallenge,
#fractions #dataviz
Education on the Rise
In Brussels, the share of young adults (aged 25–34) with a higher education diploma has steadily increased over the past 20 years. Rising from 46% in 2004 to 60% in 2024.
#30DayChartChallenge,
#fractions #dataviz
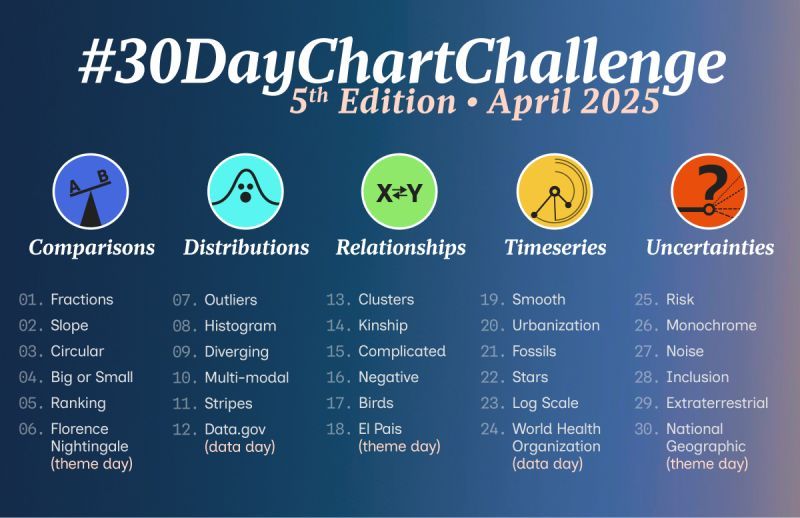
30Days of Charts starts tomorrow, and I'm excited to join #30DayChartChallenge again!
This year, I’m aiming for 10 charts throughout the month.
To stay efficient, I’ll set a 60-minute timer for each chart—otherwise, I tend to spend way too long fine-tuning the details.
This year, I’m aiming for 10 charts throughout the month.
To stay efficient, I’ll set a 60-minute timer for each chart—otherwise, I tend to spend way too long fine-tuning the details.
March 31, 2025 at 11:50 AM
30Days of Charts starts tomorrow, and I'm excited to join #30DayChartChallenge again!
This year, I’m aiming for 10 charts throughout the month.
To stay efficient, I’ll set a 60-minute timer for each chart—otherwise, I tend to spend way too long fine-tuning the details.
This year, I’m aiming for 10 charts throughout the month.
To stay efficient, I’ll set a 60-minute timer for each chart—otherwise, I tend to spend way too long fine-tuning the details.
Genuary 2025 Day 13 : Triangles and nothing else.
The rotation of a triangle.
#Genuary #Genuary2025 #JavaScript #p5 #GenerativeArt #generativeart #geometry #DigitalArt #GeometricArt #genartclub
The rotation of a triangle.
#Genuary #Genuary2025 #JavaScript #p5 #GenerativeArt #generativeart #geometry #DigitalArt #GeometricArt #genartclub

January 13, 2025 at 10:50 AM
Genuary 2025 Day 13 : Triangles and nothing else.
The rotation of a triangle.
#Genuary #Genuary2025 #JavaScript #p5 #GenerativeArt #generativeart #geometry #DigitalArt #GeometricArt #genartclub
The rotation of a triangle.
#Genuary #Genuary2025 #JavaScript #p5 #GenerativeArt #generativeart #geometry #DigitalArt #GeometricArt #genartclub


Genuary 2025 Day 12 : Subdivision.
I created fractal trees with curvature of the branches and some randomness.
#Genuary #Genuary2025 #JavaScript #p5 #GenerativeArt #generativeart #geometry #DigitalArt #GeometricArt
I created fractal trees with curvature of the branches and some randomness.
#Genuary #Genuary2025 #JavaScript #p5 #GenerativeArt #generativeart #geometry #DigitalArt #GeometricArt

January 12, 2025 at 12:56 PM
Genuary 2025 Day 12 : Subdivision.
I created fractal trees with curvature of the branches and some randomness.
#Genuary #Genuary2025 #JavaScript #p5 #GenerativeArt #generativeart #geometry #DigitalArt #GeometricArt
I created fractal trees with curvature of the branches and some randomness.
#Genuary #Genuary2025 #JavaScript #p5 #GenerativeArt #generativeart #geometry #DigitalArt #GeometricArt
Genuary 2025 Day 11 :
Impossible day - Try to do something that feels impossible for you to do.
I tried to embrace the randomness. I wanted to play with flowers without an idea of the final result I want to achieve.
#Genuary
#Genuary2025
#p5
#GenerativeArt
#geometry
#DigitalArt
Impossible day - Try to do something that feels impossible for you to do.
I tried to embrace the randomness. I wanted to play with flowers without an idea of the final result I want to achieve.
#Genuary
#Genuary2025
#p5
#GenerativeArt
#geometry
#DigitalArt
January 11, 2025 at 11:44 PM
Genuary 2025 Day 11 :
Impossible day - Try to do something that feels impossible for you to do.
I tried to embrace the randomness. I wanted to play with flowers without an idea of the final result I want to achieve.
#Genuary
#Genuary2025
#p5
#GenerativeArt
#geometry
#DigitalArt
Impossible day - Try to do something that feels impossible for you to do.
I tried to embrace the randomness. I wanted to play with flowers without an idea of the final result I want to achieve.
#Genuary
#Genuary2025
#p5
#GenerativeArt
#geometry
#DigitalArt

Genuary 2025 Day 10 : You can only use TAU in your code, no other number allowed.
That was a funny challenge
In 34 lines of code 37 uses of TAU :-)
#Genuary #Genuary2025 #JavaScript #p5 #GenerativeArt #generativeart #geometry #DigitalArt #GeometricArt
That was a funny challenge
In 34 lines of code 37 uses of TAU :-)
#Genuary #Genuary2025 #JavaScript #p5 #GenerativeArt #generativeart #geometry #DigitalArt #GeometricArt

January 10, 2025 at 1:35 PM
Genuary 2025 Day 10 : You can only use TAU in your code, no other number allowed.
That was a funny challenge
In 34 lines of code 37 uses of TAU :-)
#Genuary #Genuary2025 #JavaScript #p5 #GenerativeArt #generativeart #geometry #DigitalArt #GeometricArt
That was a funny challenge
In 34 lines of code 37 uses of TAU :-)
#Genuary #Genuary2025 #JavaScript #p5 #GenerativeArt #generativeart #geometry #DigitalArt #GeometricArt
Genuary 2025 Day 9 : The textile design patterns of public transport seating.
Colour coud have made more cense here but I'm keeping my grey scale approach
#Genuary #Genuary2025 #JavaScript #p5 #GenerativeArt #generativeart #geometry #DigitalArt #GeometricArt
Colour coud have made more cense here but I'm keeping my grey scale approach
#Genuary #Genuary2025 #JavaScript #p5 #GenerativeArt #generativeart #geometry #DigitalArt #GeometricArt


January 10, 2025 at 12:10 PM
Genuary 2025 Day 9 : The textile design patterns of public transport seating.
Colour coud have made more cense here but I'm keeping my grey scale approach
#Genuary #Genuary2025 #JavaScript #p5 #GenerativeArt #generativeart #geometry #DigitalArt #GeometricArt
Colour coud have made more cense here but I'm keeping my grey scale approach
#Genuary #Genuary2025 #JavaScript #p5 #GenerativeArt #generativeart #geometry #DigitalArt #GeometricArt

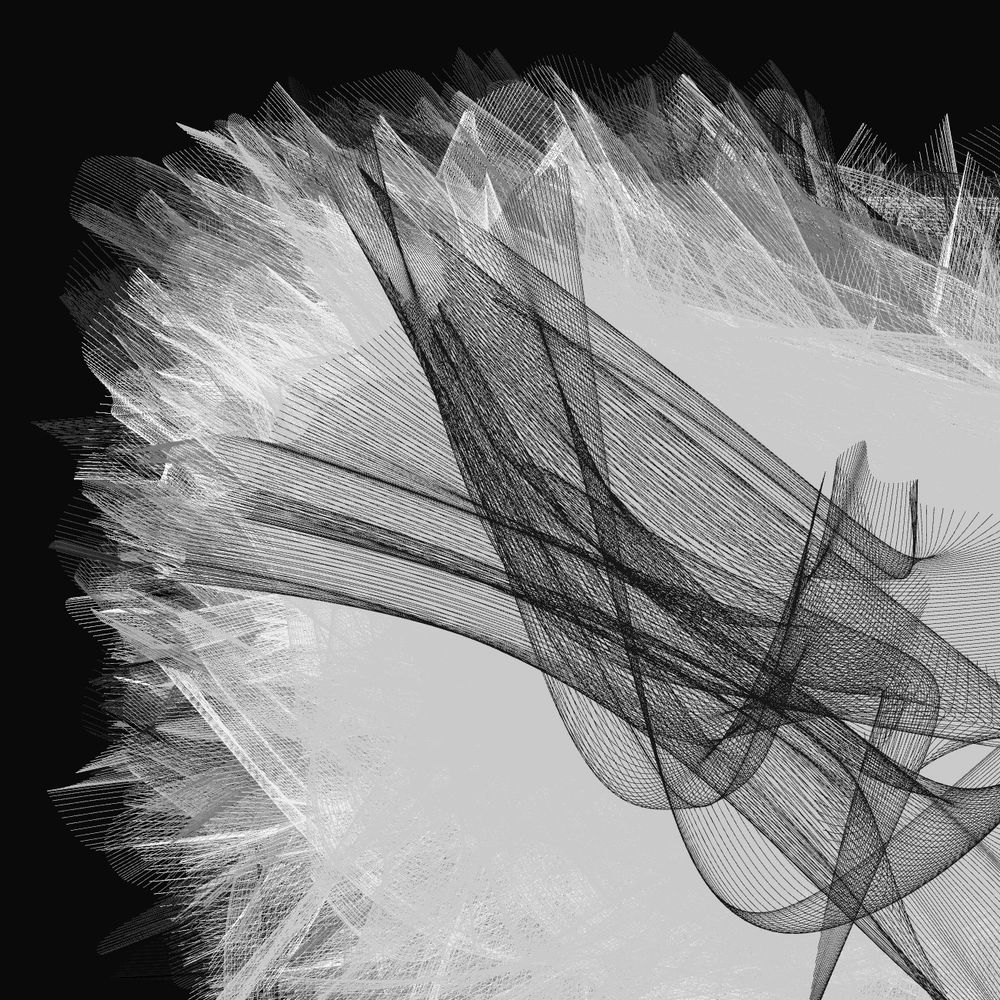
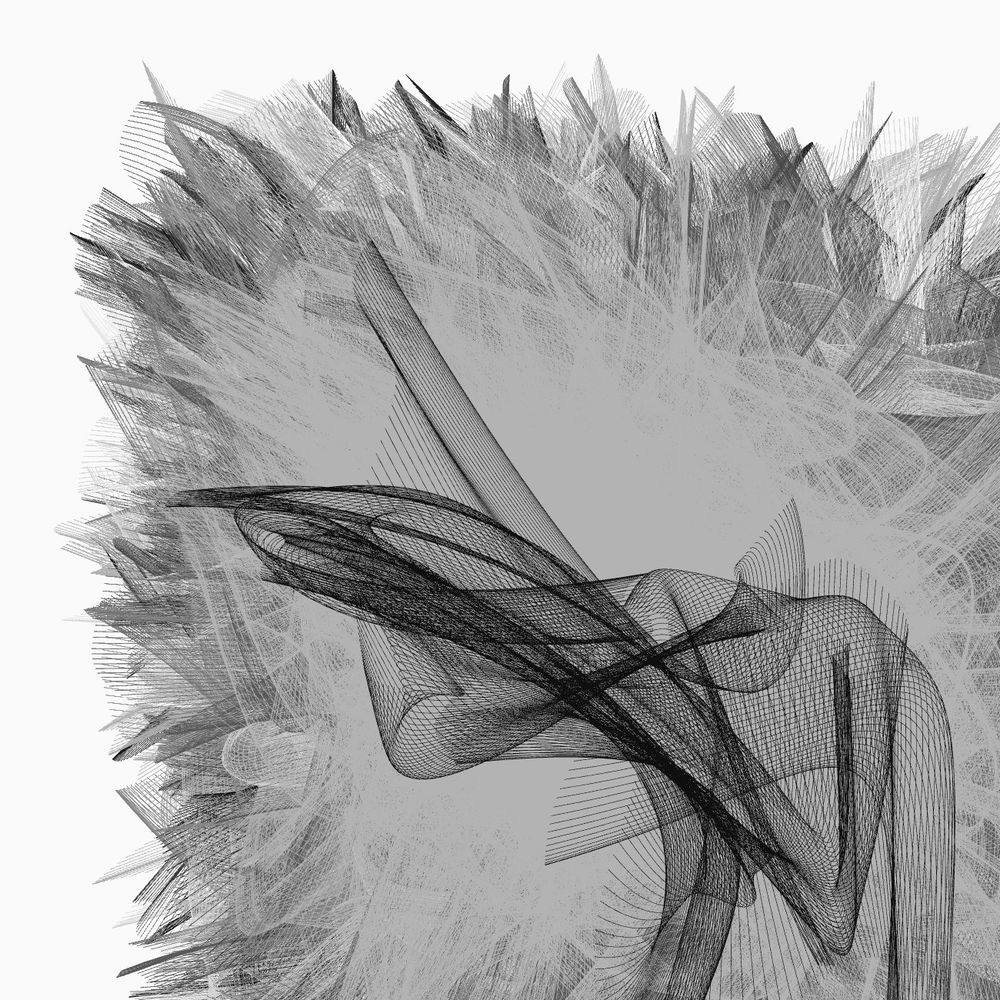
Genuary 2025 Day 8: Draw one million of something.
One million bezier curves . Random gray scale colour of the stroke is changing every 8000 strokes.
#Genuary
#Genuary2025
#JavaScript
#p5.js
#GenerativeArt
#Genuary5
#codeart
#generativeart
#geometry
#DigitalArt
#GeometricArt
One million bezier curves . Random gray scale colour of the stroke is changing every 8000 strokes.
#Genuary
#Genuary2025
#JavaScript
#p5.js
#GenerativeArt
#Genuary5
#codeart
#generativeart
#geometry
#DigitalArt
#GeometricArt
January 8, 2025 at 7:37 PM
Genuary 2025 Day 8: Draw one million of something.
One million bezier curves . Random gray scale colour of the stroke is changing every 8000 strokes.
#Genuary
#Genuary2025
#JavaScript
#p5.js
#GenerativeArt
#Genuary5
#codeart
#generativeart
#geometry
#DigitalArt
#GeometricArt
One million bezier curves . Random gray scale colour of the stroke is changing every 8000 strokes.
#Genuary
#Genuary2025
#JavaScript
#p5.js
#GenerativeArt
#Genuary5
#codeart
#generativeart
#geometry
#DigitalArt
#GeometricArt
Genuary 2025 Day 7: "Use software that is not intended to create art or images".
Here I used random numbers and conditional formatting in Excel.
#Genuary
#Genuary2025
#JavaScript
#p5.js
#GenerativeArt
#Genuary5
#codeart
#generativeart
#geometry
#DigitalArt
#GeometricArt
Here I used random numbers and conditional formatting in Excel.
#Genuary
#Genuary2025
#JavaScript
#p5.js
#GenerativeArt
#Genuary5
#codeart
#generativeart
#geometry
#DigitalArt
#GeometricArt

January 7, 2025 at 8:29 PM
Genuary 2025 Day 7: "Use software that is not intended to create art or images".
Here I used random numbers and conditional formatting in Excel.
#Genuary
#Genuary2025
#JavaScript
#p5.js
#GenerativeArt
#Genuary5
#codeart
#generativeart
#geometry
#DigitalArt
#GeometricArt
Here I used random numbers and conditional formatting in Excel.
#Genuary
#Genuary2025
#JavaScript
#p5.js
#GenerativeArt
#Genuary5
#codeart
#generativeart
#geometry
#DigitalArt
#GeometricArt
I was not very happy with version one of day 6 so decided to test something else.
Genuary 2025 Day 6: Make a landscape using only primitive shapes. Keeping it very simple for this submission.
#Genuary
#Genuary2025
#JavaScript
#p5.js
#GenerativeArt
#Genuary6
#codeart
#generativeart
#geometry
Genuary 2025 Day 6: Make a landscape using only primitive shapes. Keeping it very simple for this submission.
#Genuary
#Genuary2025
#JavaScript
#p5.js
#GenerativeArt
#Genuary6
#codeart
#generativeart
#geometry

January 7, 2025 at 1:49 PM
I was not very happy with version one of day 6 so decided to test something else.
Genuary 2025 Day 6: Make a landscape using only primitive shapes. Keeping it very simple for this submission.
#Genuary
#Genuary2025
#JavaScript
#p5.js
#GenerativeArt
#Genuary6
#codeart
#generativeart
#geometry
Genuary 2025 Day 6: Make a landscape using only primitive shapes. Keeping it very simple for this submission.
#Genuary
#Genuary2025
#JavaScript
#p5.js
#GenerativeArt
#Genuary6
#codeart
#generativeart
#geometry
Genuary 2025 Day 6: Make a landscape using only primitive shapes. Keeping it very simple for this submission.
#Genuary
#Genuary2025
#JavaScript
#p5.js
#GenerativeArt
#Genuary6
#codeart
#generativeart
#geometry
#Genuary
#Genuary2025
#JavaScript
#p5.js
#GenerativeArt
#Genuary6
#codeart
#generativeart
#geometry
January 6, 2025 at 7:50 AM
Genuary 2025 Day 6: Make a landscape using only primitive shapes. Keeping it very simple for this submission.
#Genuary
#Genuary2025
#JavaScript
#p5.js
#GenerativeArt
#Genuary6
#codeart
#generativeart
#geometry
#Genuary
#Genuary2025
#JavaScript
#p5.js
#GenerativeArt
#Genuary6
#codeart
#generativeart
#geometry
Genuary 2025 Day 5: isometric art
Today I played with isometric cubes
#Genuary
#Genuary2025
#JavaScript
#p5.js
#GenerativeArt
#Genuary5

January 5, 2025 at 3:59 PM
Genuary 2025 Day 5: isometric art
Today I played with isometric cubes
#Genuary
#Genuary2025
#JavaScript
#p5.js
#GenerativeArt
#Genuary5
Genuary 2025 Day 4: Black On Black on Black
#Genuary
#Genuary2025
#JavaScript
#p5.js
#GenerativeArt
#Genuary4
#Genuary
#Genuary2025
#JavaScript
#p5.js
#GenerativeArt
#Genuary4

January 4, 2025 at 3:25 PM
Genuary 2025 Day 4: Black On Black on Black
#Genuary
#Genuary2025
#JavaScript
#p5.js
#GenerativeArt
#Genuary4
#Genuary
#Genuary2025
#JavaScript
#p5.js
#GenerativeArt
#Genuary4
✨ Interactive CV Journey ✨
Today, I created a visual interactive CV to showcase how mathematics, social sciences, and photography have been the pillars of my career and life. 🌟
Do you happen to know how to make tooltips work with streamgraph and GGPlot?
📊, #dataviz, #datavis, #R, #Florish
Today, I created a visual interactive CV to showcase how mathematics, social sciences, and photography have been the pillars of my career and life. 🌟
Do you happen to know how to make tooltips work with streamgraph and GGPlot?
📊, #dataviz, #datavis, #R, #Florish
November 17, 2024 at 9:13 PM
🚀𝐋𝐚𝐭𝐞𝐬𝐭 𝐝𝐚𝐭𝐚 𝐯𝐢𝐬𝐮𝐚𝐥𝐢𝐳𝐚𝐭𝐢𝐨𝐧 𝐩𝐫𝐨𝐣𝐞𝐜𝐭 𝐰𝐢𝐭𝐡 𝐕𝐢𝐳 𝐟𝐨𝐫 𝐒𝐨𝐜𝐢𝐚𝐥 𝐆𝐨𝐨𝐝 𝐟𝐨𝐫 𝐭𝐡𝐞 𝐔𝐍 𝐖𝐨𝐫𝐥𝐝 𝐃𝐚𝐭𝐚 𝐅𝐨𝐫𝐮𝐦 𝐁𝐨𝐨𝐭𝐜𝐚𝐦𝐩! 🚀
I created an interactive map that brings to life data on Colombia’s international entry points and top visitor nationalities.
Link to the Medium article describing the steps
t.ly/3NpLG
I created an interactive map that brings to life data on Colombia’s international entry points and top visitor nationalities.
Link to the Medium article describing the steps
t.ly/3NpLG


November 5, 2024 at 3:58 PM
🚀𝐋𝐚𝐭𝐞𝐬𝐭 𝐝𝐚𝐭𝐚 𝐯𝐢𝐬𝐮𝐚𝐥𝐢𝐳𝐚𝐭𝐢𝐨𝐧 𝐩𝐫𝐨𝐣𝐞𝐜𝐭 𝐰𝐢𝐭𝐡 𝐕𝐢𝐳 𝐟𝐨𝐫 𝐒𝐨𝐜𝐢𝐚𝐥 𝐆𝐨𝐨𝐝 𝐟𝐨𝐫 𝐭𝐡𝐞 𝐔𝐍 𝐖𝐨𝐫𝐥𝐝 𝐃𝐚𝐭𝐚 𝐅𝐨𝐫𝐮𝐦 𝐁𝐨𝐨𝐭𝐜𝐚𝐦𝐩! 🚀
I created an interactive map that brings to life data on Colombia’s international entry points and top visitor nationalities.
Link to the Medium article describing the steps
t.ly/3NpLG
I created an interactive map that brings to life data on Colombia’s international entry points and top visitor nationalities.
Link to the Medium article describing the steps
t.ly/3NpLG