


Platform Puff Watch
@platformpuffwatch.bsky.social
Not a narc, just a patio enthusiast trying to avoid a contact high and documenting #AirQuality changes while my neighbors partake.
#BoylanHeights | #Raleigh | #NorthCarolina | #CleanAir | #AQI | #Python | #ggplot | #DataViz
#BoylanHeights | #Raleigh | #NorthCarolina | #CleanAir | #AQI | #Python | #ggplot | #DataViz
Mark your calendars, Puffwatchers! The #BoylanHeights Artwalk in #Raleigh, NC is almost here! Expect bold colors, local talent, and a faint aroma of “creative inspiration.” #PuffWatch

November 26, 2025 at 11:20 AM
Mark your calendars, Puffwatchers! The #BoylanHeights Artwalk in #Raleigh, NC is almost here! Expect bold colors, local talent, and a faint aroma of “creative inspiration.” #PuffWatch
Big day in #BoylanHeights #Raleigh: the Boylan Bridge finally got a crosswalk.
For the first time, crossing it doesn’t double as sprint training. May the odds of stopping be ever in motorists’ favor.
For the first time, crossing it doesn’t double as sprint training. May the odds of stopping be ever in motorists’ favor.


October 24, 2025 at 11:48 AM
Big day in #BoylanHeights #Raleigh: the Boylan Bridge finally got a crosswalk.
For the first time, crossing it doesn’t double as sprint training. May the odds of stopping be ever in motorists’ favor.
For the first time, crossing it doesn’t double as sprint training. May the odds of stopping be ever in motorists’ favor.
The haze has returned to its rightful district. Welcome back to #BoylanHeights. #PuffWatch #DataBl(haze) #ClearAir #AirQuality

September 4, 2025 at 2:03 AM
The haze has returned to its rightful district. Welcome back to #BoylanHeights. #PuffWatch #DataBl(haze) #ClearAir #AirQuality
The haze has lifted... and moved to a new zip code.
Final #Platform #PuffWatch timing breakdown: Complete smoking session heatmap
Collected from Sept. 30th, 2024 to May 19th, 2025. No #tariffs needed — this data was made in America.
#DataViz #ggplot #EndofBlaze #AirQuality #ClearAir #TACO
Final #Platform #PuffWatch timing breakdown: Complete smoking session heatmap
Collected from Sept. 30th, 2024 to May 19th, 2025. No #tariffs needed — this data was made in America.
#DataViz #ggplot #EndofBlaze #AirQuality #ClearAir #TACO
June 1, 2025 at 8:20 PM
The haze has lifted... and moved to a new zip code.
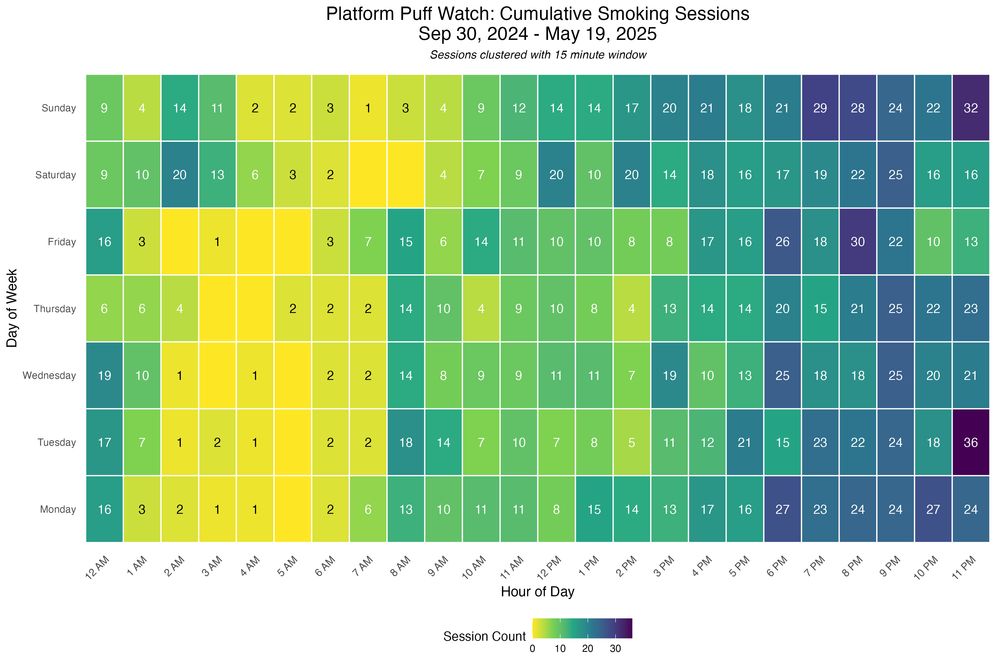
Final #Platform #PuffWatch timing breakdown: Complete smoking session heatmap
Collected from Sept. 30th, 2024 to May 19th, 2025. No #tariffs needed — this data was made in America.
#DataViz #ggplot #EndofBlaze #AirQuality #ClearAir #TACO
Final #Platform #PuffWatch timing breakdown: Complete smoking session heatmap
Collected from Sept. 30th, 2024 to May 19th, 2025. No #tariffs needed — this data was made in America.
#DataViz #ggplot #EndofBlaze #AirQuality #ClearAir #TACO
The smoke has cleared (sort of).
Here’s the #Platform #PuffWatch intensity breakdown: Max PM2.5 spike per session, tracked from Sept. 30, 2024, to May 19, 2025.
The haze never lies.
#AirQuality #ClearAir #HazyPatterns #DataViz #DataBlaze #TACO
Here’s the #Platform #PuffWatch intensity breakdown: Max PM2.5 spike per session, tracked from Sept. 30, 2024, to May 19, 2025.
The haze never lies.
#AirQuality #ClearAir #HazyPatterns #DataViz #DataBlaze #TACO
June 1, 2025 at 2:00 PM
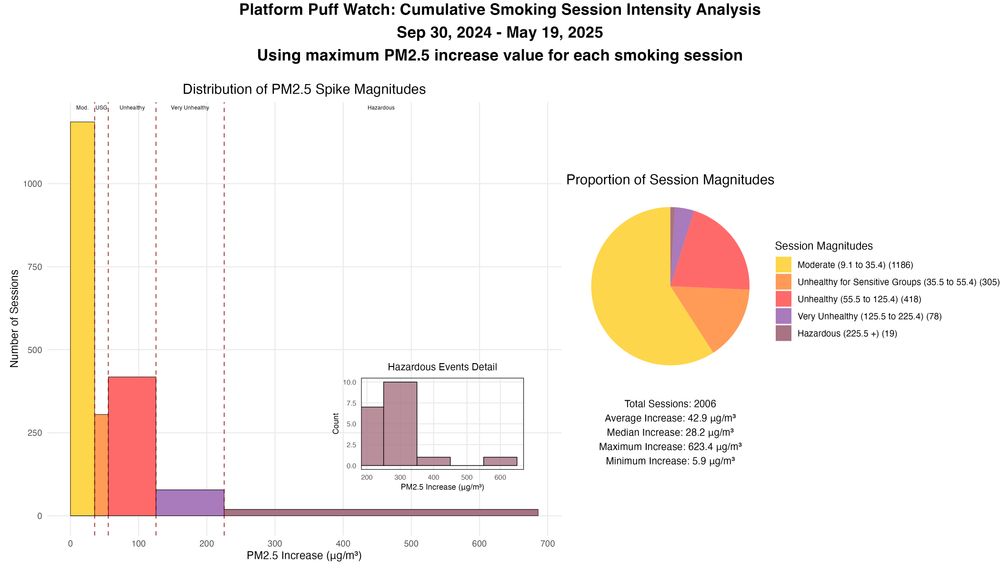
The smoke has cleared (sort of).
Here’s the #Platform #PuffWatch intensity breakdown: Max PM2.5 spike per session, tracked from Sept. 30, 2024, to May 19, 2025.
The haze never lies.
#AirQuality #ClearAir #HazyPatterns #DataViz #DataBlaze #TACO
Here’s the #Platform #PuffWatch intensity breakdown: Max PM2.5 spike per session, tracked from Sept. 30, 2024, to May 19, 2025.
The haze never lies.
#AirQuality #ClearAir #HazyPatterns #DataViz #DataBlaze #TACO
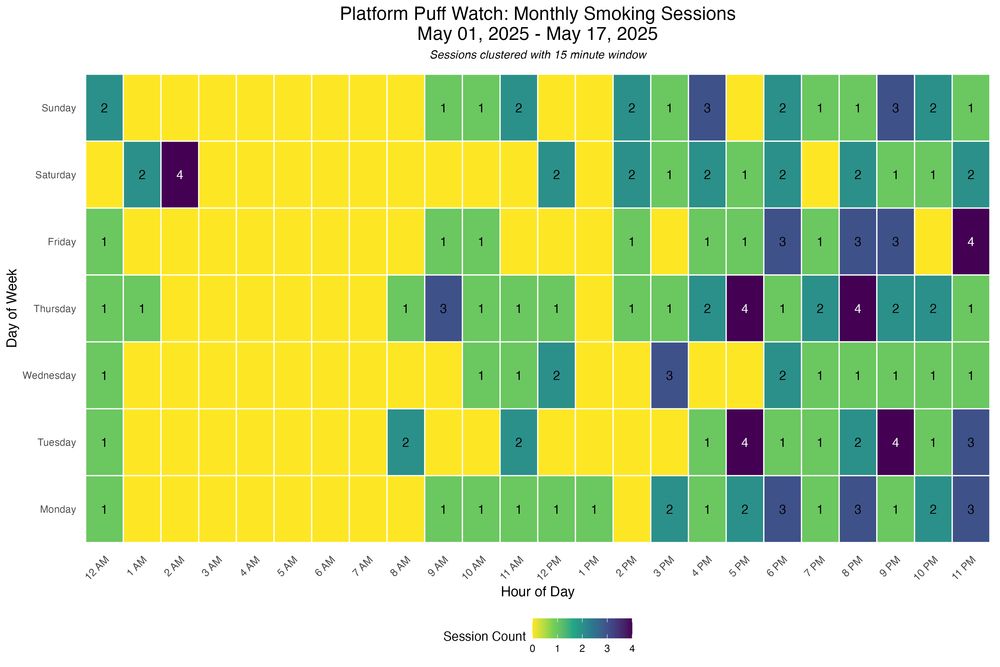
📊 #Platform #PuffWatch heatmap since May 1st reveals smoking patterns by day and hour. Clustering window: 15 minutes. #DataViz #ggplot #DataHaze #AirQuality #ClearAir
May 25, 2025 at 8:20 PM
📊 #Platform #PuffWatch heatmap since May 1st reveals smoking patterns by day and hour. Clustering window: 15 minutes. #DataViz #ggplot #DataHaze #AirQuality #ClearAir
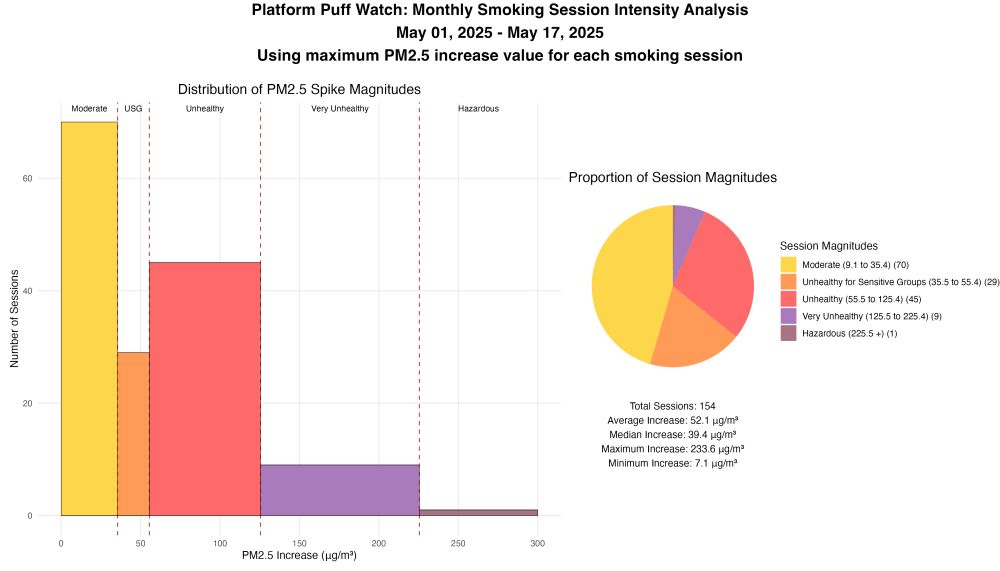
#Platform #PuffWatch smoking intensity breakdown collected since May 1: Using max PM2.5 spike per session. Not much different from last week, since my neighbor moved mid-week. #AirQuality #ClearAir #HazyPatterns #DataViz #DataBlaze

May 25, 2025 at 4:20 PM
#Platform #PuffWatch smoking intensity breakdown collected since May 1: Using max PM2.5 spike per session. Not much different from last week, since my neighbor moved mid-week. #AirQuality #ClearAir #HazyPatterns #DataViz #DataBlaze
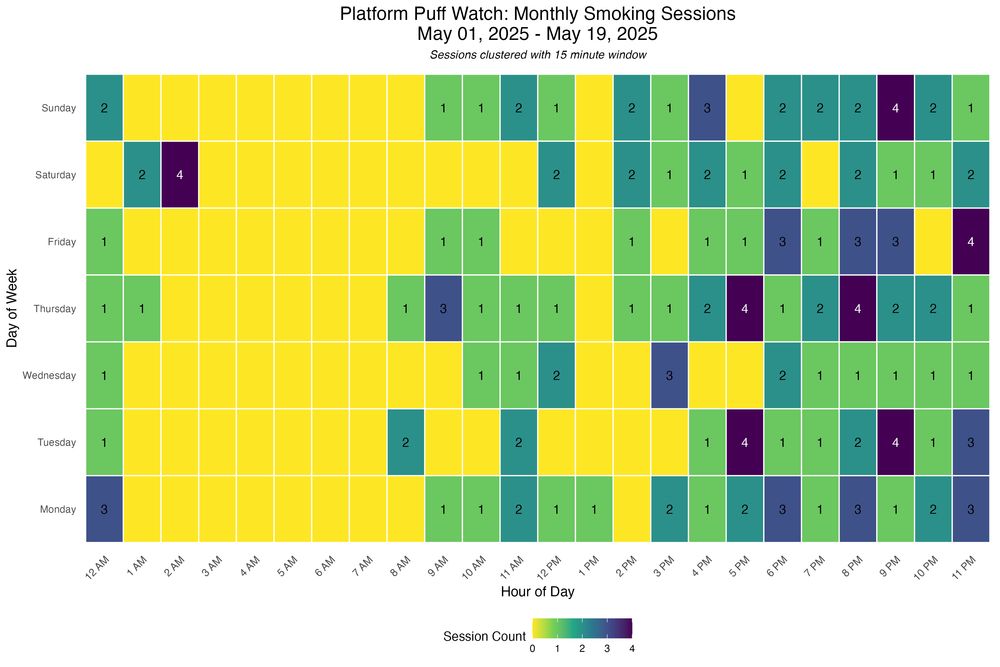
📊 #Platform #PuffWatch heatmap since May 1st reveals smoking patterns by day and hour. Clustering window: 15 minutes. #DataViz #ggplot #DataHaze
May 18, 2025 at 8:20 PM
📊 #Platform #PuffWatch heatmap since May 1st reveals smoking patterns by day and hour. Clustering window: 15 minutes. #DataViz #ggplot #DataHaze
#Platform #PuffWatch smoking intensity breakdown collected since May 1: Using max PM2.5 spike per session. #AirQuality #HazyPatterns #DataViz #DataBlaze
May 18, 2025 at 1:16 PM
#Platform #PuffWatch smoking intensity breakdown collected since May 1: Using max PM2.5 spike per session. #AirQuality #HazyPatterns #DataViz #DataBlaze

May 17, 2025 at 12:20 AM

May 16, 2025 at 11:40 PM
📊 #Platform #PuffWatch #NewVizAlert Ridge plot for May reveals smoking patterns by day and hour. Clustering window: 15 minutes. #DataViz #ggplot #DataHaze

May 11, 2025 at 8:20 PM
📊 #Platform #PuffWatch #NewVizAlert Ridge plot for May reveals smoking patterns by day and hour. Clustering window: 15 minutes. #DataViz #ggplot #DataHaze
#Platform #PuffWatch smoking intensity breakdown collected since May 1: Using max PM2.5 spike per session. #AirQuality #HazyPatterns #DataViz #DataBlaze

May 11, 2025 at 1:20 PM
#Platform #PuffWatch smoking intensity breakdown collected since May 1: Using max PM2.5 spike per session. #AirQuality #HazyPatterns #DataViz #DataBlaze
📊 #Platform #PuffWatch heatmap since March 16th reveals smoking patterns by day and hour. Clustering window: 15 minutes. #DataViz #ggplot #DataHaze

May 4, 2025 at 8:20 PM
📊 #Platform #PuffWatch heatmap since March 16th reveals smoking patterns by day and hour. Clustering window: 15 minutes. #DataViz #ggplot #DataHaze
#Platform #PuffWatch smoking intensity breakdown collected since mid-March: Using max PM2.5 spike per session. #AirQuality #HazyPatterns #DataViz #DataBlaze

May 4, 2025 at 1:23 PM
#Platform #PuffWatch smoking intensity breakdown collected since mid-March: Using max PM2.5 spike per session. #AirQuality #HazyPatterns #DataViz #DataBlaze
📉 #Platform #PuffWatch smoking intensity breakdown collected since April 1st: Using max PM2.5 spike per session. #AirQuality #HazyPatterns #DataViz #DataBlaze

April 27, 2025 at 8:20 PM
📉 #Platform #PuffWatch smoking intensity breakdown collected since April 1st: Using max PM2.5 spike per session. #AirQuality #HazyPatterns #DataViz #DataBlaze
📊 #Platform #PuffWatch heatmap for April reveals smoking patterns by day and hour. Clustering window: 15 minutes. #DataViz #ggplot #DataHaze

April 27, 2025 at 1:00 PM
📊 #Platform #PuffWatch heatmap for April reveals smoking patterns by day and hour. Clustering window: 15 minutes. #DataViz #ggplot #DataHaze

📉 #Platform #PuffWatch smoking intensity breakdown collected since April 1st: Using max PM2.5 spike per session. You'll notice the colors are different his week. We chose them to more closely align with current #AirQuality reporting standards #HazyPatterns #DataViz #Happy420

April 20, 2025 at 12:39 PM
📉 #Platform #PuffWatch smoking intensity breakdown collected since April 1st: Using max PM2.5 spike per session. You'll notice the colors are different his week. We chose them to more closely align with current #AirQuality reporting standards #HazyPatterns #DataViz #Happy420
For TVOC, we use a Sensirion SGP41 digital gas sensor. In the VOC Index, 100 refers to the average gas composition over the past 24h.
Values between 100 and 500 indicate deterioration and values between 1 and 100 indicate improvement in VOC-based air quality.
Values between 100 and 500 indicate deterioration and values between 1 and 100 indicate improvement in VOC-based air quality.

April 13, 2025 at 9:47 PM
For TVOC, we use a Sensirion SGP41 digital gas sensor. In the VOC Index, 100 refers to the average gas composition over the past 24h.
Values between 100 and 500 indicate deterioration and values between 1 and 100 indicate improvement in VOC-based air quality.
Values between 100 and 500 indicate deterioration and values between 1 and 100 indicate improvement in VOC-based air quality.
📊 #Platform #PuffWatch heatmap from the beginning of data collection reveals smoking patterns by day and hour. Clustering window: 15 minutes. #DataViz #ggplot

April 13, 2025 at 3:43 PM
📊 #Platform #PuffWatch heatmap from the beginning of data collection reveals smoking patterns by day and hour. Clustering window: 15 minutes. #DataViz #ggplot
📉 #Platform #PuffWatch smoking intensity breakdown collected since Paril 1st: Using max PM2.5 spike per session. #AirQualityData #HazyPatterns #DataViz

April 13, 2025 at 1:39 PM
📉 #Platform #PuffWatch smoking intensity breakdown collected since Paril 1st: Using max PM2.5 spike per session. #AirQualityData #HazyPatterns #DataViz
Do you all prefer heat maps or ridge plots to visualize event distributions? #DataViz #PuffWatch #ggplot #DataHaze

April 6, 2025 at 8:20 PM
Do you all prefer heat maps or ridge plots to visualize event distributions? #DataViz #PuffWatch #ggplot #DataHaze
