


Grobkosthändler Patzlak 🇪🇺 🇺🇦 🌻💉
@patzlak.bsky.social
Code monkey, Gamer, Chemtrail-Pilot.
#NOAFD
#NOAFD
Reposted by Grobkosthändler Patzlak 🇪🇺 🇺🇦 🌻💉

Last year was obviously the warmest on record for the North Pacific Ocean...
This graph shows the average for a band across the midlatitudes for every year from 1854-2025 using @noaa.gov ERSSTv5 data.
This graph shows the average for a band across the midlatitudes for every year from 1854-2025 using @noaa.gov ERSSTv5 data.

January 10, 2026 at 2:14 AM
Last year was obviously the warmest on record for the North Pacific Ocean...
This graph shows the average for a band across the midlatitudes for every year from 1854-2025 using @noaa.gov ERSSTv5 data.
This graph shows the average for a band across the midlatitudes for every year from 1854-2025 using @noaa.gov ERSSTv5 data.
Reposted by Grobkosthändler Patzlak 🇪🇺 🇺🇦 🌻💉

Angriff gegen die Verfassung der Bundesrepublik: Bei einem geheimen Treffen haben einflussreiche AfD-Politiker mit bekannten Rechtsextremisten und Unternehmern einen Plan. Sie wollen Millionen von Menschen aus Deutschland vertreiben. Was die Anwesenden nicht wussten: CORRECTIV war vor Ort...
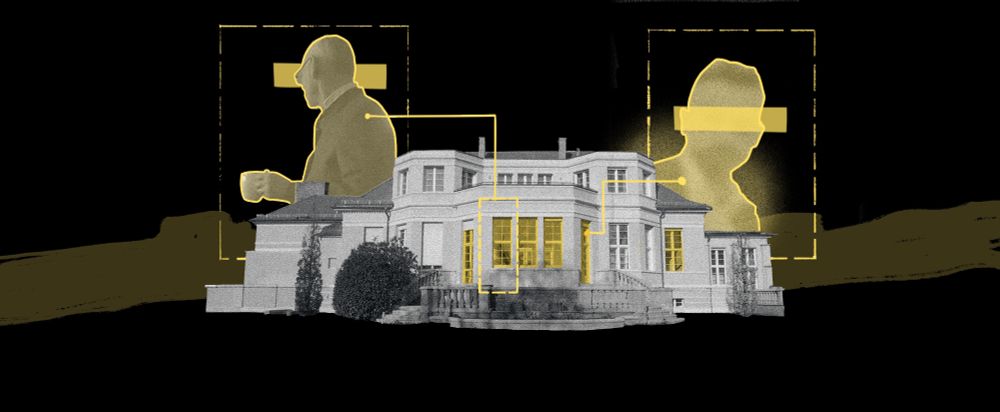
Geheimplan gegen Deutschland
Hochrangige AfD-Politiker, Neonazis und finanzstarke Unternehmer planten die Vertreibung von Millionen von Menschen aus Deutschland.
correctiv.org
January 10, 2024 at 5:25 AM
Angriff gegen die Verfassung der Bundesrepublik: Bei einem geheimen Treffen haben einflussreiche AfD-Politiker mit bekannten Rechtsextremisten und Unternehmern einen Plan. Sie wollen Millionen von Menschen aus Deutschland vertreiben. Was die Anwesenden nicht wussten: CORRECTIV war vor Ort...