


Oliver Ruhnau
@oliverruhnau.bsky.social
Assistant Professor for Energy Market Design @UniCologne | Reserach Scientist @EWI Energy Economics Institute | Previously Centre for Sustainability @HertieSchool
Regional diversification yields 3-7% for 2 locations and increase with the number of locations (see figure).
For a Germany-wide aggregation, portfolio effects increase to 14-21% (see full paper).
For a Germany-wide aggregation, portfolio effects increase to 14-21% (see full paper).

April 8, 2024 at 9:46 AM
Regional diversification yields 3-7% for 2 locations and increase with the number of locations (see figure).
For a Germany-wide aggregation, portfolio effects increase to 14-21% (see full paper).
For a Germany-wide aggregation, portfolio effects increase to 14-21% (see full paper).
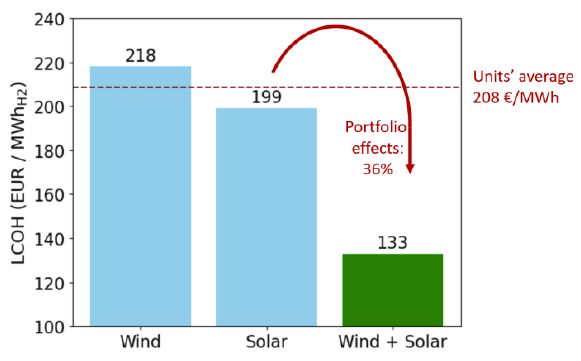
Technological diversification, i.e., a combination of wind and solar, at one location brings the greatest portfolio effects (36% in the exemplary graph).
April 8, 2024 at 9:45 AM
Technological diversification, i.e., a combination of wind and solar, at one location brings the greatest portfolio effects (36% in the exemplary graph).
Temporal matching between H2 production and contracted renewable electricity has been discussed and implemented, e.g., in the context of the EU RED and the US IRA.
Previous studies investigating H2 matching use different assumptions on regional aggregation.
What does that imply?
Previous studies investigating H2 matching use different assumptions on regional aggregation.
What does that imply?

April 8, 2024 at 9:44 AM
Temporal matching between H2 production and contracted renewable electricity has been discussed and implemented, e.g., in the context of the EU RED and the US IRA.
Previous studies investigating H2 matching use different assumptions on regional aggregation.
What does that imply?
Previous studies investigating H2 matching use different assumptions on regional aggregation.
What does that imply?
Recent German survey on accepting onshore wind turbines in residential environment:
Without existing turbines (left), the majority has no or small concerns wrt new projects (27 and 41%)
With existing turbines (right), the majority fully or tendentially support them (44 and 36%)
Without existing turbines (left), the majority has no or small concerns wrt new projects (27 and 41%)
With existing turbines (right), the majority fully or tendentially support them (44 and 36%)

February 23, 2024 at 6:12 AM
Recent German survey on accepting onshore wind turbines in residential environment:
Without existing turbines (left), the majority has no or small concerns wrt new projects (27 and 41%)
With existing turbines (right), the majority fully or tendentially support them (44 and 36%)
Without existing turbines (left), the majority has no or small concerns wrt new projects (27 and 41%)
With existing turbines (right), the majority fully or tendentially support them (44 and 36%)
Dynamic electricity tariffs
In Germany, I often hear that, even with smart meters and dynamic tariff offerings in place, not many consumers would choose them.
Norway is an impressive counterexample: >90% of households are on spot tariffs
In Germany, I often hear that, even with smart meters and dynamic tariff offerings in place, not many consumers would choose them.
Norway is an impressive counterexample: >90% of households are on spot tariffs

February 19, 2024 at 9:15 AM
Dynamic electricity tariffs
In Germany, I often hear that, even with smart meters and dynamic tariff offerings in place, not many consumers would choose them.
Norway is an impressive counterexample: >90% of households are on spot tariffs
In Germany, I often hear that, even with smart meters and dynamic tariff offerings in place, not many consumers would choose them.
Norway is an impressive counterexample: >90% of households are on spot tariffs
Germany keeps falling short of government targets for onshore wind deployment.
But these trends are really promising:
+48% in newly installed capacity
+78% in newly permitted capacity
But these trends are really promising:
+48% in newly installed capacity
+78% in newly permitted capacity

January 25, 2024 at 1:21 PM
Germany keeps falling short of government targets for onshore wind deployment.
But these trends are really promising:
+48% in newly installed capacity
+78% in newly permitted capacity
But these trends are really promising:
+48% in newly installed capacity
+78% in newly permitted capacity
Quo vadis EU ETS price?
Nice up-to-date synthesis by Pahle et al. from PIK as part of the Ariadne project
https://ariadneprojekt.de/media/2023/12/Ariadne-Documentation_ETSWorkshopBruessel_December2023.pdf
Nice up-to-date synthesis by Pahle et al. from PIK as part of the Ariadne project
https://ariadneprojekt.de/media/2023/12/Ariadne-Documentation_ETSWorkshopBruessel_December2023.pdf

January 6, 2024 at 8:45 AM
Quo vadis EU ETS price?
Nice up-to-date synthesis by Pahle et al. from PIK as part of the Ariadne project
https://ariadneprojekt.de/media/2023/12/Ariadne-Documentation_ETSWorkshopBruessel_December2023.pdf
Nice up-to-date synthesis by Pahle et al. from PIK as part of the Ariadne project
https://ariadneprojekt.de/media/2023/12/Ariadne-Documentation_ETSWorkshopBruessel_December2023.pdf
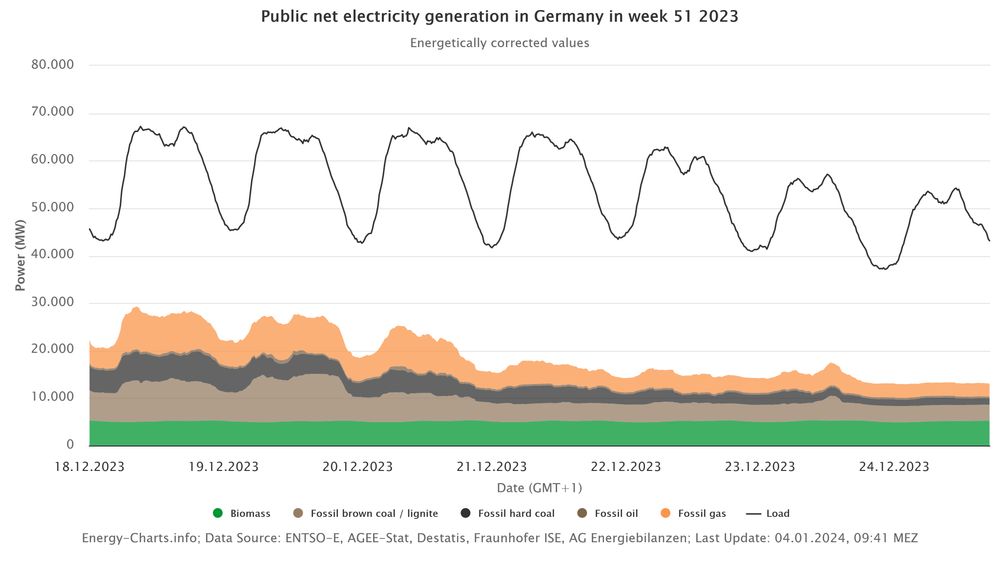
New evidence on "must-run" electricity generation in Germany
When power prices dropped to zero and below for 38 hours in a row at Christmas, 13 GW of controllable generators remained online
(5 bio, 3.4 lignite, 2.8 gas, 1.4 coal, 0.4 oil)
What are the reasons?
When power prices dropped to zero and below for 38 hours in a row at Christmas, 13 GW of controllable generators remained online
(5 bio, 3.4 lignite, 2.8 gas, 1.4 coal, 0.4 oil)
What are the reasons?
January 4, 2024 at 10:18 AM
New evidence on "must-run" electricity generation in Germany
When power prices dropped to zero and below for 38 hours in a row at Christmas, 13 GW of controllable generators remained online
(5 bio, 3.4 lignite, 2.8 gas, 1.4 coal, 0.4 oil)
What are the reasons?
When power prices dropped to zero and below for 38 hours in a row at Christmas, 13 GW of controllable generators remained online
(5 bio, 3.4 lignite, 2.8 gas, 1.4 coal, 0.4 oil)
What are the reasons?
In our case study, the estimate flexibility potential with the virtual storage approach is about 6 kWh/EV.
This is 10x smaller than with naive aggregation (which converges to the assumed average battery size of 62 kWh/EV).
This is 10x smaller than with naive aggregation (which converges to the assumed average battery size of 62 kWh/EV).

December 12, 2023 at 10:52 AM
In our case study, the estimate flexibility potential with the virtual storage approach is about 6 kWh/EV.
This is 10x smaller than with naive aggregation (which converges to the assumed average battery size of 62 kWh/EV).
This is 10x smaller than with naive aggregation (which converges to the assumed average battery size of 62 kWh/EV).
The virtual storage approach does not overestimate the solution space in energy terms (i.e. the flexibility potential) because it aggregates the solution spaces of the individual EVs (rather than aggregating constraints).

December 12, 2023 at 10:51 AM
The virtual storage approach does not overestimate the solution space in energy terms (i.e. the flexibility potential) because it aggregates the solution spaces of the individual EVs (rather than aggregating constraints).
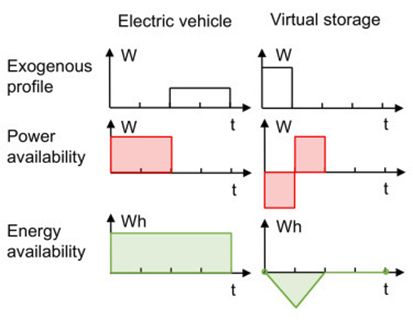
As an alternative for a (more) accurate representation of EV flexibility, we introduce the virtual storage approach.
This decomposes flexible charging into an inflexible reference charging strategy and a flexible deviation from this reference.
This decomposes flexible charging into an inflexible reference charging strategy and a flexible deviation from this reference.
December 12, 2023 at 10:50 AM
As an alternative for a (more) accurate representation of EV flexibility, we introduce the virtual storage approach.
This decomposes flexible charging into an inflexible reference charging strategy and a flexible deviation from this reference.
This decomposes flexible charging into an inflexible reference charging strategy and a flexible deviation from this reference.
We show that naive aggregation, i.e. adding up individual EV constraints, leads to an overestimation of the fleet's flexibility potential.

December 12, 2023 at 10:50 AM
We show that naive aggregation, i.e. adding up individual EV constraints, leads to an overestimation of the fleet's flexibility potential.
Modeling volatility must capture that a fleet of EVs will consume power more smoothly than single EVs.
We show that many diverse profiles are needed to adequately represent the peak load of an EV fleet.
(left axis: per EV, right axis: 15 mn EVs in DE 2030)
We show that many diverse profiles are needed to adequately represent the peak load of an EV fleet.
(left axis: per EV, right axis: 15 mn EVs in DE 2030)

December 12, 2023 at 10:49 AM
Modeling volatility must capture that a fleet of EVs will consume power more smoothly than single EVs.
We show that many diverse profiles are needed to adequately represent the peak load of an EV fleet.
(left axis: per EV, right axis: 15 mn EVs in DE 2030)
We show that many diverse profiles are needed to adequately represent the peak load of an EV fleet.
(left axis: per EV, right axis: 15 mn EVs in DE 2030)
Electric vehicles (EVs) have a dark and a light side for the power sector: they may add harmful volatility and provide valuable flexibility.
How can we adequately capture both in energy system models?
Check out our new publication with @jaruschm.bsky.social on this topic below
How can we adequately capture both in energy system models?
Check out our new publication with @jaruschm.bsky.social on this topic below

December 12, 2023 at 10:48 AM
Electric vehicles (EVs) have a dark and a light side for the power sector: they may add harmful volatility and provide valuable flexibility.
How can we adequately capture both in energy system models?
Check out our new publication with @jaruschm.bsky.social on this topic below
How can we adequately capture both in energy system models?
Check out our new publication with @jaruschm.bsky.social on this topic below
If disamenity costs were high (which is not clear from the literature), 35% less wind power is built.

December 5, 2023 at 2:28 PM
If disamenity costs were high (which is not clear from the literature), 35% less wind power is built.
Different approaches for linearizing cost-potential curves are tested. The 5-steps-function seems to be a sweet spot.

December 5, 2023 at 2:27 PM
Different approaches for linearizing cost-potential curves are tested. The 5-steps-function seems to be a sweet spot.
Energy transition will require substantially *less* mining than the current fossil system
Yes, we need more metals (copper, nickel...) but this increase is overcompensated by a decrease in coal mining
New research at Joule
Free author link: authors.elsevier.com/a/1h%7EXc925...
Yes, we need more metals (copper, nickel...) but this increase is overcompensated by a decrease in coal mining
New research at Joule
Free author link: authors.elsevier.com/a/1h%7EXc925...

November 20, 2023 at 1:57 PM
Energy transition will require substantially *less* mining than the current fossil system
Yes, we need more metals (copper, nickel...) but this increase is overcompensated by a decrease in coal mining
New research at Joule
Free author link: authors.elsevier.com/a/1h%7EXc925...
Yes, we need more metals (copper, nickel...) but this increase is overcompensated by a decrease in coal mining
New research at Joule
Free author link: authors.elsevier.com/a/1h%7EXc925...
Planned vs. optimized electrolyzer locations
This is why we need to split the bidding zone (among other reasons)
Comparing new data by EWI Köln (www.eon.com/de/hydrogen/...) with study by Frederik vom Scheidt et al. (www.sciencedirect.com/science/arti...)
This is why we need to split the bidding zone (among other reasons)
Comparing new data by EWI Köln (www.eon.com/de/hydrogen/...) with study by Frederik vom Scheidt et al. (www.sciencedirect.com/science/arti...)

November 17, 2023 at 12:57 PM
Planned vs. optimized electrolyzer locations
This is why we need to split the bidding zone (among other reasons)
Comparing new data by EWI Köln (www.eon.com/de/hydrogen/...) with study by Frederik vom Scheidt et al. (www.sciencedirect.com/science/arti...)
This is why we need to split the bidding zone (among other reasons)
Comparing new data by EWI Köln (www.eon.com/de/hydrogen/...) with study by Frederik vom Scheidt et al. (www.sciencedirect.com/science/arti...)