


rosa yang
@namboline.bsky.social
Ritorno a Genova, città mia ❤️


August 20, 2025 at 4:58 PM
Ritorno a Genova, città mia ❤️

#Marseille #Corruption
Chronologie des Périls Urbains à Marseille by ade yang
Next : l'enrichissement et l'impunité des architectes et experts de la ville
#GIS, #DataScience, #UrbanPlanning, #Mapping, #France, #PérilsUrbains
Chronologie des Périls Urbains à Marseille by ade yang
Next : l'enrichissement et l'impunité des architectes et experts de la ville
#GIS, #DataScience, #UrbanPlanning, #Mapping, #France, #PérilsUrbains
July 12, 2025 at 9:01 PM
#Marseille #Corruption
Chronologie des Périls Urbains à Marseille by ade yang
Next : l'enrichissement et l'impunité des architectes et experts de la ville
#GIS, #DataScience, #UrbanPlanning, #Mapping, #France, #PérilsUrbains
Chronologie des Périls Urbains à Marseille by ade yang
Next : l'enrichissement et l'impunité des architectes et experts de la ville
#GIS, #DataScience, #UrbanPlanning, #Mapping, #France, #PérilsUrbains
Bisous de Paris
Aux vrais Marseillais et Marseillaises ! (parodie of course)
Aux vrais Marseillais et Marseillaises ! (parodie of course)

July 8, 2025 at 9:04 PM
Bisous de Paris
Aux vrais Marseillais et Marseillaises ! (parodie of course)
Aux vrais Marseillais et Marseillaises ! (parodie of course)
She's going to be catnapped by grandma for the holiday, grandpa doesn't know it yet

June 19, 2025 at 9:17 PM
She's going to be catnapped by grandma for the holiday, grandpa doesn't know it yet
Have a lovely summertime
Beautiful plants
Beautiful plants

June 19, 2025 at 7:21 PM
Have a lovely summertime
Beautiful plants
Beautiful plants
Les Venus au Musée d'Art et d'Histoire de Saint Denis sont belles, belles, belles !


June 17, 2025 at 3:27 AM
Les Venus au Musée d'Art et d'Histoire de Saint Denis sont belles, belles, belles !
in 2025, some people still see me like a slave, their culture still welcoming slavery... I like to see how they panicked when I just say "No" to them, they just wish they could threaten me physically instead they try intimidating or insulting
#NoKafalaInFrance
#NoKafalaInFrance

June 11, 2025 at 4:52 AM
in 2025, some people still see me like a slave, their culture still welcoming slavery... I like to see how they panicked when I just say "No" to them, they just wish they could threaten me physically instead they try intimidating or insulting
#NoKafalaInFrance
#NoKafalaInFrance
a data curiosity web scraping project with a former friend 🔱
Mythic Atlas: Explore Global Deities
#RM #Plotly #Dash
deiproject-bh71.onrender.com
Mythic Atlas: Explore Global Deities
#RM #Plotly #Dash
deiproject-bh71.onrender.com

June 10, 2025 at 7:23 PM
a data curiosity web scraping project with a former friend 🔱
Mythic Atlas: Explore Global Deities
#RM #Plotly #Dash
deiproject-bh71.onrender.com
Mythic Atlas: Explore Global Deities
#RM #Plotly #Dash
deiproject-bh71.onrender.com
Et la serre… ah, la serre ! Un drame en trois actes
📍Jardin colonial, Jardin d'agronomie tropicale, Paris, Vincennes
📍Jardin colonial, Jardin d'agronomie tropicale, Paris, Vincennes


May 22, 2025 at 10:42 PM
Et la serre… ah, la serre ! Un drame en trois actes
📍Jardin colonial, Jardin d'agronomie tropicale, Paris, Vincennes
📍Jardin colonial, Jardin d'agronomie tropicale, Paris, Vincennes
#back_to_medieval_times
how data analysis can enlight medieval monastic life #Part2 #Gender in the dataset
Python | Matplotlib
Are monastic communities more male or female?
🩷🩷🩷🩷💙
how data analysis can enlight medieval monastic life #Part2 #Gender in the dataset
Python | Matplotlib
Are monastic communities more male or female?
🩷🩷🩷🩷💙

May 16, 2025 at 9:41 PM
#back_to_medieval_times
how data analysis can enlight medieval monastic life #Part2 #Gender in the dataset
Python | Matplotlib
Are monastic communities more male or female?
🩷🩷🩷🩷💙
how data analysis can enlight medieval monastic life #Part2 #Gender in the dataset
Python | Matplotlib
Are monastic communities more male or female?
🩷🩷🩷🩷💙
#back_to_medieval_times
how data analysis can enlight medieval monastic life #Part1 #ReligiousOrder
Using Python | Matplotlib
Source: Monastic Matrix (enriched by personal research)
how data analysis can enlight medieval monastic life #Part1 #ReligiousOrder
Using Python | Matplotlib
Source: Monastic Matrix (enriched by personal research)

May 16, 2025 at 9:36 PM
#back_to_medieval_times
how data analysis can enlight medieval monastic life #Part1 #ReligiousOrder
Using Python | Matplotlib
Source: Monastic Matrix (enriched by personal research)
how data analysis can enlight medieval monastic life #Part1 #ReligiousOrder
Using Python | Matplotlib
Source: Monastic Matrix (enriched by personal research)
Relationships | Negative Correlation #30DayChartChallenge2025
Monastic Matrix, sample: 570 medieval christian communities
✝️ Community with the oldest founding date: S. Maria dei Colli (Founded 115)
✝️ Community with the maximum duration: S. Maria della Massima (Duration: 1410 yrs)
#curiousatheist
Monastic Matrix, sample: 570 medieval christian communities
✝️ Community with the oldest founding date: S. Maria dei Colli (Founded 115)
✝️ Community with the maximum duration: S. Maria della Massima (Duration: 1410 yrs)
#curiousatheist

May 6, 2025 at 6:58 PM
Relationships | Negative Correlation #30DayChartChallenge2025
Monastic Matrix, sample: 570 medieval christian communities
✝️ Community with the oldest founding date: S. Maria dei Colli (Founded 115)
✝️ Community with the maximum duration: S. Maria della Massima (Duration: 1410 yrs)
#curiousatheist
Monastic Matrix, sample: 570 medieval christian communities
✝️ Community with the oldest founding date: S. Maria dei Colli (Founded 115)
✝️ Community with the maximum duration: S. Maria della Massima (Duration: 1410 yrs)
#curiousatheist
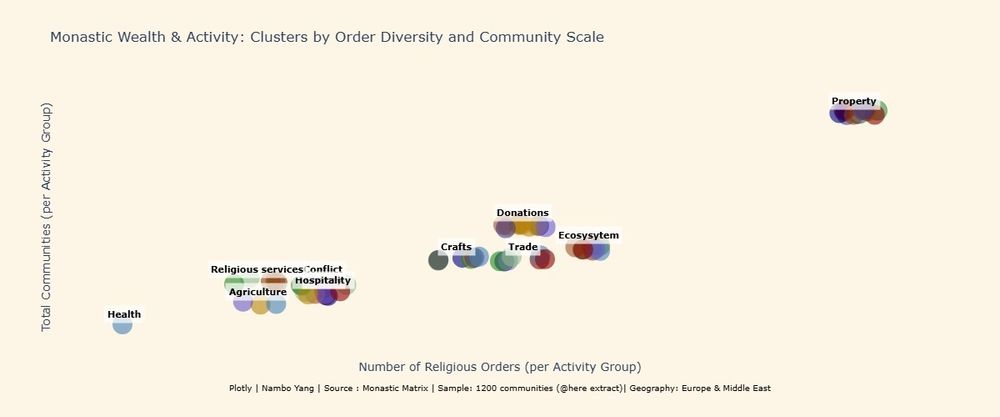
Think nuns were just about prayer? Think again!
This chart reveals the economic engines of the medieval monastic world, clustered by activity, source of wealth and colored by order. ✨💰
#30DayChartChallenge2025
Relationships | Clustera
This chart reveals the economic engines of the medieval monastic world, clustered by activity, source of wealth and colored by order. ✨💰
#30DayChartChallenge2025
Relationships | Clustera
May 6, 2025 at 9:53 AM
Think nuns were just about prayer? Think again!
This chart reveals the economic engines of the medieval monastic world, clustered by activity, source of wealth and colored by order. ✨💰
#30DayChartChallenge2025
Relationships | Clustera
This chart reveals the economic engines of the medieval monastic world, clustered by activity, source of wealth and colored by order. ✨💰
#30DayChartChallenge2025
Relationships | Clustera
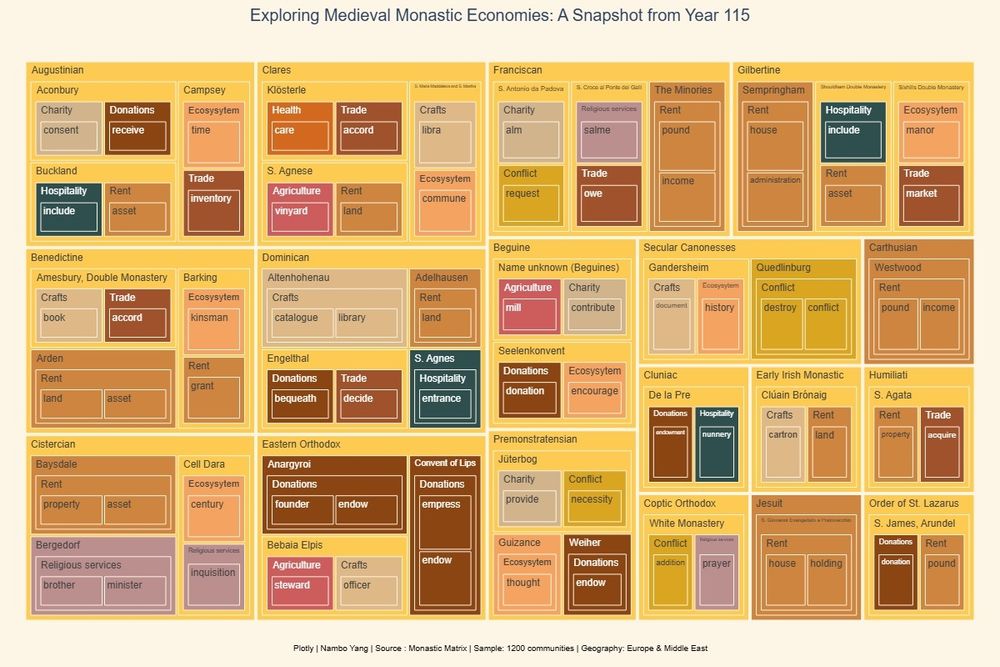
Different types of economic activities and resources in medieval Monasteries and Christian Communities
Tree Map with Plotly and wonderful Monastic Matrix resources
Relationships | Kinship #30DayChartChallenge2025 #conclave #WomeninChurch
Tree Map with Plotly and wonderful Monastic Matrix resources
Relationships | Kinship #30DayChartChallenge2025 #conclave #WomeninChurch
May 6, 2025 at 8:14 AM
Different types of economic activities and resources in medieval Monasteries and Christian Communities
Tree Map with Plotly and wonderful Monastic Matrix resources
Relationships | Kinship #30DayChartChallenge2025 #conclave #WomeninChurch
Tree Map with Plotly and wonderful Monastic Matrix resources
Relationships | Kinship #30DayChartChallenge2025 #conclave #WomeninChurch
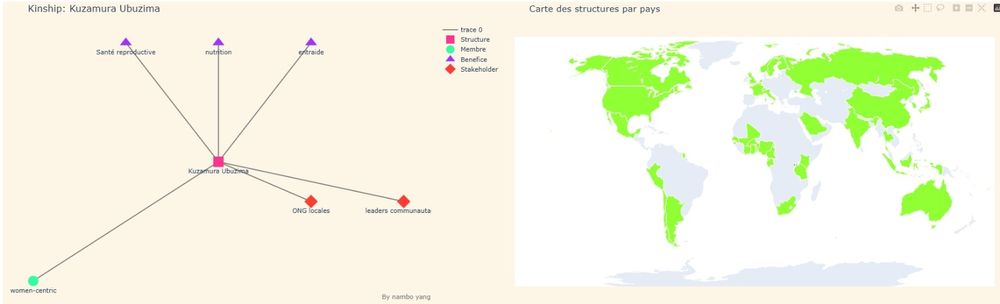
Day 14 #30DayChartChallenge are Kinship charts of Structures benefiting to Women 🌍 (and sometimes gender-mixt membership)
🔗 Python | Geocoding with PyCountry | Kinship with NetworkX and Plotly
🔎 More structures available @here: feminine-kinship.onrender.com
#Polyglot #datacraft
🔗 Python | Geocoding with PyCountry | Kinship with NetworkX and Plotly
🔎 More structures available @here: feminine-kinship.onrender.com
#Polyglot #datacraft
April 21, 2025 at 10:08 PM
Day 14 #30DayChartChallenge are Kinship charts of Structures benefiting to Women 🌍 (and sometimes gender-mixt membership)
🔗 Python | Geocoding with PyCountry | Kinship with NetworkX and Plotly
🔎 More structures available @here: feminine-kinship.onrender.com
#Polyglot #datacraft
🔗 Python | Geocoding with PyCountry | Kinship with NetworkX and Plotly
🔎 More structures available @here: feminine-kinship.onrender.com
#Polyglot #datacraft
Day13 - #30DayChartChallenge
Clustering medieval poems written during XI-XII by:
✨Anna Komnene
✨Hildegard von Bingen
✨Marie de France
⚒️ Relationship - Cluster / NLP / KMeans / Plotly
Details: adeline-hub.github.io/medieval_poe...
Clustering medieval poems written during XI-XII by:
✨Anna Komnene
✨Hildegard von Bingen
✨Marie de France
⚒️ Relationship - Cluster / NLP / KMeans / Plotly
Details: adeline-hub.github.io/medieval_poe...


April 19, 2025 at 11:00 AM
Day13 - #30DayChartChallenge
Clustering medieval poems written during XI-XII by:
✨Anna Komnene
✨Hildegard von Bingen
✨Marie de France
⚒️ Relationship - Cluster / NLP / KMeans / Plotly
Details: adeline-hub.github.io/medieval_poe...
Clustering medieval poems written during XI-XII by:
✨Anna Komnene
✨Hildegard von Bingen
✨Marie de France
⚒️ Relationship - Cluster / NLP / KMeans / Plotly
Details: adeline-hub.github.io/medieval_poe...
Thanks Data Visualization Society, with this challenge I discovered WEB Du Bois and Matplotlib 😜, so schön!!!
last post for 2025: Income and Expenditure (plate 31)
✨🖤
#DuboisChallenge2025
GitHub: adeline-hub.github.io/duboischalle...
last post for 2025: Income and Expenditure (plate 31)
✨🖤
#DuboisChallenge2025
GitHub: adeline-hub.github.io/duboischalle...

April 13, 2025 at 7:54 PM
Thanks Data Visualization Society, with this challenge I discovered WEB Du Bois and Matplotlib 😜, so schön!!!
last post for 2025: Income and Expenditure (plate 31)
✨🖤
#DuboisChallenge2025
GitHub: adeline-hub.github.io/duboischalle...
last post for 2025: Income and Expenditure (plate 31)
✨🖤
#DuboisChallenge2025
GitHub: adeline-hub.github.io/duboischalle...

April 12, 2025 at 6:29 PM
11 - Distributions | Stripes | plotly | Sankey diagram | choropleth heatmap | Domestic Violence victims by gender ad crime type | France
#MarryMe #30DayChartChallenge #DataViz
#MarryMe #30DayChartChallenge #DataViz

April 12, 2025 at 6:28 PM
11 - Distributions | Stripes | plotly | Sankey diagram | choropleth heatmap | Domestic Violence victims by gender ad crime type | France
#MarryMe #30DayChartChallenge #DataViz
#MarryMe #30DayChartChallenge #DataViz
10 - Distributions | Mono (Multi)-modal | plotly | choropleth heatmap | Legal discrimination on violence against women! | World
Woman #BeKind!
df['OBS_VALUE'].mode() = 75
#30DayChartChallenge #DataViz
Woman #BeKind!
df['OBS_VALUE'].mode() = 75
#30DayChartChallenge #DataViz

April 12, 2025 at 6:26 PM
10 - Distributions | Mono (Multi)-modal | plotly | choropleth heatmap | Legal discrimination on violence against women! | World
Woman #BeKind!
df['OBS_VALUE'].mode() = 75
#30DayChartChallenge #DataViz
Woman #BeKind!
df['OBS_VALUE'].mode() = 75
#30DayChartChallenge #DataViz
9 - Distributions | Diverging | matplotlib | Domestic Violence against Women vs Men! | France
#KungFu #30DayChartChallenge #DataViz
#KungFu #30DayChartChallenge #DataViz

April 12, 2025 at 6:22 PM
9 - Distributions | Diverging | matplotlib | Domestic Violence against Women vs Men! | France
#KungFu #30DayChartChallenge #DataViz
#KungFu #30DayChartChallenge #DataViz
8 - Distributions | Histogram | matplotlib | Violence against Women rising! | France
#30DayChartChallenge #DataViz
#30DayChartChallenge #DataViz

April 12, 2025 at 6:20 PM
8 - Distributions | Histogram | matplotlib | Violence against Women rising! | France
#30DayChartChallenge #DataViz
#30DayChartChallenge #DataViz
Day 7 - Distributions | Outliers | matplotlib | Violence against Women | France
#30DayChartChallenge #DataViz
Love will be next week ❤️
#30DayChartChallenge #DataViz
Love will be next week ❤️

April 12, 2025 at 6:17 PM
Day 7 - Distributions | Outliers | matplotlib | Violence against Women | France
#30DayChartChallenge #DataViz
Love will be next week ❤️
#30DayChartChallenge #DataViz
Love will be next week ❤️
🌅 with the penultimate #Dataviz of the #DuBoisChallenge2025

April 8, 2025 at 7:32 AM
🌅 with the penultimate #Dataviz of the #DuBoisChallenge2025