


Mark Z. Jacobson
@mzjacobson.bsky.social
Climate, pollution, clean/renewable energy
Stanford U Prof, Civil & Env Eng; Director, Atmos/Energy Program
Cofounder-Solutions Project; Appeared on Letterman
Testified Held v Montana
https://web.stanford.edu/group/efmh/jacobson/
Stanford.io/Jacobson
Stanford U Prof, Civil & Env Eng; Director, Atmos/Energy Program
Cofounder-Solutions Project; Appeared on Letterman
Testified Held v Montana
https://web.stanford.edu/group/efmh/jacobson/
Stanford.io/Jacobson
Another picture-perfect weekend in California
WindWaterSolar met >100% of demand for parts of 216th & 217th days of 2025.
Fossil gas down 37.3%, solar up 42.6%, batteries up 198%, demand down 1.4% vs '23
Average of 3.8 h/day > 100% WWS among all days in '25 v 0.7 h/day in '23
WindWaterSolar met >100% of demand for parts of 216th & 217th days of 2025.
Fossil gas down 37.3%, solar up 42.6%, batteries up 198%, demand down 1.4% vs '23
Average of 3.8 h/day > 100% WWS among all days in '25 v 0.7 h/day in '23

November 10, 2025 at 8:40 PM
Another picture-perfect weekend in California
WindWaterSolar met >100% of demand for parts of 216th & 217th days of 2025.
Fossil gas down 37.3%, solar up 42.6%, batteries up 198%, demand down 1.4% vs '23
Average of 3.8 h/day > 100% WWS among all days in '25 v 0.7 h/day in '23
WindWaterSolar met >100% of demand for parts of 216th & 217th days of 2025.
Fossil gas down 37.3%, solar up 42.6%, batteries up 198%, demand down 1.4% vs '23
Average of 3.8 h/day > 100% WWS among all days in '25 v 0.7 h/day in '23
Wind kicks in to push California to >100% WindWaterSolar for 215th day (out of 310) in 2025
Gas down 17.5% v '24 & 37.4% v '23
Solar up 15% v '24 & 43% v '23
Batteries up 56% v '24 & 198% v '23
61.4% of demand in '25 met by WWS (54% in-state +7.5% imports=58% of 12.9% imports)
Gas down 17.5% v '24 & 37.4% v '23
Solar up 15% v '24 & 43% v '23
Batteries up 56% v '24 & 198% v '23
61.4% of demand in '25 met by WWS (54% in-state +7.5% imports=58% of 12.9% imports)

November 7, 2025 at 5:52 PM
Wind kicks in to push California to >100% WindWaterSolar for 215th day (out of 310) in 2025
Gas down 17.5% v '24 & 37.4% v '23
Solar up 15% v '24 & 43% v '23
Batteries up 56% v '24 & 198% v '23
61.4% of demand in '25 met by WWS (54% in-state +7.5% imports=58% of 12.9% imports)
Gas down 17.5% v '24 & 37.4% v '23
Solar up 15% v '24 & 43% v '23
Batteries up 56% v '24 & 198% v '23
61.4% of demand in '25 met by WWS (54% in-state +7.5% imports=58% of 12.9% imports)
Every day is a new record.
Two more 100% WindWaterSolar days for part of the day in CA, making it 213 100% days so far in 2025.
CA will be 100% WWS 24/7/365 by 2037.
PV and batteries are replacing gas rapidly.
Gas down 18% versus 2024 and 37.4% versus 2023.
Two more 100% WindWaterSolar days for part of the day in CA, making it 213 100% days so far in 2025.
CA will be 100% WWS 24/7/365 by 2037.
PV and batteries are replacing gas rapidly.
Gas down 18% versus 2024 and 37.4% versus 2023.
November 4, 2025 at 4:38 PM
Every day is a new record.
Two more 100% WindWaterSolar days for part of the day in CA, making it 213 100% days so far in 2025.
CA will be 100% WWS 24/7/365 by 2037.
PV and batteries are replacing gas rapidly.
Gas down 18% versus 2024 and 37.4% versus 2023.
Two more 100% WindWaterSolar days for part of the day in CA, making it 213 100% days so far in 2025.
CA will be 100% WWS 24/7/365 by 2037.
PV and batteries are replacing gas rapidly.
Gas down 18% versus 2024 and 37.4% versus 2023.
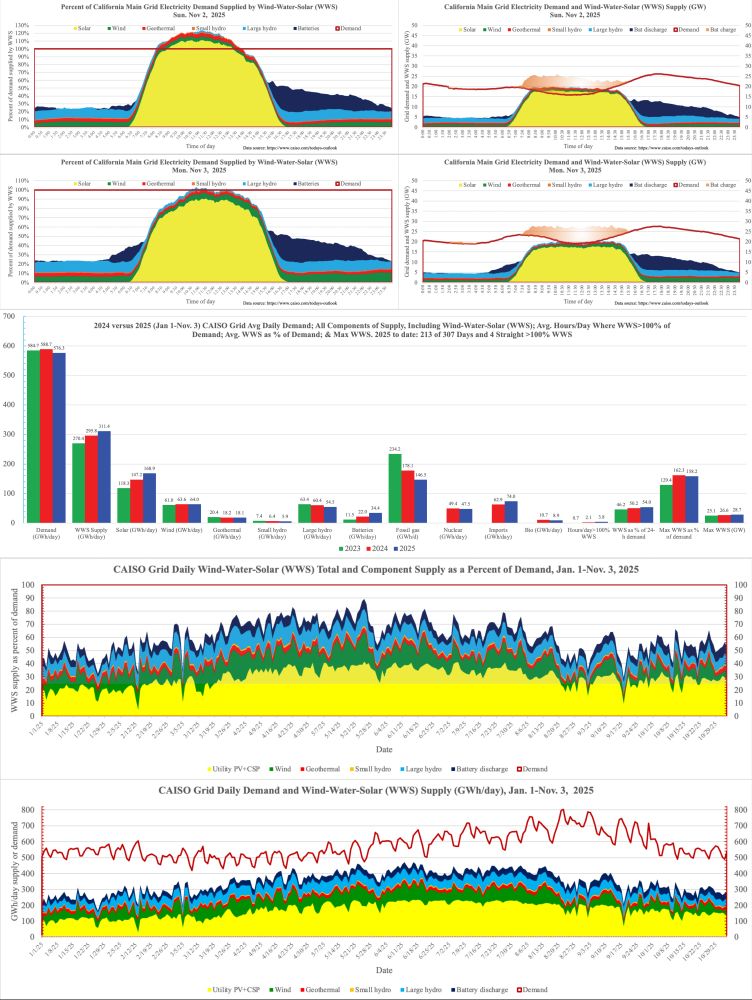
After 10 months of '25, we have ~7 months (211 days) with WindWaterSolar powering >100% of CA's main grid for part of the day
And look: Little wind Sat day but still 100% WWS
Gas down 18% v '24; 37% v '23
Demand down 2% v '24; 1.4% v '23
Solar up 15% v '24; 43% v '23
Batt up 56% v '24; 199% v '23
And look: Little wind Sat day but still 100% WWS
Gas down 18% v '24; 37% v '23
Demand down 2% v '24; 1.4% v '23
Solar up 15% v '24; 43% v '23
Batt up 56% v '24; 199% v '23

November 2, 2025 at 4:16 PM
After 10 months of '25, we have ~7 months (211 days) with WindWaterSolar powering >100% of CA's main grid for part of the day
And look: Little wind Sat day but still 100% WWS
Gas down 18% v '24; 37% v '23
Demand down 2% v '24; 1.4% v '23
Solar up 15% v '24; 43% v '23
Batt up 56% v '24; 199% v '23
And look: Little wind Sat day but still 100% WWS
Gas down 18% v '24; 37% v '23
Demand down 2% v '24; 1.4% v '23
Solar up 15% v '24; 43% v '23
Batt up 56% v '24; 199% v '23
Another 6 days straight and 208 of 300 in 2025 with WindWaterSolar powering CA's main grid for part of the day
CA 54.24% in-state WWS for all of 2025, 3.87% higher than last year's 50.37%. At this rate, CA will be 100% WWS 24/7/365 by 2036.
Gas down 18.5% v '24 & 37.4% v '23
CA 54.24% in-state WWS for all of 2025, 3.87% higher than last year's 50.37%. At this rate, CA will be 100% WWS 24/7/365 by 2036.
Gas down 18.5% v '24 & 37.4% v '23

October 28, 2025 at 11:06 PM
Another 6 days straight and 208 of 300 in 2025 with WindWaterSolar powering CA's main grid for part of the day
CA 54.24% in-state WWS for all of 2025, 3.87% higher than last year's 50.37%. At this rate, CA will be 100% WWS 24/7/365 by 2036.
Gas down 18.5% v '24 & 37.4% v '23
CA 54.24% in-state WWS for all of 2025, 3.87% higher than last year's 50.37%. At this rate, CA will be 100% WWS 24/7/365 by 2036.
Gas down 18.5% v '24 & 37.4% v '23
Just a reminder that the sun shines, the wind blows, the water flows, and the Earth creates heat every day
206 days in 2025 so far with WindWaterSolar exceeding 100% of demand on CA's main grid for part of the day, averaging 3.9 among all 298 days in 2025
And fossil gas is down 37.4% in 2 y
206 days in 2025 so far with WindWaterSolar exceeding 100% of demand on CA's main grid for part of the day, averaging 3.9 among all 298 days in 2025
And fossil gas is down 37.4% in 2 y

October 26, 2025 at 3:48 PM
Just a reminder that the sun shines, the wind blows, the water flows, and the Earth creates heat every day
206 days in 2025 so far with WindWaterSolar exceeding 100% of demand on CA's main grid for part of the day, averaging 3.9 among all 298 days in 2025
And fossil gas is down 37.4% in 2 y
206 days in 2025 so far with WindWaterSolar exceeding 100% of demand on CA's main grid for part of the day, averaging 3.9 among all 298 days in 2025
And fossil gas is down 37.4% in 2 y
204 days in 2025 w/100% WindWaterSolar on CA main grid for part of day
61.7% of all demand in '25 met by WWS: 54.3% in-state WWS & 7.4% imported WWS (58% of 12.68% imports)
Gas down 18.2% v '24 & 37.3% v '23
Solar up 14.4% v '24 & 43.1% v '23
Batteries up 56% v '24 & 201% v '23
61.7% of all demand in '25 met by WWS: 54.3% in-state WWS & 7.4% imported WWS (58% of 12.68% imports)
Gas down 18.2% v '24 & 37.3% v '23
Solar up 14.4% v '24 & 43.1% v '23
Batteries up 56% v '24 & 201% v '23

October 24, 2025 at 4:49 PM
204 days in 2025 w/100% WindWaterSolar on CA main grid for part of day
61.7% of all demand in '25 met by WWS: 54.3% in-state WWS & 7.4% imported WWS (58% of 12.68% imports)
Gas down 18.2% v '24 & 37.3% v '23
Solar up 14.4% v '24 & 43.1% v '23
Batteries up 56% v '24 & 201% v '23
61.7% of all demand in '25 met by WWS: 54.3% in-state WWS & 7.4% imported WWS (58% of 12.68% imports)
Gas down 18.2% v '24 & 37.3% v '23
Solar up 14.4% v '24 & 43.1% v '23
Batteries up 56% v '24 & 201% v '23
Clean electricity creating clean air keeps coming
202 of 293 days (69%) in 2025 w/WWS meeting >100% of demand for part of day, including 6 days straight
Gas down 18.4% v '24 & 37.4% v '23
In-state WWS supplying 54.4% of all demand in 2025, plus 58% of 12.63% of imports, so really 61.7% of demand
202 of 293 days (69%) in 2025 w/WWS meeting >100% of demand for part of day, including 6 days straight
Gas down 18.4% v '24 & 37.4% v '23
In-state WWS supplying 54.4% of all demand in 2025, plus 58% of 12.63% of imports, so really 61.7% of demand

October 21, 2025 at 5:15 PM
Clean electricity creating clean air keeps coming
202 of 293 days (69%) in 2025 w/WWS meeting >100% of demand for part of day, including 6 days straight
Gas down 18.4% v '24 & 37.4% v '23
In-state WWS supplying 54.4% of all demand in 2025, plus 58% of 12.63% of imports, so really 61.7% of demand
202 of 293 days (69%) in 2025 w/WWS meeting >100% of demand for part of day, including 6 days straight
Gas down 18.4% v '24 & 37.4% v '23
In-state WWS supplying 54.4% of all demand in 2025, plus 58% of 12.63% of imports, so really 61.7% of demand
It has happened!
200 days of 100% WindWaterSolar on CA's main grid in 2025
Including a record battery output of 47.69 GWh on 10/17
Gas down 18.5% v '24 & 37.2% v '23
PV up 14.6% v '24 & 43.5% v '23
Batteries up 56.8% v '24 & 202.7% v '23
Demand down 2.1% v '24 & 1.3% v '23
200 days of 100% WindWaterSolar on CA's main grid in 2025
Including a record battery output of 47.69 GWh on 10/17
Gas down 18.5% v '24 & 37.2% v '23
PV up 14.6% v '24 & 43.5% v '23
Batteries up 56.8% v '24 & 202.7% v '23
Demand down 2.1% v '24 & 1.3% v '23

October 19, 2025 at 4:35 PM
It has happened!
200 days of 100% WindWaterSolar on CA's main grid in 2025
Including a record battery output of 47.69 GWh on 10/17
Gas down 18.5% v '24 & 37.2% v '23
PV up 14.6% v '24 & 43.5% v '23
Batteries up 56.8% v '24 & 202.7% v '23
Demand down 2.1% v '24 & 1.3% v '23
200 days of 100% WindWaterSolar on CA's main grid in 2025
Including a record battery output of 47.69 GWh on 10/17
Gas down 18.5% v '24 & 37.2% v '23
PV up 14.6% v '24 & 43.5% v '23
Batteries up 56.8% v '24 & 202.7% v '23
Demand down 2.1% v '24 & 1.3% v '23
Marching toward 200 100% WindWaterSolar days in CA
Oct 16: 198th day in 2025 w/WWS >100% of demand
WWS met 54.5% of demand in '25
Gas down 37% v '23 & 19% v '24
PV up 44% v '23 & 15% v '24
Batteries up 203% v '23 & 57% v '24
Demand down 1.2% v '23 & 2.1% v '24 despite more AI
Oct 16: 198th day in 2025 w/WWS >100% of demand
WWS met 54.5% of demand in '25
Gas down 37% v '23 & 19% v '24
PV up 44% v '23 & 15% v '24
Batteries up 203% v '23 & 57% v '24
Demand down 1.2% v '23 & 2.1% v '24 despite more AI

October 17, 2025 at 8:30 PM
Marching toward 200 100% WindWaterSolar days in CA
Oct 16: 198th day in 2025 w/WWS >100% of demand
WWS met 54.5% of demand in '25
Gas down 37% v '23 & 19% v '24
PV up 44% v '23 & 15% v '24
Batteries up 203% v '23 & 57% v '24
Demand down 1.2% v '23 & 2.1% v '24 despite more AI
Oct 16: 198th day in 2025 w/WWS >100% of demand
WWS met 54.5% of demand in '25
Gas down 37% v '23 & 19% v '24
PV up 44% v '23 & 15% v '24
Batteries up 203% v '23 & 57% v '24
Demand down 1.2% v '23 & 2.1% v '24 despite more AI
Picture perfect California weekend
195th & 196th days in 2025 with >100% WindWaterSolar for part of day
WWS peaked at 135% of demand both days
Gas down 19% v '24 & 37% v '23
Batteries up 57% v '24 & 205% v '23
Solar up 15% v '24 & 44% v '23
WWS 54.6% of demand v 46.7% in '23
195th & 196th days in 2025 with >100% WindWaterSolar for part of day
WWS peaked at 135% of demand both days
Gas down 19% v '24 & 37% v '23
Batteries up 57% v '24 & 205% v '23
Solar up 15% v '24 & 44% v '23
WWS 54.6% of demand v 46.7% in '23

October 13, 2025 at 3:54 PM
Picture perfect California weekend
195th & 196th days in 2025 with >100% WindWaterSolar for part of day
WWS peaked at 135% of demand both days
Gas down 19% v '24 & 37% v '23
Batteries up 57% v '24 & 205% v '23
Solar up 15% v '24 & 44% v '23
WWS 54.6% of demand v 46.7% in '23
195th & 196th days in 2025 with >100% WindWaterSolar for part of day
WWS peaked at 135% of demand both days
Gas down 19% v '24 & 37% v '23
Batteries up 57% v '24 & 205% v '23
Solar up 15% v '24 & 44% v '23
WWS 54.6% of demand v 46.7% in '23
Impressive. 5 more days straight with 100% WindWaterSolar on California ISO grid, making it 193 of 280 days in 2025
Gas down 18% v '24 & 37% v '23, replaced largely by solar & batteries
54.7% of all demand met by WWS
Demand down 1.7% v '24 & 1.1% v '23 due largely to growth of roof PV
Gas down 18% v '24 & 37% v '23, replaced largely by solar & batteries
54.7% of all demand met by WWS
Demand down 1.7% v '24 & 1.1% v '23 due largely to growth of roof PV

October 8, 2025 at 5:14 PM
Impressive. 5 more days straight with 100% WindWaterSolar on California ISO grid, making it 193 of 280 days in 2025
Gas down 18% v '24 & 37% v '23, replaced largely by solar & batteries
54.7% of all demand met by WWS
Demand down 1.7% v '24 & 1.1% v '23 due largely to growth of roof PV
Gas down 18% v '24 & 37% v '23, replaced largely by solar & batteries
54.7% of all demand met by WWS
Demand down 1.7% v '24 & 1.1% v '23 due largely to growth of roof PV
New record battery output of 47.2 GWh on the California ISO grid on Sun 10/5/25. 9.2% of all demand was met by batteries.
Now 191 days of 2025 with > 100% WWS for part of day.
Gas is down 18% v '24, 37% v '23
Solar up 15% v '24, 45% v '23
Demand down 1.7% v' 24, 1% v '23 despite more AI
Now 191 days of 2025 with > 100% WWS for part of day.
Gas is down 18% v '24, 37% v '23
Solar up 15% v '24, 45% v '23
Demand down 1.7% v' 24, 1% v '23 despite more AI

October 6, 2025 at 8:26 PM
New record battery output of 47.2 GWh on the California ISO grid on Sun 10/5/25. 9.2% of all demand was met by batteries.
Now 191 days of 2025 with > 100% WWS for part of day.
Gas is down 18% v '24, 37% v '23
Solar up 15% v '24, 45% v '23
Demand down 1.7% v' 24, 1% v '23 despite more AI
Now 191 days of 2025 with > 100% WWS for part of day.
Gas is down 18% v '24, 37% v '23
Solar up 15% v '24, 45% v '23
Demand down 1.7% v' 24, 1% v '23 despite more AI
Wind-Water-Solar pushing out gas in California
Fossil gas down 17.4% year to date in 2025 v '24 and down 37.4% v '23
Wind up 2.1% v '24 and 5.1% v '23
Solar up 15.1% v '24 and 44.8% v '23
Batteries up 58.4% v '24 and 206.4% v '23
Demand down 1.4% v '24 and 1% v '23
Fossil gas down 17.4% year to date in 2025 v '24 and down 37.4% v '23
Wind up 2.1% v '24 and 5.1% v '23
Solar up 15.1% v '24 and 44.8% v '23
Batteries up 58.4% v '24 and 206.4% v '23
Demand down 1.4% v '24 and 1% v '23

October 4, 2025 at 5:27 PM
Wind-Water-Solar pushing out gas in California
Fossil gas down 17.4% year to date in 2025 v '24 and down 37.4% v '23
Wind up 2.1% v '24 and 5.1% v '23
Solar up 15.1% v '24 and 44.8% v '23
Batteries up 58.4% v '24 and 206.4% v '23
Demand down 1.4% v '24 and 1% v '23
Fossil gas down 17.4% year to date in 2025 v '24 and down 37.4% v '23
Wind up 2.1% v '24 and 5.1% v '23
Solar up 15.1% v '24 and 44.8% v '23
Batteries up 58.4% v '24 and 206.4% v '23
Demand down 1.4% v '24 and 1% v '23
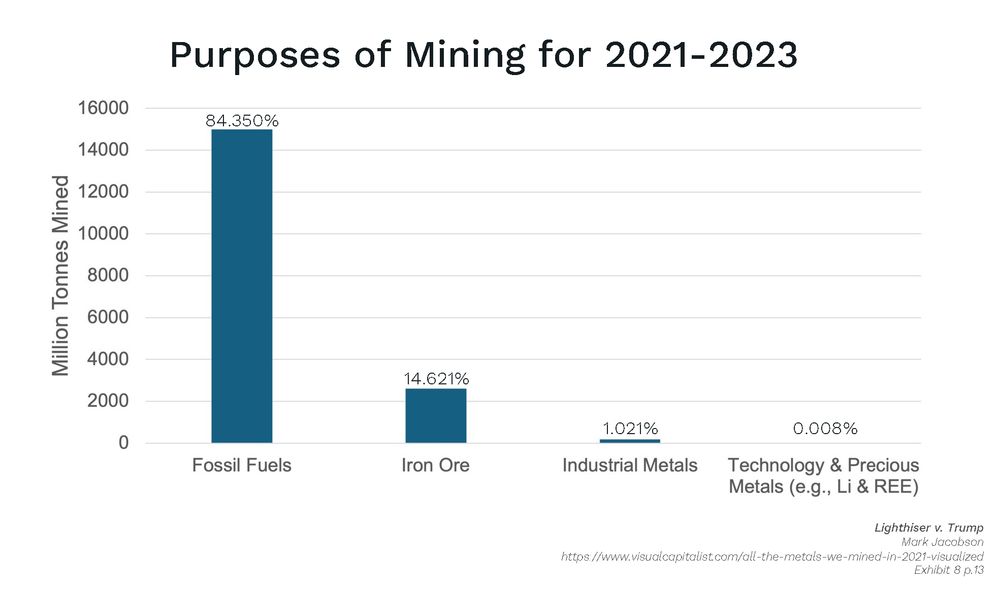
To accompany the video, here's the tonnage of fossil fuels versus precious metals mined today.

October 1, 2025 at 10:15 PM
To accompany the video, here's the tonnage of fossil fuels versus precious metals mined today.
187th day of the year that WindWaterSolar powered the @California_ISO grid for part of the day.
Gas down 37% v '23 & 17.3% v '24
Solar up 45% v '23 & 15.2% v '24
Batteries up 206% v '23 & 59% v '24
Demand down 1.1% v '23 & 1.4% v '24 despite more AI
Gas down 37% v '23 & 17.3% v '24
Solar up 45% v '23 & 15.2% v '24
Batteries up 206% v '23 & 59% v '24
Demand down 1.1% v '23 & 1.4% v '24 despite more AI
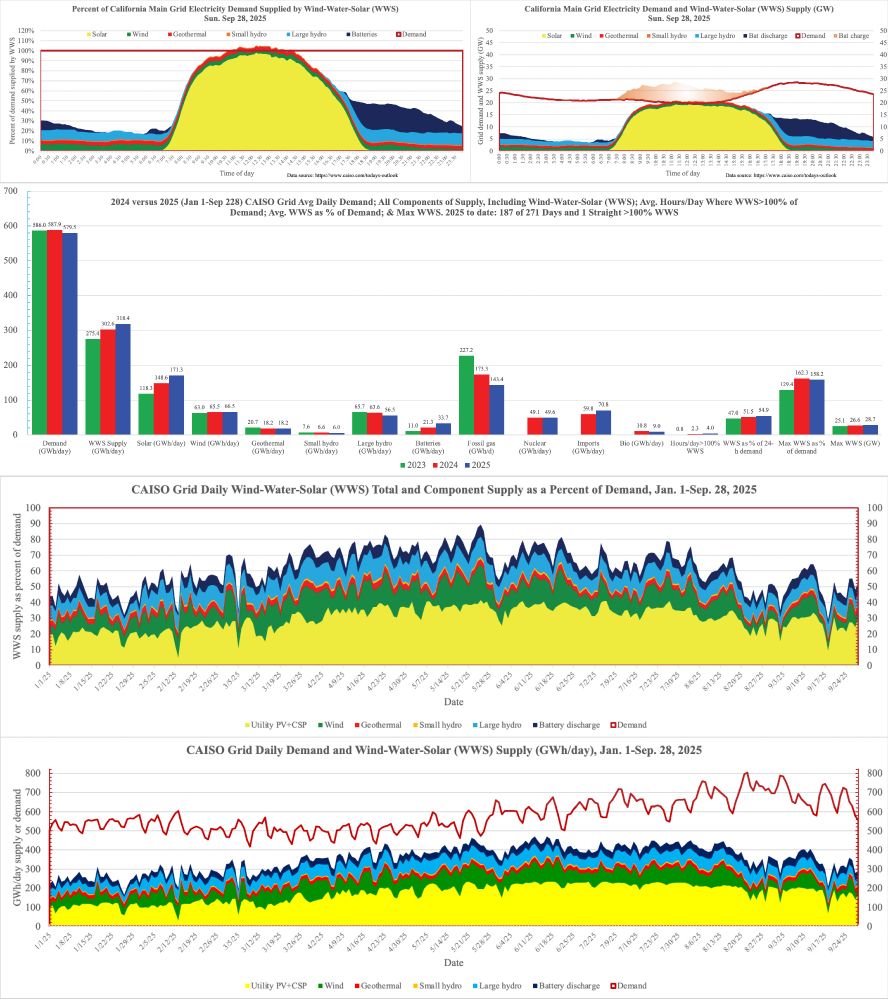
September 29, 2025 at 4:29 PM
187th day of the year that WindWaterSolar powered the @California_ISO grid for part of the day.
Gas down 37% v '23 & 17.3% v '24
Solar up 45% v '23 & 15.2% v '24
Batteries up 206% v '23 & 59% v '24
Demand down 1.1% v '23 & 1.4% v '24 despite more AI
Gas down 37% v '23 & 17.3% v '24
Solar up 45% v '23 & 15.2% v '24
Batteries up 206% v '23 & 59% v '24
Demand down 1.1% v '23 & 1.4% v '24 despite more AI
Updated ranking of world scientists.
Grateful to be ranked #10 all time in Meteorology & Atmospheric Sciences (#2 first publishing after 1985); #19 all time in Energy (#9 first publishing after 1980); and #1,609 out of 10 million since 1788.
Incredible company
web.stanford.edu/group/efmh/j...
Grateful to be ranked #10 all time in Meteorology & Atmospheric Sciences (#2 first publishing after 1985); #19 all time in Energy (#9 first publishing after 1980); and #1,609 out of 10 million since 1788.
Incredible company
web.stanford.edu/group/efmh/j...

September 23, 2025 at 8:18 PM
Updated ranking of world scientists.
Grateful to be ranked #10 all time in Meteorology & Atmospheric Sciences (#2 first publishing after 1985); #19 all time in Energy (#9 first publishing after 1980); and #1,609 out of 10 million since 1788.
Incredible company
web.stanford.edu/group/efmh/j...
Grateful to be ranked #10 all time in Meteorology & Atmospheric Sciences (#2 first publishing after 1985); #19 all time in Energy (#9 first publishing after 1980); and #1,609 out of 10 million since 1788.
Incredible company
web.stanford.edu/group/efmh/j...
And a 4th reminder that a transition to 100% WindWaterSolar reduces the annual total tonnes of mining in the world by >84% despite the need for precious metals, which are a trivial component of total mining tonnage.
September 20, 2025 at 9:05 PM
And a 4th reminder that a transition to 100% WindWaterSolar reduces the annual total tonnes of mining in the world by >84% despite the need for precious metals, which are a trivial component of total mining tonnage.
And a 3rd reminder that a transition to 100% WindWaterSolar across the US reduces land use due to energy from 2.4% of US land (1.16% occupied by the fossil-fuel industry and 1.24% occupied by the corn-ethanol industry) to ~0.85% of U.S. land, with most of this being open space between wind turbines

September 20, 2025 at 9:00 PM
And a 3rd reminder that a transition to 100% WindWaterSolar across the US reduces land use due to energy from 2.4% of US land (1.16% occupied by the fossil-fuel industry and 1.24% occupied by the corn-ethanol industry) to ~0.85% of U.S. land, with most of this being open space between wind turbines
And another reminder that a transition of the U.S. to 100% WindWaterSolar across all energy sectors reduces private annual energy costs to Americans by 63% (giving an energy-cost payback time of <6 y) and total social energy costs by 86% (payback time <1 y).

September 20, 2025 at 8:54 PM
And another reminder that a transition of the U.S. to 100% WindWaterSolar across all energy sectors reduces private annual energy costs to Americans by 63% (giving an energy-cost payback time of <6 y) and total social energy costs by 86% (payback time <1 y).
More than half of the days on California's main grid in '25 will definitely see WindWaterSolar supply >100% of demand. So far, 184/257 100% days.
Gas down 20% v '24, 39% v '23
WWS up 6% v '24, 17% v '23
Batteries up 60% v '24, 211% v '23
Demand down 2.1% v '24, 1.8% v '23
Gas down 20% v '24, 39% v '23
WWS up 6% v '24, 17% v '23
Batteries up 60% v '24, 211% v '23
Demand down 2.1% v '24, 1.8% v '23

September 15, 2025 at 7:32 PM
More than half of the days on California's main grid in '25 will definitely see WindWaterSolar supply >100% of demand. So far, 184/257 100% days.
Gas down 20% v '24, 39% v '23
WWS up 6% v '24, 17% v '23
Batteries up 60% v '24, 211% v '23
Demand down 2.1% v '24, 1.8% v '23
Gas down 20% v '24, 39% v '23
WWS up 6% v '24, 17% v '23
Batteries up 60% v '24, 211% v '23
Demand down 2.1% v '24, 1.8% v '23
Fossil gas use on the California ISO grid in 2025 is now 20% lower than in '24 & 39% lower than in '23.
PV up 17% v '24 & 47% v '23
Batteries up 60% v '24 & 211% v '23
182 out of 255 days (71.3%) with >100% WindWaterSolar supply meeting California ISO demand.
CA will be 100% WWS by 2035
PV up 17% v '24 & 47% v '23
Batteries up 60% v '24 & 211% v '23
182 out of 255 days (71.3%) with >100% WindWaterSolar supply meeting California ISO demand.
CA will be 100% WWS by 2035

September 13, 2025 at 8:50 PM
Fossil gas use on the California ISO grid in 2025 is now 20% lower than in '24 & 39% lower than in '23.
PV up 17% v '24 & 47% v '23
Batteries up 60% v '24 & 211% v '23
182 out of 255 days (71.3%) with >100% WindWaterSolar supply meeting California ISO demand.
CA will be 100% WWS by 2035
PV up 17% v '24 & 47% v '23
Batteries up 60% v '24 & 211% v '23
182 out of 255 days (71.3%) with >100% WindWaterSolar supply meeting California ISO demand.
CA will be 100% WWS by 2035
Make it 180 days (out of 253 in 2025) with WindWaterSolar supply>100% of demand CA's main grid
Demand down 2% v '24 & 1.7% v '23 despite more AI, EVs, heat pumps.
Gas down 20% v '24 & 38.4% v '23
PV up 17% v '24 & 47% v '23
Wind up 3.4% v '24 & 7.1% v '23
Batteries up 60% v '24 & 211% v '23
Demand down 2% v '24 & 1.7% v '23 despite more AI, EVs, heat pumps.
Gas down 20% v '24 & 38.4% v '23
PV up 17% v '24 & 47% v '23
Wind up 3.4% v '24 & 7.1% v '23
Batteries up 60% v '24 & 211% v '23
September 11, 2025 at 6:21 PM
Make it 180 days (out of 253 in 2025) with WindWaterSolar supply>100% of demand CA's main grid
Demand down 2% v '24 & 1.7% v '23 despite more AI, EVs, heat pumps.
Gas down 20% v '24 & 38.4% v '23
PV up 17% v '24 & 47% v '23
Wind up 3.4% v '24 & 7.1% v '23
Batteries up 60% v '24 & 211% v '23
Demand down 2% v '24 & 1.7% v '23 despite more AI, EVs, heat pumps.
Gas down 20% v '24 & 38.4% v '23
PV up 17% v '24 & 47% v '23
Wind up 3.4% v '24 & 7.1% v '23
Batteries up 60% v '24 & 211% v '23
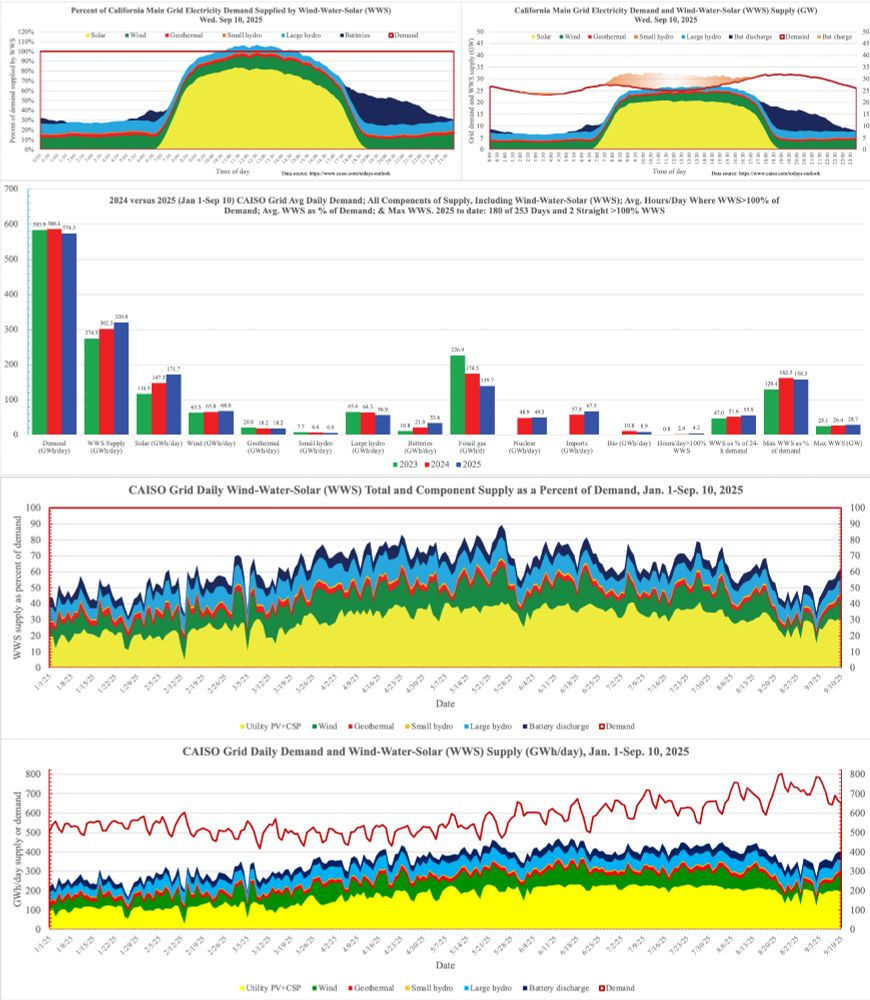
179th day of the year that the California ISO grid WindWaterSolar supply exceeds 100% of demand for part of the day.
CA is meeting 55.9% of all demand this year with WWS, vs 51.7% in 2024 and 47.1% in 2023. At this pace, CA will be 100% WWS 24/7/365 by 2035.
Gas is down 20% vs '24 & 38% vs '23
CA is meeting 55.9% of all demand this year with WWS, vs 51.7% in 2024 and 47.1% in 2023. At this pace, CA will be 100% WWS 24/7/365 by 2035.
Gas is down 20% vs '24 & 38% vs '23

September 10, 2025 at 11:16 PM
179th day of the year that the California ISO grid WindWaterSolar supply exceeds 100% of demand for part of the day.
CA is meeting 55.9% of all demand this year with WWS, vs 51.7% in 2024 and 47.1% in 2023. At this pace, CA will be 100% WWS 24/7/365 by 2035.
Gas is down 20% vs '24 & 38% vs '23
CA is meeting 55.9% of all demand this year with WWS, vs 51.7% in 2024 and 47.1% in 2023. At this pace, CA will be 100% WWS 24/7/365 by 2035.
Gas is down 20% vs '24 & 38% vs '23
California is through the hottest part of summer, and fossil gas use is 19% less than '24 and 39% less than '23
56% of electricity from WWS this year.
177/249 days (71%) with >100% WWS, for an avg of 4.2 h/day among all days
Demand 1.6% less than '24 & '23 despite more AI, EVs, crypto, heat pumps
56% of electricity from WWS this year.
177/249 days (71%) with >100% WWS, for an avg of 4.2 h/day among all days
Demand 1.6% less than '24 & '23 despite more AI, EVs, crypto, heat pumps

September 7, 2025 at 6:19 PM
California is through the hottest part of summer, and fossil gas use is 19% less than '24 and 39% less than '23
56% of electricity from WWS this year.
177/249 days (71%) with >100% WWS, for an avg of 4.2 h/day among all days
Demand 1.6% less than '24 & '23 despite more AI, EVs, crypto, heat pumps
56% of electricity from WWS this year.
177/249 days (71%) with >100% WWS, for an avg of 4.2 h/day among all days
Demand 1.6% less than '24 & '23 despite more AI, EVs, crypto, heat pumps