


Mark Z. Jacobson
@mzjacobson.bsky.social
Climate, pollution, clean/renewable energy
Stanford U Prof, Civil & Env Eng; Director, Atmos/Energy Program
Cofounder-Solutions Project; Appeared on Letterman
Testified Held v Montana
https://web.stanford.edu/group/efmh/jacobson/
Stanford.io/Jacobson
Stanford U Prof, Civil & Env Eng; Director, Atmos/Energy Program
Cofounder-Solutions Project; Appeared on Letterman
Testified Held v Montana
https://web.stanford.edu/group/efmh/jacobson/
Stanford.io/Jacobson
WWS also creates 25 mil more jobs than lost, uses less land & results in much less mining
Lower costs, better health, better climate, more jobs, less land, less mining, more energy security. No downside
More info
web.stanford.edu/group/efmh/j...
web.stanford.edu/group/efmh/j...
Lower costs, better health, better climate, more jobs, less land, less mining, more energy security. No downside
More info
web.stanford.edu/group/efmh/j...
web.stanford.edu/group/efmh/j...
November 10, 2025 at 9:59 PM
WWS also creates 25 mil more jobs than lost, uses less land & results in much less mining
Lower costs, better health, better climate, more jobs, less land, less mining, more energy security. No downside
More info
web.stanford.edu/group/efmh/j...
web.stanford.edu/group/efmh/j...
Lower costs, better health, better climate, more jobs, less land, less mining, more energy security. No downside
More info
web.stanford.edu/group/efmh/j...
web.stanford.edu/group/efmh/j...
Why a Transition to 100% Wind-Water-Solar Improves Your Life
It reduces world energy costs by $10t/y in 2050. Since upfront cost is $60 t -> 6 y payback time
Also saves $30 t/y in health costs & $30 t/y in climate costs, so total savings $70t/y -> 1 y payback
www.youtube.com/shorts/-7SMS...
It reduces world energy costs by $10t/y in 2050. Since upfront cost is $60 t -> 6 y payback time
Also saves $30 t/y in health costs & $30 t/y in climate costs, so total savings $70t/y -> 1 y payback
www.youtube.com/shorts/-7SMS...
x.com
November 10, 2025 at 9:58 PM
Why a Transition to 100% Wind-Water-Solar Improves Your Life
It reduces world energy costs by $10t/y in 2050. Since upfront cost is $60 t -> 6 y payback time
Also saves $30 t/y in health costs & $30 t/y in climate costs, so total savings $70t/y -> 1 y payback
www.youtube.com/shorts/-7SMS...
It reduces world energy costs by $10t/y in 2050. Since upfront cost is $60 t -> 6 y payback time
Also saves $30 t/y in health costs & $30 t/y in climate costs, so total savings $70t/y -> 1 y payback
www.youtube.com/shorts/-7SMS...
Another picture-perfect weekend in California
WindWaterSolar met >100% of demand for parts of 216th & 217th days of 2025.
Fossil gas down 37.3%, solar up 42.6%, batteries up 198%, demand down 1.4% vs '23
Average of 3.8 h/day > 100% WWS among all days in '25 v 0.7 h/day in '23
WindWaterSolar met >100% of demand for parts of 216th & 217th days of 2025.
Fossil gas down 37.3%, solar up 42.6%, batteries up 198%, demand down 1.4% vs '23
Average of 3.8 h/day > 100% WWS among all days in '25 v 0.7 h/day in '23

November 10, 2025 at 8:40 PM
Another picture-perfect weekend in California
WindWaterSolar met >100% of demand for parts of 216th & 217th days of 2025.
Fossil gas down 37.3%, solar up 42.6%, batteries up 198%, demand down 1.4% vs '23
Average of 3.8 h/day > 100% WWS among all days in '25 v 0.7 h/day in '23
WindWaterSolar met >100% of demand for parts of 216th & 217th days of 2025.
Fossil gas down 37.3%, solar up 42.6%, batteries up 198%, demand down 1.4% vs '23
Average of 3.8 h/day > 100% WWS among all days in '25 v 0.7 h/day in '23
Reposted by Mark Z. Jacobson
All-Electric Homes Save Money & Improve Health
There is no reason to have fossil gas in your home. Electricity can do everything gas can do but cheaper, cleaner & more efficiently. All gas does is burden us with high costs & bad health for the rest of our lives
www.youtube.com/shorts/uSacJ...
There is no reason to have fossil gas in your home. Electricity can do everything gas can do but cheaper, cleaner & more efficiently. All gas does is burden us with high costs & bad health for the rest of our lives
www.youtube.com/shorts/uSacJ...

All-Electric Homes Save Money and Improve Health
YouTube video by Mark Z. Jacobson
www.youtube.com
November 8, 2025 at 3:59 PM
All-Electric Homes Save Money & Improve Health
There is no reason to have fossil gas in your home. Electricity can do everything gas can do but cheaper, cleaner & more efficiently. All gas does is burden us with high costs & bad health for the rest of our lives
www.youtube.com/shorts/uSacJ...
There is no reason to have fossil gas in your home. Electricity can do everything gas can do but cheaper, cleaner & more efficiently. All gas does is burden us with high costs & bad health for the rest of our lives
www.youtube.com/shorts/uSacJ...
Reposted by Mark Z. Jacobson
Wind kicks in to push California to >100% WindWaterSolar for 215th day (out of 310) in 2025
Gas down 17.5% v '24 & 37.4% v '23
Solar up 15% v '24 & 43% v '23
Batteries up 56% v '24 & 198% v '23
61.4% of demand in '25 met by WWS (54% in-state +7.5% imports=58% of 12.9% imports)
Gas down 17.5% v '24 & 37.4% v '23
Solar up 15% v '24 & 43% v '23
Batteries up 56% v '24 & 198% v '23
61.4% of demand in '25 met by WWS (54% in-state +7.5% imports=58% of 12.9% imports)

November 7, 2025 at 5:52 PM
Wind kicks in to push California to >100% WindWaterSolar for 215th day (out of 310) in 2025
Gas down 17.5% v '24 & 37.4% v '23
Solar up 15% v '24 & 43% v '23
Batteries up 56% v '24 & 198% v '23
61.4% of demand in '25 met by WWS (54% in-state +7.5% imports=58% of 12.9% imports)
Gas down 17.5% v '24 & 37.4% v '23
Solar up 15% v '24 & 43% v '23
Batteries up 56% v '24 & 198% v '23
61.4% of demand in '25 met by WWS (54% in-state +7.5% imports=58% of 12.9% imports)
All-Electric Homes Save Money & Improve Health
There is no reason to have fossil gas in your home. Electricity can do everything gas can do but cheaper, cleaner & more efficiently. All gas does is burden us with high costs & bad health for the rest of our lives
www.youtube.com/shorts/uSacJ...
There is no reason to have fossil gas in your home. Electricity can do everything gas can do but cheaper, cleaner & more efficiently. All gas does is burden us with high costs & bad health for the rest of our lives
www.youtube.com/shorts/uSacJ...
All-Electric Homes Save Money and Improve Health
YouTube video by Mark Z. Jacobson
www.youtube.com
November 8, 2025 at 3:59 PM
All-Electric Homes Save Money & Improve Health
There is no reason to have fossil gas in your home. Electricity can do everything gas can do but cheaper, cleaner & more efficiently. All gas does is burden us with high costs & bad health for the rest of our lives
www.youtube.com/shorts/uSacJ...
There is no reason to have fossil gas in your home. Electricity can do everything gas can do but cheaper, cleaner & more efficiently. All gas does is burden us with high costs & bad health for the rest of our lives
www.youtube.com/shorts/uSacJ...
Wind kicks in to push California to >100% WindWaterSolar for 215th day (out of 310) in 2025
Gas down 17.5% v '24 & 37.4% v '23
Solar up 15% v '24 & 43% v '23
Batteries up 56% v '24 & 198% v '23
61.4% of demand in '25 met by WWS (54% in-state +7.5% imports=58% of 12.9% imports)
Gas down 17.5% v '24 & 37.4% v '23
Solar up 15% v '24 & 43% v '23
Batteries up 56% v '24 & 198% v '23
61.4% of demand in '25 met by WWS (54% in-state +7.5% imports=58% of 12.9% imports)
November 7, 2025 at 5:52 PM
Wind kicks in to push California to >100% WindWaterSolar for 215th day (out of 310) in 2025
Gas down 17.5% v '24 & 37.4% v '23
Solar up 15% v '24 & 43% v '23
Batteries up 56% v '24 & 198% v '23
61.4% of demand in '25 met by WWS (54% in-state +7.5% imports=58% of 12.9% imports)
Gas down 17.5% v '24 & 37.4% v '23
Solar up 15% v '24 & 43% v '23
Batteries up 56% v '24 & 198% v '23
61.4% of demand in '25 met by WWS (54% in-state +7.5% imports=58% of 12.9% imports)
Reposted by Mark Z. Jacobson
From the last graph, it is clear that WindWaterSolar follows load (demand) seasonally far better than does a baseload (flat) electricity source such as nuclear or coal.
Every day is a new record.
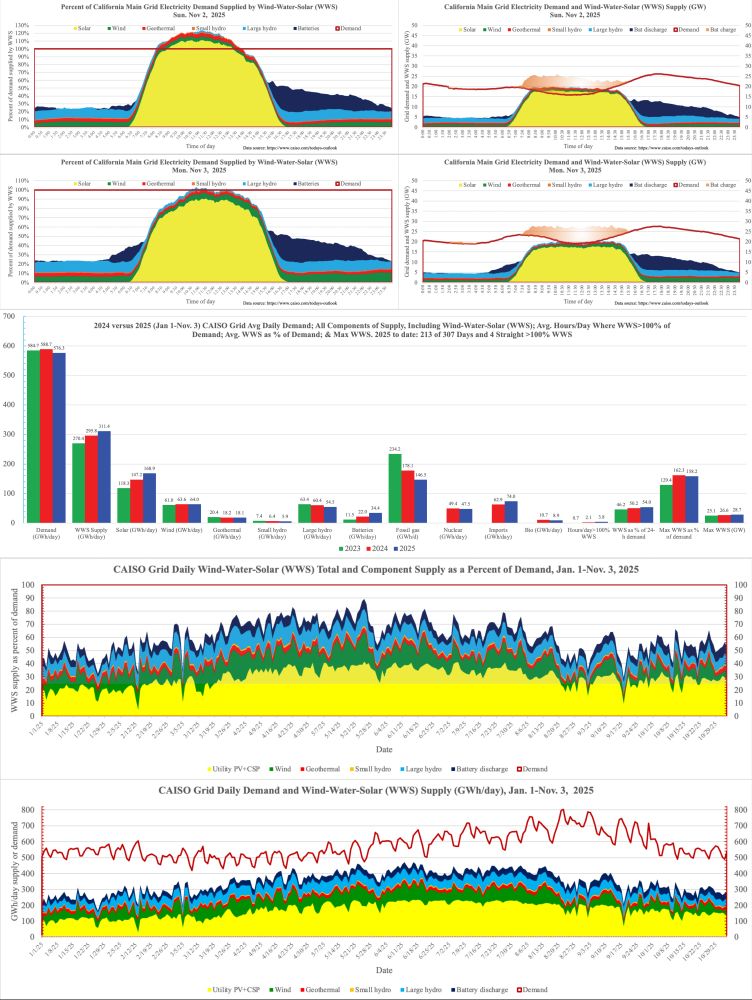
Two more 100% WindWaterSolar days for part of the day in CA, making it 213 100% days so far in 2025.
CA will be 100% WWS 24/7/365 by 2037.
PV and batteries are replacing gas rapidly.
Gas down 18% versus 2024 and 37.4% versus 2023.
Two more 100% WindWaterSolar days for part of the day in CA, making it 213 100% days so far in 2025.
CA will be 100% WWS 24/7/365 by 2037.
PV and batteries are replacing gas rapidly.
Gas down 18% versus 2024 and 37.4% versus 2023.
November 4, 2025 at 5:54 PM
From the last graph, it is clear that WindWaterSolar follows load (demand) seasonally far better than does a baseload (flat) electricity source such as nuclear or coal.
Reposted by Mark Z. Jacobson
Every day is a new record.
Two more 100% WindWaterSolar days for part of the day in CA, making it 213 100% days so far in 2025.
CA will be 100% WWS 24/7/365 by 2037.
PV and batteries are replacing gas rapidly.
Gas down 18% versus 2024 and 37.4% versus 2023.
Two more 100% WindWaterSolar days for part of the day in CA, making it 213 100% days so far in 2025.
CA will be 100% WWS 24/7/365 by 2037.
PV and batteries are replacing gas rapidly.
Gas down 18% versus 2024 and 37.4% versus 2023.
November 4, 2025 at 4:38 PM
Every day is a new record.
Two more 100% WindWaterSolar days for part of the day in CA, making it 213 100% days so far in 2025.
CA will be 100% WWS 24/7/365 by 2037.
PV and batteries are replacing gas rapidly.
Gas down 18% versus 2024 and 37.4% versus 2023.
Two more 100% WindWaterSolar days for part of the day in CA, making it 213 100% days so far in 2025.
CA will be 100% WWS 24/7/365 by 2037.
PV and batteries are replacing gas rapidly.
Gas down 18% versus 2024 and 37.4% versus 2023.
From the last graph, it is clear that WindWaterSolar follows load (demand) seasonally far better than does a baseload (flat) electricity source such as nuclear or coal.
Every day is a new record.
Two more 100% WindWaterSolar days for part of the day in CA, making it 213 100% days so far in 2025.
CA will be 100% WWS 24/7/365 by 2037.
PV and batteries are replacing gas rapidly.
Gas down 18% versus 2024 and 37.4% versus 2023.
Two more 100% WindWaterSolar days for part of the day in CA, making it 213 100% days so far in 2025.
CA will be 100% WWS 24/7/365 by 2037.
PV and batteries are replacing gas rapidly.
Gas down 18% versus 2024 and 37.4% versus 2023.
November 4, 2025 at 5:54 PM
From the last graph, it is clear that WindWaterSolar follows load (demand) seasonally far better than does a baseload (flat) electricity source such as nuclear or coal.
Every day is a new record.
Two more 100% WindWaterSolar days for part of the day in CA, making it 213 100% days so far in 2025.
CA will be 100% WWS 24/7/365 by 2037.
PV and batteries are replacing gas rapidly.
Gas down 18% versus 2024 and 37.4% versus 2023.
Two more 100% WindWaterSolar days for part of the day in CA, making it 213 100% days so far in 2025.
CA will be 100% WWS 24/7/365 by 2037.
PV and batteries are replacing gas rapidly.
Gas down 18% versus 2024 and 37.4% versus 2023.
November 4, 2025 at 4:38 PM
Every day is a new record.
Two more 100% WindWaterSolar days for part of the day in CA, making it 213 100% days so far in 2025.
CA will be 100% WWS 24/7/365 by 2037.
PV and batteries are replacing gas rapidly.
Gas down 18% versus 2024 and 37.4% versus 2023.
Two more 100% WindWaterSolar days for part of the day in CA, making it 213 100% days so far in 2025.
CA will be 100% WWS 24/7/365 by 2037.
PV and batteries are replacing gas rapidly.
Gas down 18% versus 2024 and 37.4% versus 2023.
Reposted by Mark Z. Jacobson
Busting a Myth:
Clean, Renewables Lower Electricity Prices
11 US states met 51-120% of their electricity demand for the year between mid 2024-2025 with just clean, renewable sources. Of these, 10 had electricity prices at least 2 c/kWh below the US avg
www.youtube.com/shorts/deygz...
Clean, Renewables Lower Electricity Prices
11 US states met 51-120% of their electricity demand for the year between mid 2024-2025 with just clean, renewable sources. Of these, 10 had electricity prices at least 2 c/kWh below the US avg
www.youtube.com/shorts/deygz...

Busting a Myth: Clean, Renewables Lower Electricity Prices
YouTube video by Mark Z. Jacobson
www.youtube.com
October 30, 2025 at 11:23 PM
Busting a Myth:
Clean, Renewables Lower Electricity Prices
11 US states met 51-120% of their electricity demand for the year between mid 2024-2025 with just clean, renewable sources. Of these, 10 had electricity prices at least 2 c/kWh below the US avg
www.youtube.com/shorts/deygz...
Clean, Renewables Lower Electricity Prices
11 US states met 51-120% of their electricity demand for the year between mid 2024-2025 with just clean, renewable sources. Of these, 10 had electricity prices at least 2 c/kWh below the US avg
www.youtube.com/shorts/deygz...
Reposted by Mark Z. Jacobson

California's transition to clean power is a trendsetter. World's 5th largest economy. For 7 months this year, California generated more than 100% of its power needs from clean sources for part of the day. A huge validation of how RE potential is limitless, affordable and reliable.
After 10 months of '25, we have ~7 months (211 days) with WindWaterSolar powering >100% of CA's main grid for part of the day
And look: Little wind Sat day but still 100% WWS
Gas down 18% v '24; 37% v '23
Demand down 2% v '24; 1.4% v '23
Solar up 15% v '24; 43% v '23
Batt up 56% v '24; 199% v '23
And look: Little wind Sat day but still 100% WWS
Gas down 18% v '24; 37% v '23
Demand down 2% v '24; 1.4% v '23
Solar up 15% v '24; 43% v '23
Batt up 56% v '24; 199% v '23

November 2, 2025 at 6:03 PM
California's transition to clean power is a trendsetter. World's 5th largest economy. For 7 months this year, California generated more than 100% of its power needs from clean sources for part of the day. A huge validation of how RE potential is limitless, affordable and reliable.
After 10 months of '25, we have ~7 months (211 days) with WindWaterSolar powering >100% of CA's main grid for part of the day
And look: Little wind Sat day but still 100% WWS
Gas down 18% v '24; 37% v '23
Demand down 2% v '24; 1.4% v '23
Solar up 15% v '24; 43% v '23
Batt up 56% v '24; 199% v '23
And look: Little wind Sat day but still 100% WWS
Gas down 18% v '24; 37% v '23
Demand down 2% v '24; 1.4% v '23
Solar up 15% v '24; 43% v '23
Batt up 56% v '24; 199% v '23
November 2, 2025 at 4:16 PM
After 10 months of '25, we have ~7 months (211 days) with WindWaterSolar powering >100% of CA's main grid for part of the day
And look: Little wind Sat day but still 100% WWS
Gas down 18% v '24; 37% v '23
Demand down 2% v '24; 1.4% v '23
Solar up 15% v '24; 43% v '23
Batt up 56% v '24; 199% v '23
And look: Little wind Sat day but still 100% WWS
Gas down 18% v '24; 37% v '23
Demand down 2% v '24; 1.4% v '23
Solar up 15% v '24; 43% v '23
Batt up 56% v '24; 199% v '23
Reposted by Mark Z. Jacobson

1/ New @lut.fi research investigates Shetland's energy future, finding it can reach #100RE & become a green e-hydrogen export hub for #Europe by 2050. doi.org/10.1016/j.en.... Potential to export over 626 TWh (H2,LHV) annually at a competitive cost of 77.6 €/MWh (H2,LHV).

November 1, 2025 at 11:00 AM
1/ New @lut.fi research investigates Shetland's energy future, finding it can reach #100RE & become a green e-hydrogen export hub for #Europe by 2050. doi.org/10.1016/j.en.... Potential to export over 626 TWh (H2,LHV) annually at a competitive cost of 77.6 €/MWh (H2,LHV).
Busting a Myth:
Clean, Renewables Lower Electricity Prices
11 US states met 51-120% of their electricity demand for the year between mid 2024-2025 with just clean, renewable sources. Of these, 10 had electricity prices at least 2 c/kWh below the US avg
www.youtube.com/shorts/deygz...
Clean, Renewables Lower Electricity Prices
11 US states met 51-120% of their electricity demand for the year between mid 2024-2025 with just clean, renewable sources. Of these, 10 had electricity prices at least 2 c/kWh below the US avg
www.youtube.com/shorts/deygz...
Busting a Myth: Clean, Renewables Lower Electricity Prices
YouTube video by Mark Z. Jacobson
www.youtube.com
October 30, 2025 at 11:23 PM
Busting a Myth:
Clean, Renewables Lower Electricity Prices
11 US states met 51-120% of their electricity demand for the year between mid 2024-2025 with just clean, renewable sources. Of these, 10 had electricity prices at least 2 c/kWh below the US avg
www.youtube.com/shorts/deygz...
Clean, Renewables Lower Electricity Prices
11 US states met 51-120% of their electricity demand for the year between mid 2024-2025 with just clean, renewable sources. Of these, 10 had electricity prices at least 2 c/kWh below the US avg
www.youtube.com/shorts/deygz...
My talk to the Elders Climate Action Group on what is needed to transition the world to 100% clean, renewable, energy across all energy sectors; what has been done to date; and what rate countries, states, and the world are transitioning.
Some surprises
www.youtube.com/watch?v=YOXw...
Some surprises
www.youtube.com/watch?v=YOXw...

Oct National Call 100% Clean, Renewable Energy and Storage for Everything with Mark Jacobson
YouTube video by Elders Climate Action
www.youtube.com
October 30, 2025 at 4:52 PM
My talk to the Elders Climate Action Group on what is needed to transition the world to 100% clean, renewable, energy across all energy sectors; what has been done to date; and what rate countries, states, and the world are transitioning.
Some surprises
www.youtube.com/watch?v=YOXw...
Some surprises
www.youtube.com/watch?v=YOXw...
Reposted by Mark Z. Jacobson

There is so much rooftop solar in South Australia that at times it supplies the whole state's needs. It's time the U.S. cut red tape so distributed energy can proliferate.
Thanks @mzjacobson.bsky.social for the inspiration for today's column. #greensky 🔌💡 #solar
www.rtoinsider.com/118104-power...
Thanks @mzjacobson.bsky.social for the inspiration for today's column. #greensky 🔌💡 #solar
www.rtoinsider.com/118104-power...

October 28, 2025 at 2:59 PM
There is so much rooftop solar in South Australia that at times it supplies the whole state's needs. It's time the U.S. cut red tape so distributed energy can proliferate.
Thanks @mzjacobson.bsky.social for the inspiration for today's column. #greensky 🔌💡 #solar
www.rtoinsider.com/118104-power...
Thanks @mzjacobson.bsky.social for the inspiration for today's column. #greensky 🔌💡 #solar
www.rtoinsider.com/118104-power...
Reposted by Mark Z. Jacobson

Brief and clear (though US-oriented) explainer by @mzjacobson.bsky.social on why biofuels are nothing like as "green" as they are portrayed:
Why Ethanol for Vehicles, Even With Carbon Capture, Increases CO2 and Pollution and Should be Abandoned
Ethanol damages climate & air quality, raises costs, & requires enormous land vs battery-electric vehicles powered by wind or solar
www.youtube.com/watch?v=B6E1...
Ethanol damages climate & air quality, raises costs, & requires enormous land vs battery-electric vehicles powered by wind or solar
www.youtube.com/watch?v=B6E1...

Why Ethanol for Vehicles, Even With Carbon Capture, Increases CO2 & Pollution & Should be Abandoned
YouTube video by Mark Z. Jacobson
www.youtube.com
October 29, 2025 at 6:59 AM
Brief and clear (though US-oriented) explainer by @mzjacobson.bsky.social on why biofuels are nothing like as "green" as they are portrayed:
Reposted by Mark Z. Jacobson

A very helpful explanation of ethanol green washing.
Why Ethanol for Vehicles, Even With Carbon Capture, Increases CO2 and Pollution and Should be Abandoned
Ethanol damages climate & air quality, raises costs, & requires enormous land vs battery-electric vehicles powered by wind or solar
www.youtube.com/watch?v=B6E1...
Ethanol damages climate & air quality, raises costs, & requires enormous land vs battery-electric vehicles powered by wind or solar
www.youtube.com/watch?v=B6E1...
Why Ethanol for Vehicles, Even With Carbon Capture, Increases CO2 & Pollution & Should be Abandoned
YouTube video by Mark Z. Jacobson
www.youtube.com
October 28, 2025 at 9:24 PM
A very helpful explanation of ethanol green washing.
Another 6 days straight and 208 of 300 in 2025 with WindWaterSolar powering CA's main grid for part of the day
CA 54.24% in-state WWS for all of 2025, 3.87% higher than last year's 50.37%. At this rate, CA will be 100% WWS 24/7/365 by 2036.
Gas down 18.5% v '24 & 37.4% v '23
CA 54.24% in-state WWS for all of 2025, 3.87% higher than last year's 50.37%. At this rate, CA will be 100% WWS 24/7/365 by 2036.
Gas down 18.5% v '24 & 37.4% v '23

October 28, 2025 at 11:06 PM
Another 6 days straight and 208 of 300 in 2025 with WindWaterSolar powering CA's main grid for part of the day
CA 54.24% in-state WWS for all of 2025, 3.87% higher than last year's 50.37%. At this rate, CA will be 100% WWS 24/7/365 by 2036.
Gas down 18.5% v '24 & 37.4% v '23
CA 54.24% in-state WWS for all of 2025, 3.87% higher than last year's 50.37%. At this rate, CA will be 100% WWS 24/7/365 by 2036.
Gas down 18.5% v '24 & 37.4% v '23
Why Ethanol for Vehicles, Even With Carbon Capture, Increases CO2 and Pollution and Should be Abandoned
Ethanol damages climate & air quality, raises costs, & requires enormous land vs battery-electric vehicles powered by wind or solar
www.youtube.com/watch?v=B6E1...
Ethanol damages climate & air quality, raises costs, & requires enormous land vs battery-electric vehicles powered by wind or solar
www.youtube.com/watch?v=B6E1...
Why Ethanol for Vehicles, Even With Carbon Capture, Increases CO2 & Pollution & Should be Abandoned
YouTube video by Mark Z. Jacobson
www.youtube.com
October 27, 2025 at 7:55 PM
Why Ethanol for Vehicles, Even With Carbon Capture, Increases CO2 and Pollution and Should be Abandoned
Ethanol damages climate & air quality, raises costs, & requires enormous land vs battery-electric vehicles powered by wind or solar
www.youtube.com/watch?v=B6E1...
Ethanol damages climate & air quality, raises costs, & requires enormous land vs battery-electric vehicles powered by wind or solar
www.youtube.com/watch?v=B6E1...
Reposted by Mark Z. Jacobson
Just a reminder that the sun shines, the wind blows, the water flows, and the Earth creates heat every day
206 days in 2025 so far with WindWaterSolar exceeding 100% of demand on CA's main grid for part of the day, averaging 3.9 among all 298 days in 2025
And fossil gas is down 37.4% in 2 y
206 days in 2025 so far with WindWaterSolar exceeding 100% of demand on CA's main grid for part of the day, averaging 3.9 among all 298 days in 2025
And fossil gas is down 37.4% in 2 y

October 26, 2025 at 3:48 PM
Just a reminder that the sun shines, the wind blows, the water flows, and the Earth creates heat every day
206 days in 2025 so far with WindWaterSolar exceeding 100% of demand on CA's main grid for part of the day, averaging 3.9 among all 298 days in 2025
And fossil gas is down 37.4% in 2 y
206 days in 2025 so far with WindWaterSolar exceeding 100% of demand on CA's main grid for part of the day, averaging 3.9 among all 298 days in 2025
And fossil gas is down 37.4% in 2 y
October 26, 2025 at 3:48 PM
Just a reminder that the sun shines, the wind blows, the water flows, and the Earth creates heat every day
206 days in 2025 so far with WindWaterSolar exceeding 100% of demand on CA's main grid for part of the day, averaging 3.9 among all 298 days in 2025
And fossil gas is down 37.4% in 2 y
206 days in 2025 so far with WindWaterSolar exceeding 100% of demand on CA's main grid for part of the day, averaging 3.9 among all 298 days in 2025
And fossil gas is down 37.4% in 2 y
Reposted by Mark Z. Jacobson

Australia overtakes United Kingdom to rank 3rd behind China and the United States in utility-scale battery capacity
Australia 14 GW/37 GWh of projects at / nearing financial close
(Current operating: 8,616 MW / 18,121 MWh)
pv-magazine.com/2025/10/21/a...
ping @mzjacobson.bsky.social
Australia 14 GW/37 GWh of projects at / nearing financial close
(Current operating: 8,616 MW / 18,121 MWh)
pv-magazine.com/2025/10/21/a...
ping @mzjacobson.bsky.social

October 25, 2025 at 5:16 AM
Australia overtakes United Kingdom to rank 3rd behind China and the United States in utility-scale battery capacity
Australia 14 GW/37 GWh of projects at / nearing financial close
(Current operating: 8,616 MW / 18,121 MWh)
pv-magazine.com/2025/10/21/a...
ping @mzjacobson.bsky.social
Australia 14 GW/37 GWh of projects at / nearing financial close
(Current operating: 8,616 MW / 18,121 MWh)
pv-magazine.com/2025/10/21/a...
ping @mzjacobson.bsky.social