


Michele Zanini
@mzaniniphysiology.bsky.social
Lecturer in Applied Exercise Science @ The Open University
PhD @ Loughborough University
Head of S&C and Physiologist @ Italian Triathlon Federation
Applied Physiology, Endurance, Performance
PhD @ Loughborough University
Head of S&C and Physiologist @ Italian Triathlon Federation
Applied Physiology, Endurance, Performance
5/7
When we merged data from both groups, RE durability correlated:
📉 strongly to weekly longest run (r=-0.67; p<0.001)
📉 and moderately to weekly running distance (r=-0.48; p=0.038)
But not to declines in neuromuscular function.
When we merged data from both groups, RE durability correlated:
📉 strongly to weekly longest run (r=-0.67; p<0.001)
📉 and moderately to weekly running distance (r=-0.48; p=0.038)
But not to declines in neuromuscular function.

August 29, 2025 at 5:21 PM
5/7
When we merged data from both groups, RE durability correlated:
📉 strongly to weekly longest run (r=-0.67; p<0.001)
📉 and moderately to weekly running distance (r=-0.48; p=0.038)
But not to declines in neuromuscular function.
When we merged data from both groups, RE durability correlated:
📉 strongly to weekly longest run (r=-0.67; p<0.001)
📉 and moderately to weekly running distance (r=-0.48; p=0.038)
But not to declines in neuromuscular function.
4/7
Neuromuscular function followed a similar trend:
🦵🏼 SDT showed larger drops in maximal squat force (-19% vs -12%)
⬆️ SDT lost CMJ performance (6.6%), while LDT maintained it
Neuromuscular function followed a similar trend:
🦵🏼 SDT showed larger drops in maximal squat force (-19% vs -12%)
⬆️ SDT lost CMJ performance (6.6%), while LDT maintained it

August 29, 2025 at 5:21 PM
4/7
Neuromuscular function followed a similar trend:
🦵🏼 SDT showed larger drops in maximal squat force (-19% vs -12%)
⬆️ SDT lost CMJ performance (6.6%), while LDT maintained it
Neuromuscular function followed a similar trend:
🦵🏼 SDT showed larger drops in maximal squat force (-19% vs -12%)
⬆️ SDT lost CMJ performance (6.6%), while LDT maintained it
3/7
During a 90 min run at LT:
- Running economy deteriorated nearly 50% less in LDT than SDT (+3.1% vs +6.0%)
- Differences emerged after 60min and grew with time
During a 90 min run at LT:
- Running economy deteriorated nearly 50% less in LDT than SDT (+3.1% vs +6.0%)
- Differences emerged after 60min and grew with time

August 29, 2025 at 5:21 PM
3/7
During a 90 min run at LT:
- Running economy deteriorated nearly 50% less in LDT than SDT (+3.1% vs +6.0%)
- Differences emerged after 60min and grew with time
During a 90 min run at LT:
- Running economy deteriorated nearly 50% less in LDT than SDT (+3.1% vs +6.0%)
- Differences emerged after 60min and grew with time
2/7
We matched well-trained runners for 10k time (39 min), V̇O₂max (~58 ml/kg/min) & LT speed (12-13 km/h)
But differed in training characteristics:
- LDT: regularly running ≥90min
- SDT: always run <70min
LDT also ran more (51 vs 30 km/wk) & had better fresh running economy
We matched well-trained runners for 10k time (39 min), V̇O₂max (~58 ml/kg/min) & LT speed (12-13 km/h)
But differed in training characteristics:
- LDT: regularly running ≥90min
- SDT: always run <70min
LDT also ran more (51 vs 30 km/wk) & had better fresh running economy

August 29, 2025 at 5:21 PM
2/7
We matched well-trained runners for 10k time (39 min), V̇O₂max (~58 ml/kg/min) & LT speed (12-13 km/h)
But differed in training characteristics:
- LDT: regularly running ≥90min
- SDT: always run <70min
LDT also ran more (51 vs 30 km/wk) & had better fresh running economy
We matched well-trained runners for 10k time (39 min), V̇O₂max (~58 ml/kg/min) & LT speed (12-13 km/h)
But differed in training characteristics:
- LDT: regularly running ≥90min
- SDT: always run <70min
LDT also ran more (51 vs 30 km/wk) & had better fresh running economy
🚨 The last paper of my PhD is out in @MSSE
Regular Long Runs and Higher Training Volumes are Associated with Better Running Economy Durability in Performance Matched Well-Trained Male Runners
🙏🏻 Rich Blagrove & Jonathan Folland
Temporary free download.
🔗 journals.lww.com/acsm-msse/ab...
🧵 1/7
Regular Long Runs and Higher Training Volumes are Associated with Better Running Economy Durability in Performance Matched Well-Trained Male Runners
🙏🏻 Rich Blagrove & Jonathan Folland
Temporary free download.
🔗 journals.lww.com/acsm-msse/ab...
🧵 1/7

August 29, 2025 at 5:21 PM
🚨 The last paper of my PhD is out in @MSSE
Regular Long Runs and Higher Training Volumes are Associated with Better Running Economy Durability in Performance Matched Well-Trained Male Runners
🙏🏻 Rich Blagrove & Jonathan Folland
Temporary free download.
🔗 journals.lww.com/acsm-msse/ab...
🧵 1/7
Regular Long Runs and Higher Training Volumes are Associated with Better Running Economy Durability in Performance Matched Well-Trained Male Runners
🙏🏻 Rich Blagrove & Jonathan Folland
Temporary free download.
🔗 journals.lww.com/acsm-msse/ab...
🧵 1/7
3rd place in the Young Investigator Award at @ecssofficial.bsky.social, presenting in front of 1500+ people.
“You are here because you are excellent, and the quality of your research is excellent”.
Among the kindest words I’ve ever been told. As a young scientist, they mean the world 🙏🏼
Ad maiora.
“You are here because you are excellent, and the quality of your research is excellent”.
Among the kindest words I’ve ever been told. As a young scientist, they mean the world 🙏🏼
Ad maiora.


July 7, 2025 at 4:56 PM
3rd place in the Young Investigator Award at @ecssofficial.bsky.social, presenting in front of 1500+ people.
“You are here because you are excellent, and the quality of your research is excellent”.
Among the kindest words I’ve ever been told. As a young scientist, they mean the world 🙏🏼
Ad maiora.
“You are here because you are excellent, and the quality of your research is excellent”.
Among the kindest words I’ve ever been told. As a young scientist, they mean the world 🙏🏼
Ad maiora.
This Tuesday I will give an oral presentation at the @ecssofficial.bsky.social annual congress in Rimini about:
The effect of 90 and 120 min of running on the determinants of endurance performance in well-trained male marathoners
01.07.2025, 14.30
The effect of 90 and 120 min of running on the determinants of endurance performance in well-trained male marathoners
01.07.2025, 14.30

June 29, 2025 at 7:57 AM
This Tuesday I will give an oral presentation at the @ecssofficial.bsky.social annual congress in Rimini about:
The effect of 90 and 120 min of running on the determinants of endurance performance in well-trained male marathoners
01.07.2025, 14.30
The effect of 90 and 120 min of running on the determinants of endurance performance in well-trained male marathoners
01.07.2025, 14.30
📣 New paper out in European Journal of Applied Physiology
We discuss an often-overlooked aspect in sports science and rehab research:
The importance of matching training load across interventions.
Nice collaboration led by Tomek Kowalski.
📄 Open access
🔗 link.springer.com/article/10.1...
🧵1/5
We discuss an often-overlooked aspect in sports science and rehab research:
The importance of matching training load across interventions.
Nice collaboration led by Tomek Kowalski.
📄 Open access
🔗 link.springer.com/article/10.1...
🧵1/5

June 24, 2025 at 8:19 AM
📣 New paper out in European Journal of Applied Physiology
We discuss an often-overlooked aspect in sports science and rehab research:
The importance of matching training load across interventions.
Nice collaboration led by Tomek Kowalski.
📄 Open access
🔗 link.springer.com/article/10.1...
🧵1/5
We discuss an often-overlooked aspect in sports science and rehab research:
The importance of matching training load across interventions.
Nice collaboration led by Tomek Kowalski.
📄 Open access
🔗 link.springer.com/article/10.1...
🧵1/5
6/8
Blood lactate (BLa) was the least reliable:
🔹 ICC = 0.48–0.94 🔹 CV = 5–16%
Reliability dropped after 60 min.
This likely reflects limits in analyser precision more than physiology. Caution warranted when interpreting small BLa changes during prolonged exercise!
Blood lactate (BLa) was the least reliable:
🔹 ICC = 0.48–0.94 🔹 CV = 5–16%
Reliability dropped after 60 min.
This likely reflects limits in analyser precision more than physiology. Caution warranted when interpreting small BLa changes during prolonged exercise!

May 27, 2025 at 12:40 PM
6/8
Blood lactate (BLa) was the least reliable:
🔹 ICC = 0.48–0.94 🔹 CV = 5–16%
Reliability dropped after 60 min.
This likely reflects limits in analyser precision more than physiology. Caution warranted when interpreting small BLa changes during prolonged exercise!
Blood lactate (BLa) was the least reliable:
🔹 ICC = 0.48–0.94 🔹 CV = 5–16%
Reliability dropped after 60 min.
This likely reflects limits in analyser precision more than physiology. Caution warranted when interpreting small BLa changes during prolonged exercise!
5/8
RPE was moderately reliable, with:
🔹 ICCs = 0.41–0.72 🔹 CV = 4.2–6.0% No effect of time on CV – fatigue didn’t make it less reliable.
Important: subjectivity means RPE isn’t as stable as physiological data.
RPE was moderately reliable, with:
🔹 ICCs = 0.41–0.72 🔹 CV = 4.2–6.0% No effect of time on CV – fatigue didn’t make it less reliable.
Important: subjectivity means RPE isn’t as stable as physiological data.

May 27, 2025 at 12:40 PM
5/8
RPE was moderately reliable, with:
🔹 ICCs = 0.41–0.72 🔹 CV = 4.2–6.0% No effect of time on CV – fatigue didn’t make it less reliable.
Important: subjectivity means RPE isn’t as stable as physiological data.
RPE was moderately reliable, with:
🔹 ICCs = 0.41–0.72 🔹 CV = 4.2–6.0% No effect of time on CV – fatigue didn’t make it less reliable.
Important: subjectivity means RPE isn’t as stable as physiological data.
4/8
Heart rate (HR) was also highly reliable:
🔹 ICCs = 0.82–0.92 🔹 CV = ~1.1% 🔻 Slightly lower in trial 2 at later timepoints; possibly due to familiarisation.
Still well within typical day-to-day HR variability.
Heart rate (HR) was also highly reliable:
🔹 ICCs = 0.82–0.92 🔹 CV = ~1.1% 🔻 Slightly lower in trial 2 at later timepoints; possibly due to familiarisation.
Still well within typical day-to-day HR variability.

May 27, 2025 at 12:40 PM
4/8
Heart rate (HR) was also highly reliable:
🔹 ICCs = 0.82–0.92 🔹 CV = ~1.1% 🔻 Slightly lower in trial 2 at later timepoints; possibly due to familiarisation.
Still well within typical day-to-day HR variability.
Heart rate (HR) was also highly reliable:
🔹 ICCs = 0.82–0.92 🔹 CV = ~1.1% 🔻 Slightly lower in trial 2 at later timepoints; possibly due to familiarisation.
Still well within typical day-to-day HR variability.
3/8
Ventilation (VE) and RER also showed strong reliability:
🔹 VE: ICC = 0.96–0.97, CV < 3.6% 🔹 RER: ICC = 0.78, TE ≤ 1.9%
These markers are consistent across 90 min of heavy-intensity running.
Ventilation (VE) and RER also showed strong reliability:
🔹 VE: ICC = 0.96–0.97, CV < 3.6% 🔹 RER: ICC = 0.78, TE ≤ 1.9%
These markers are consistent across 90 min of heavy-intensity running.

May 27, 2025 at 12:40 PM
3/8
Ventilation (VE) and RER also showed strong reliability:
🔹 VE: ICC = 0.96–0.97, CV < 3.6% 🔹 RER: ICC = 0.78, TE ≤ 1.9%
These markers are consistent across 90 min of heavy-intensity running.
Ventilation (VE) and RER also showed strong reliability:
🔹 VE: ICC = 0.96–0.97, CV < 3.6% 🔹 RER: ICC = 0.78, TE ≤ 1.9%
These markers are consistent across 90 min of heavy-intensity running.
2/8
Both Energy Cost (EC) and Oxygen Cost (OC) showed excellent reliability across all timepoints:
✅ ICCs: 0.96–0.99 ✅ CVs: 0.6%–1.2% ✅ TE: ≤1.4%
No decline in reliability over time.
‼️RE durability is measurable and trustworthy.
Both Energy Cost (EC) and Oxygen Cost (OC) showed excellent reliability across all timepoints:
✅ ICCs: 0.96–0.99 ✅ CVs: 0.6%–1.2% ✅ TE: ≤1.4%
No decline in reliability over time.
‼️RE durability is measurable and trustworthy.

May 27, 2025 at 12:40 PM
2/8
Both Energy Cost (EC) and Oxygen Cost (OC) showed excellent reliability across all timepoints:
✅ ICCs: 0.96–0.99 ✅ CVs: 0.6%–1.2% ✅ TE: ≤1.4%
No decline in reliability over time.
‼️RE durability is measurable and trustworthy.
Both Energy Cost (EC) and Oxygen Cost (OC) showed excellent reliability across all timepoints:
✅ ICCs: 0.96–0.99 ✅ CVs: 0.6%–1.2% ✅ TE: ≤1.4%
No decline in reliability over time.
‼️RE durability is measurable and trustworthy.
New paper out in Scand J Med Sci Sports!
We tested the reliability of running economy (RE) and other physiological parameters during 90 min of running. ➡️ Running economy is highly reliable in a fatigued state, a 👍🏼 implication for testing durability
🆓📄 onlinelibrary.wiley.com/doi/10.1111/...
🧵1/8
We tested the reliability of running economy (RE) and other physiological parameters during 90 min of running. ➡️ Running economy is highly reliable in a fatigued state, a 👍🏼 implication for testing durability
🆓📄 onlinelibrary.wiley.com/doi/10.1111/...
🧵1/8
May 27, 2025 at 12:40 PM
New paper out in Scand J Med Sci Sports!
We tested the reliability of running economy (RE) and other physiological parameters during 90 min of running. ➡️ Running economy is highly reliable in a fatigued state, a 👍🏼 implication for testing durability
🆓📄 onlinelibrary.wiley.com/doi/10.1111/...
🧵1/8
We tested the reliability of running economy (RE) and other physiological parameters during 90 min of running. ➡️ Running economy is highly reliable in a fatigued state, a 👍🏼 implication for testing durability
🆓📄 onlinelibrary.wiley.com/doi/10.1111/...
🧵1/8
🏃🏻 A results summary:
→ VO₂peak ↓
→ RE ↓
→ sLT ↓
→ FULT ↑ (misleadingly)
🏁 Intensity drifts upward → effort gets harder → pacing is harder to sustain
🧠 Testing in an unfatigued state may overestimate race pace. Especially in athletes with poor durability.
9/14
→ VO₂peak ↓
→ RE ↓
→ sLT ↓
→ FULT ↑ (misleadingly)
🏁 Intensity drifts upward → effort gets harder → pacing is harder to sustain
🧠 Testing in an unfatigued state may overestimate race pace. Especially in athletes with poor durability.
9/14

May 19, 2025 at 9:16 AM
🏃🏻 A results summary:
→ VO₂peak ↓
→ RE ↓
→ sLT ↓
→ FULT ↑ (misleadingly)
🏁 Intensity drifts upward → effort gets harder → pacing is harder to sustain
🧠 Testing in an unfatigued state may overestimate race pace. Especially in athletes with poor durability.
9/14
→ VO₂peak ↓
→ RE ↓
→ sLT ↓
→ FULT ↑ (misleadingly)
🏁 Intensity drifts upward → effort gets harder → pacing is harder to sustain
🧠 Testing in an unfatigued state may overestimate race pace. Especially in athletes with poor durability.
9/14
🏁 Speed at LT (sLT) — strongly associated with marathon performance — declined:
3.0% after 90min
6.6% after 120min
sLT may help to capture the cumulative effect of all determinant changes.
🫁 V̇O₂ at LT was unchanged
🫀HR at LT only increased slightly (+2 bpm)
8/14
3.0% after 90min
6.6% after 120min
sLT may help to capture the cumulative effect of all determinant changes.
🫁 V̇O₂ at LT was unchanged
🫀HR at LT only increased slightly (+2 bpm)
8/14

May 19, 2025 at 9:16 AM
🏁 Speed at LT (sLT) — strongly associated with marathon performance — declined:
3.0% after 90min
6.6% after 120min
sLT may help to capture the cumulative effect of all determinant changes.
🫁 V̇O₂ at LT was unchanged
🫀HR at LT only increased slightly (+2 bpm)
8/14
3.0% after 90min
6.6% after 120min
sLT may help to capture the cumulative effect of all determinant changes.
🫁 V̇O₂ at LT was unchanged
🫀HR at LT only increased slightly (+2 bpm)
8/14
⚠️ Fractional utilisation at LT (FULT):
+2.8% (90 min)
+4.9% (120 min)
This increase isn’t necessarily a good thing — it likely reflected the shrinking aerobic ceiling (V̇O₂max) while V̇O₂ at LT stayed the same.
7/14
+2.8% (90 min)
+4.9% (120 min)
This increase isn’t necessarily a good thing — it likely reflected the shrinking aerobic ceiling (V̇O₂max) while V̇O₂ at LT stayed the same.
7/14

May 19, 2025 at 9:16 AM
⚠️ Fractional utilisation at LT (FULT):
+2.8% (90 min)
+4.9% (120 min)
This increase isn’t necessarily a good thing — it likely reflected the shrinking aerobic ceiling (V̇O₂max) while V̇O₂ at LT stayed the same.
7/14
+2.8% (90 min)
+4.9% (120 min)
This increase isn’t necessarily a good thing — it likely reflected the shrinking aerobic ceiling (V̇O₂max) while V̇O₂ at LT stayed the same.
7/14
As a result of V̇O₂peak and RE changes, By 90 and 120min the run intensity climbed from 79%, to 86%, to 91% V̇O₂peak.
4 runners hit >95% and likely crossed the heavy-severe domain threshold.
⚠️ This would lead to rapid fatigue development in the marathon.
6/14
4 runners hit >95% and likely crossed the heavy-severe domain threshold.
⚠️ This would lead to rapid fatigue development in the marathon.
6/14

May 19, 2025 at 9:16 AM
As a result of V̇O₂peak and RE changes, By 90 and 120min the run intensity climbed from 79%, to 86%, to 91% V̇O₂peak.
4 runners hit >95% and likely crossed the heavy-severe domain threshold.
⚠️ This would lead to rapid fatigue development in the marathon.
6/14
4 runners hit >95% and likely crossed the heavy-severe domain threshold.
⚠️ This would lead to rapid fatigue development in the marathon.
6/14
Running economy (RE) expressed as O₂ cost (ml/kg/km) worsened more steadily:
+4.2% (90 min)
+5.8% (120 min)
In line with previous studies.
5/14
+4.2% (90 min)
+5.8% (120 min)
In line with previous studies.
5/14

May 19, 2025 at 9:16 AM
Running economy (RE) expressed as O₂ cost (ml/kg/km) worsened more steadily:
+4.2% (90 min)
+5.8% (120 min)
In line with previous studies.
5/14
+4.2% (90 min)
+5.8% (120 min)
In line with previous studies.
5/14
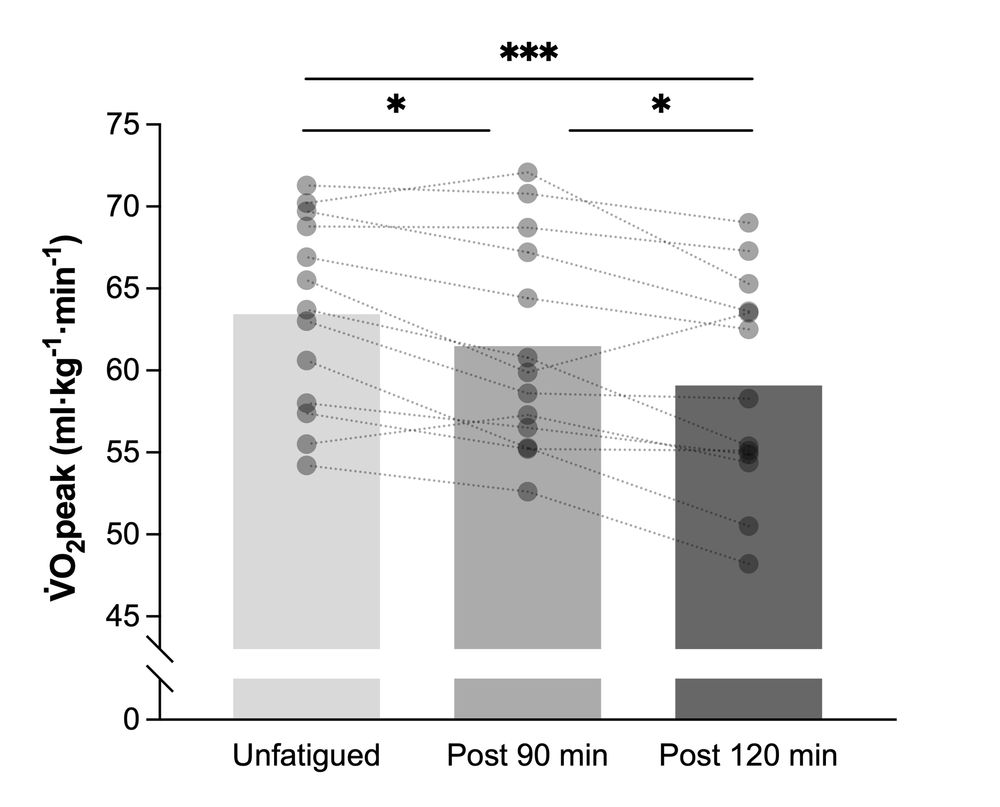
🫁 V̇O₂peak (ml/kg/min) dropped:
-3.1% after 90min
-7.1% after 120min
🏃🏻 Speed at V̇O₂peak was reduced by:
-5.8% after 90 min
-10.7% after 120 min
Maximal HR, peak blood lactate, and RER largely decreased.
4/14
-3.1% after 90min
-7.1% after 120min
🏃🏻 Speed at V̇O₂peak was reduced by:
-5.8% after 90 min
-10.7% after 120 min
Maximal HR, peak blood lactate, and RER largely decreased.
4/14
May 19, 2025 at 9:16 AM
🫁 V̇O₂peak (ml/kg/min) dropped:
-3.1% after 90min
-7.1% after 120min
🏃🏻 Speed at V̇O₂peak was reduced by:
-5.8% after 90 min
-10.7% after 120 min
Maximal HR, peak blood lactate, and RER largely decreased.
4/14
-3.1% after 90min
-7.1% after 120min
🏃🏻 Speed at V̇O₂peak was reduced by:
-5.8% after 90 min
-10.7% after 120 min
Maximal HR, peak blood lactate, and RER largely decreased.
4/14
We used a standardised protocol:
🧪 Measured determinants of performance and speed at LT in 3 conditions:
🧪 Unfatigued and after 90 and 120 min of running
🧪 At heavy-intensity
🧪 Same lab conditions, footwear, and nutrition
With highly-trained runners (2:47 marathon SB)
2/14
🧪 Measured determinants of performance and speed at LT in 3 conditions:
🧪 Unfatigued and after 90 and 120 min of running
🧪 At heavy-intensity
🧪 Same lab conditions, footwear, and nutrition
With highly-trained runners (2:47 marathon SB)
2/14

May 19, 2025 at 9:16 AM
We used a standardised protocol:
🧪 Measured determinants of performance and speed at LT in 3 conditions:
🧪 Unfatigued and after 90 and 120 min of running
🧪 At heavy-intensity
🧪 Same lab conditions, footwear, and nutrition
With highly-trained runners (2:47 marathon SB)
2/14
🧪 Measured determinants of performance and speed at LT in 3 conditions:
🧪 Unfatigued and after 90 and 120 min of running
🧪 At heavy-intensity
🧪 Same lab conditions, footwear, and nutrition
With highly-trained runners (2:47 marathon SB)
2/14
Our new durability paper is out in SJMSS!
We tested how endurance performance determinants change after heavy-intensity running (90 and 120 min) in well-trained marathoners.
📌Below details of what we’ve found.
🆓 Open-Access
📄 onlinelibrary.wiley.com/doi/10.1111/...
🧵1/14
We tested how endurance performance determinants change after heavy-intensity running (90 and 120 min) in well-trained marathoners.
📌Below details of what we’ve found.
🆓 Open-Access
📄 onlinelibrary.wiley.com/doi/10.1111/...
🧵1/14
May 19, 2025 at 9:16 AM
Our new durability paper is out in SJMSS!
We tested how endurance performance determinants change after heavy-intensity running (90 and 120 min) in well-trained marathoners.
📌Below details of what we’ve found.
🆓 Open-Access
📄 onlinelibrary.wiley.com/doi/10.1111/...
🧵1/14
We tested how endurance performance determinants change after heavy-intensity running (90 and 120 min) in well-trained marathoners.
📌Below details of what we’ve found.
🆓 Open-Access
📄 onlinelibrary.wiley.com/doi/10.1111/...
🧵1/14
Physiological Responses During Prolonged Running
Enhanced running economy durability in E+S (red) vs E (blue).
Lower blood lactate & RPE at 90 min in E+S vs E.
📊 In figure changes pre-post intervention.
🧵 6/10
Enhanced running economy durability in E+S (red) vs E (blue).
Lower blood lactate & RPE at 90 min in E+S vs E.
📊 In figure changes pre-post intervention.
🧵 6/10

March 2, 2025 at 7:06 PM
Physiological Responses During Prolonged Running
Enhanced running economy durability in E+S (red) vs E (blue).
Lower blood lactate & RPE at 90 min in E+S vs E.
📊 In figure changes pre-post intervention.
🧵 6/10
Enhanced running economy durability in E+S (red) vs E (blue).
Lower blood lactate & RPE at 90 min in E+S vs E.
📊 In figure changes pre-post intervention.
🧵 6/10
Strength & Power Adaptations
Strength training resulted in:
✅ +15-22% Maximal isometric strength
✅ +7% Jump height and power
🦵🏼 Neuromuscular adaptations may underpin improvements in RE durability and fatigued performance.
🧵 5/10
Strength training resulted in:
✅ +15-22% Maximal isometric strength
✅ +7% Jump height and power
🦵🏼 Neuromuscular adaptations may underpin improvements in RE durability and fatigued performance.
🧵 5/10
March 2, 2025 at 7:06 PM
Strength & Power Adaptations
Strength training resulted in:
✅ +15-22% Maximal isometric strength
✅ +7% Jump height and power
🦵🏼 Neuromuscular adaptations may underpin improvements in RE durability and fatigued performance.
🧵 5/10
Strength training resulted in:
✅ +15-22% Maximal isometric strength
✅ +7% Jump height and power
🦵🏼 Neuromuscular adaptations may underpin improvements in RE durability and fatigued performance.
🧵 5/10
Enhanced Fatigued High-Intensity Performance
After 90 min of running, strength-trained runners exhibited a 35% increase in TTE
While the endurance-only group remained unchanged.
Indicates improved ability to sustain high-intensity efforts under fatigue.
🧵 4/10
After 90 min of running, strength-trained runners exhibited a 35% increase in TTE
While the endurance-only group remained unchanged.
Indicates improved ability to sustain high-intensity efforts under fatigue.
🧵 4/10

March 2, 2025 at 7:06 PM
Enhanced Fatigued High-Intensity Performance
After 90 min of running, strength-trained runners exhibited a 35% increase in TTE
While the endurance-only group remained unchanged.
Indicates improved ability to sustain high-intensity efforts under fatigue.
🧵 4/10
After 90 min of running, strength-trained runners exhibited a 35% increase in TTE
While the endurance-only group remained unchanged.
Indicates improved ability to sustain high-intensity efforts under fatigue.
🧵 4/10