


barqueira
@lbarqueira.bsky.social
Data Visualization & Creative Coding enthusiast. Ex-DellEMC, ex-Siemens. MSc, Electrical and Computer Engineering. 🐶Welsh Corgi ❤️🎼🌊📷
Blog: http://lbarqueira.github.io/
Blog: http://lbarqueira.github.io/
Pinned
barqueira
@lbarqueira.bsky.social
· Dec 4

Mediterranean Sea Bathymetry.
Data: AWS Terrain Tiles, retrieved with {elevatr}.
Credits to @milos-makes-maps.bsky.social for its amazing R tutorials on #dataviz, and to @tylermorganwall.bsky.social for the #rayshader R package.
#rstats #maps #rspatial #gis #gischat
Data: AWS Terrain Tiles, retrieved with {elevatr}.
Credits to @milos-makes-maps.bsky.social for its amazing R tutorials on #dataviz, and to @tylermorganwall.bsky.social for the #rayshader R package.
#rstats #maps #rspatial #gis #gischat

September 5, 2025 at 9:10 PM

August 31, 2025 at 9:34 PM
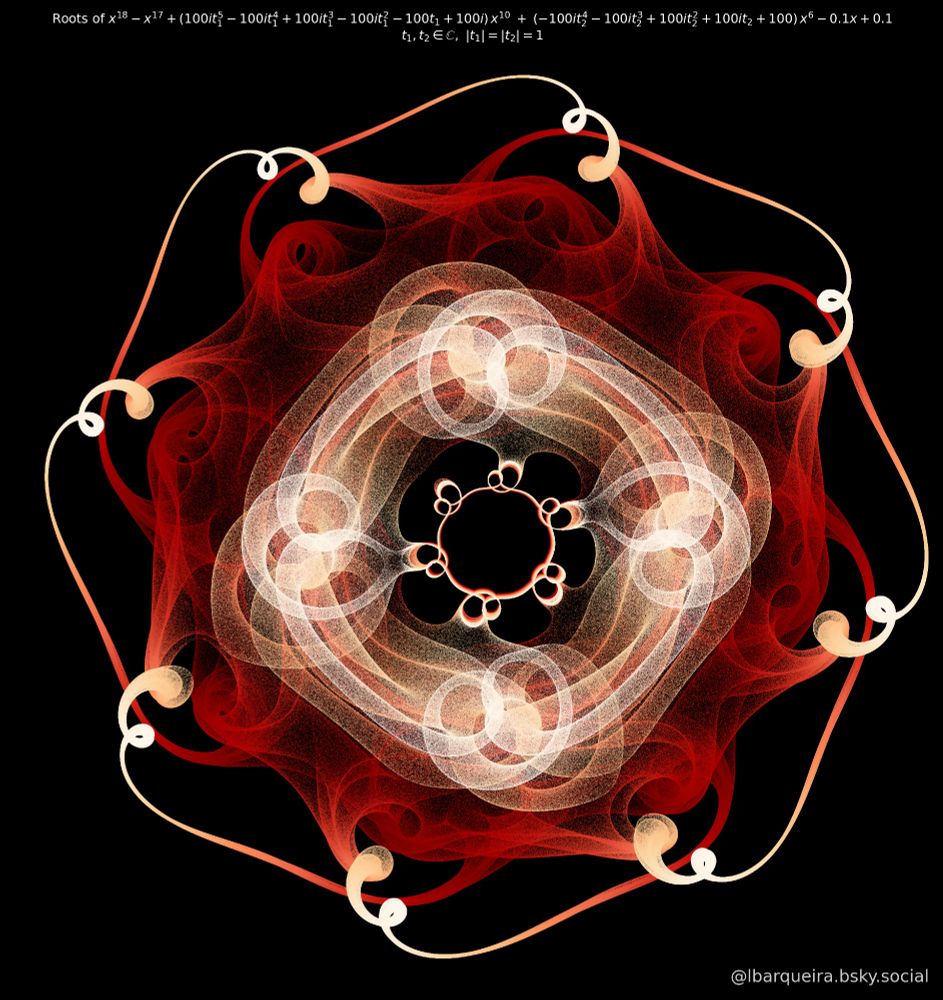
Roots of complex polynomial
Inspired by the work of @sconradi.bsky.social
#MathArt #Python #CodeArt #SciArt #CreativeCoding #Math
Inspired by the work of @sconradi.bsky.social
#MathArt #Python #CodeArt #SciArt #CreativeCoding #Math
August 11, 2025 at 2:14 AM
Roots of complex polynomial
Inspired by the work of @sconradi.bsky.social
#MathArt #Python #CodeArt #SciArt #CreativeCoding #Math
Inspired by the work of @sconradi.bsky.social
#MathArt #Python #CodeArt #SciArt #CreativeCoding #Math

August 8, 2025 at 11:00 PM
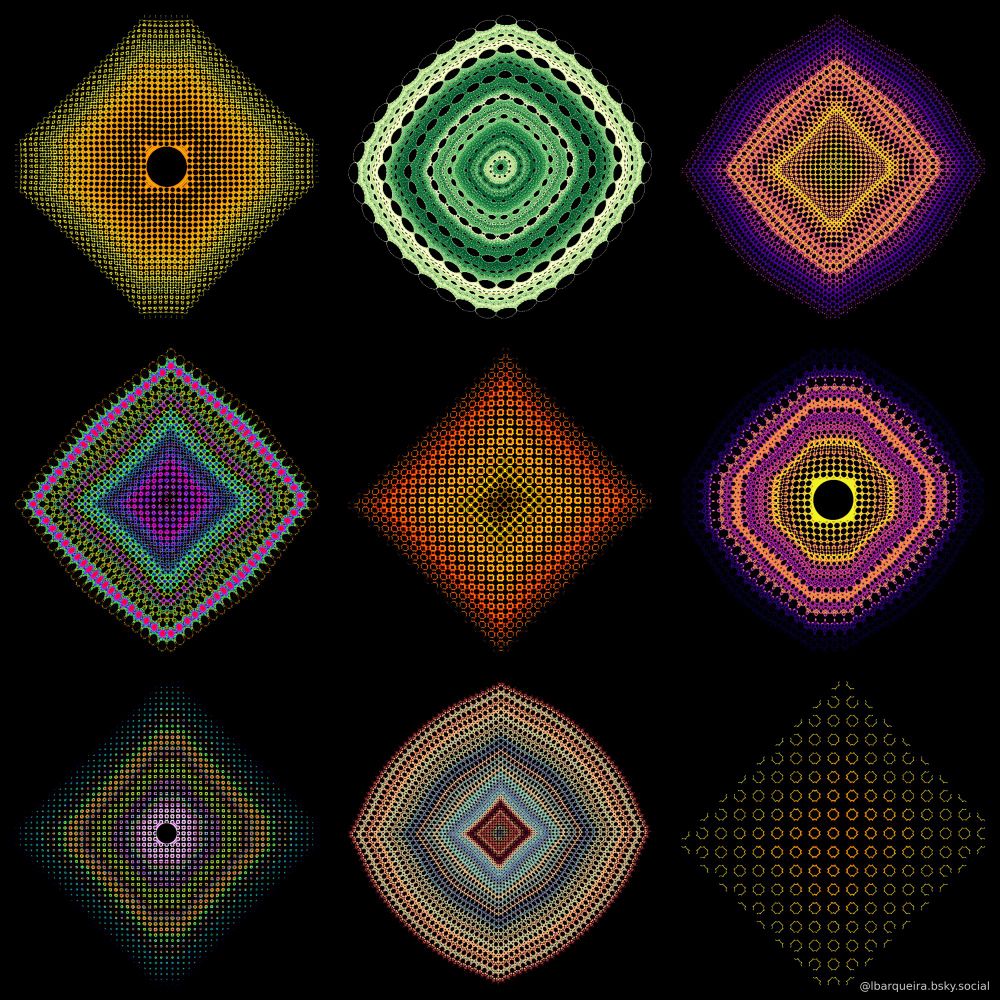

Photo taken by my youngest son of our great bud.
#Photography
#Photography

July 27, 2025 at 8:42 PM
Photo taken by my youngest son of our great bud.
#Photography
#Photography
Visualizing the roots of:
x⁹ + 3x⁷ + (−25𝑖𝑡₂² −25𝑖𝑡₂ +75𝑖)x⁵ −4x −50𝑡₁ −50𝑖
where 𝑡₁, 𝑡₂ are random points on the complex unit circle
750,000 (𝑡₁,𝑡₂) pairs → 6.75 million roots
Color maps Im(𝑡₂) using a psychedelic rainbow gradient
#MathArt #Python #CodeArt #SciArt #CreativeCoding #Math
x⁹ + 3x⁷ + (−25𝑖𝑡₂² −25𝑖𝑡₂ +75𝑖)x⁵ −4x −50𝑡₁ −50𝑖
where 𝑡₁, 𝑡₂ are random points on the complex unit circle
750,000 (𝑡₁,𝑡₂) pairs → 6.75 million roots
Color maps Im(𝑡₂) using a psychedelic rainbow gradient
#MathArt #Python #CodeArt #SciArt #CreativeCoding #Math

July 25, 2025 at 12:55 AM
Visualizing roots of::
(-15i·t₂² -15i·t₂ +15i)x⁷ + 3x⁶ -100t₁ -100i
where t₁, t₂ are complex numbers with |tⱼ|=1.
Key to the plot:
• ↔️ x/y: Root's real/imaginary parts
• ↕️ z: Imaginary part of t₂
• 🔵→🔴 Colors: Im(t₂) from -1 (blue) to +1 (red)
#MathArt #Python #CodeArt #SciArt #CreativeCoding #Math
(-15i·t₂² -15i·t₂ +15i)x⁷ + 3x⁶ -100t₁ -100i
where t₁, t₂ are complex numbers with |tⱼ|=1.
Key to the plot:
• ↔️ x/y: Root's real/imaginary parts
• ↕️ z: Imaginary part of t₂
• 🔵→🔴 Colors: Im(t₂) from -1 (blue) to +1 (red)
#MathArt #Python #CodeArt #SciArt #CreativeCoding #Math

July 22, 2025 at 7:32 PM
3D visualization shows the complex roots of:
10x¹⁸ - 10x¹⁷ + (3200t₂⁶-4800t₂⁴+1800t₂²-100)x⁸ + (200t₁³-100)x⁷ - 10x + 10
where t₁,t₂ are complex numbers on the unit circle.
Colors represent Im(t₂) ≥ 0
Inspired by the work of @sconradi.bsky.social
#MathArt #Python #CodeArt #BlueskyArt #SciArt
10x¹⁸ - 10x¹⁷ + (3200t₂⁶-4800t₂⁴+1800t₂²-100)x⁸ + (200t₁³-100)x⁷ - 10x + 10
where t₁,t₂ are complex numbers on the unit circle.
Colors represent Im(t₂) ≥ 0
Inspired by the work of @sconradi.bsky.social
#MathArt #Python #CodeArt #BlueskyArt #SciArt


July 20, 2025 at 9:08 PM
3D visualization shows the complex roots of:
10x¹⁸ - 10x¹⁷ + (3200t₂⁶-4800t₂⁴+1800t₂²-100)x⁸ + (200t₁³-100)x⁷ - 10x + 10
where t₁,t₂ are complex numbers on the unit circle.
Colors represent Im(t₂) ≥ 0
Inspired by the work of @sconradi.bsky.social
#MathArt #Python #CodeArt #BlueskyArt #SciArt
10x¹⁸ - 10x¹⁷ + (3200t₂⁶-4800t₂⁴+1800t₂²-100)x⁸ + (200t₁³-100)x⁷ - 10x + 10
where t₁,t₂ are complex numbers on the unit circle.
Colors represent Im(t₂) ≥ 0
Inspired by the work of @sconradi.bsky.social
#MathArt #Python #CodeArt #BlueskyArt #SciArt

July 12, 2025 at 9:45 PM
3D plot of the roots of a random family of quartic polynomials with complex coefficients on the unit circle.
The z-axis and color both encode the phase of 𝑡2.
Inspired by @sconradi.bsky.social work.
#MathArt #Python #CodeArt #BlueskyArt #SciArt
The z-axis and color both encode the phase of 𝑡2.
Inspired by @sconradi.bsky.social work.
#MathArt #Python #CodeArt #BlueskyArt #SciArt


July 10, 2025 at 9:59 AM
3D plot of the roots of a random family of quartic polynomials with complex coefficients on the unit circle.
The z-axis and color both encode the phase of 𝑡2.
Inspired by @sconradi.bsky.social work.
#MathArt #Python #CodeArt #BlueskyArt #SciArt
The z-axis and color both encode the phase of 𝑡2.
Inspired by @sconradi.bsky.social work.
#MathArt #Python #CodeArt #BlueskyArt #SciArt
4000 Line Segments - Symmetry from Nested Sine Waves
Each segment’s position is controlled by layered trigonometric functions.
#MathArt #Python #CodeArt #BlueskyArt #SciArt #CreativeCoding #GenerativeArt
Each segment’s position is controlled by layered trigonometric functions.
#MathArt #Python #CodeArt #BlueskyArt #SciArt #CreativeCoding #GenerativeArt

July 1, 2025 at 10:17 PM
4000 Line Segments - Symmetry from Nested Sine Waves
Each segment’s position is controlled by layered trigonometric functions.
#MathArt #Python #CodeArt #BlueskyArt #SciArt #CreativeCoding #GenerativeArt
Each segment’s position is controlled by layered trigonometric functions.
#MathArt #Python #CodeArt #BlueskyArt #SciArt #CreativeCoding #GenerativeArt
4000 Line Segments from Trig Functions
#MathArt #Python #CodeArt #BlueskyArt #SciArt #CreativeCoding #Math
#MathArt #Python #CodeArt #BlueskyArt #SciArt #CreativeCoding #Math

June 28, 2025 at 10:53 PM
4000 Line Segments from Trig Functions
#MathArt #Python #CodeArt #BlueskyArt #SciArt #CreativeCoding #Math
#MathArt #Python #CodeArt #BlueskyArt #SciArt #CreativeCoding #Math
Mathematical symmetry. N = 14.000 circles generated by:
X = cos(10πk/N)(1−0.5cos²(16πk/N))
Y = sin(10πk/N)(1−0.5cos²(16πk/N))
Radius = 1/250 + 0.08sin⁴(52πk/N)
#Python #MathArt #SciArt #CreativeCoding #Math
X = cos(10πk/N)(1−0.5cos²(16πk/N))
Y = sin(10πk/N)(1−0.5cos²(16πk/N))
Radius = 1/250 + 0.08sin⁴(52πk/N)
#Python #MathArt #SciArt #CreativeCoding #Math

June 21, 2025 at 11:05 PM
Mathematical symmetry. N = 14.000 circles generated by:
X = cos(10πk/N)(1−0.5cos²(16πk/N))
Y = sin(10πk/N)(1−0.5cos²(16πk/N))
Radius = 1/250 + 0.08sin⁴(52πk/N)
#Python #MathArt #SciArt #CreativeCoding #Math
X = cos(10πk/N)(1−0.5cos²(16πk/N))
Y = sin(10πk/N)(1−0.5cos²(16πk/N))
Radius = 1/250 + 0.08sin⁴(52πk/N)
#Python #MathArt #SciArt #CreativeCoding #Math
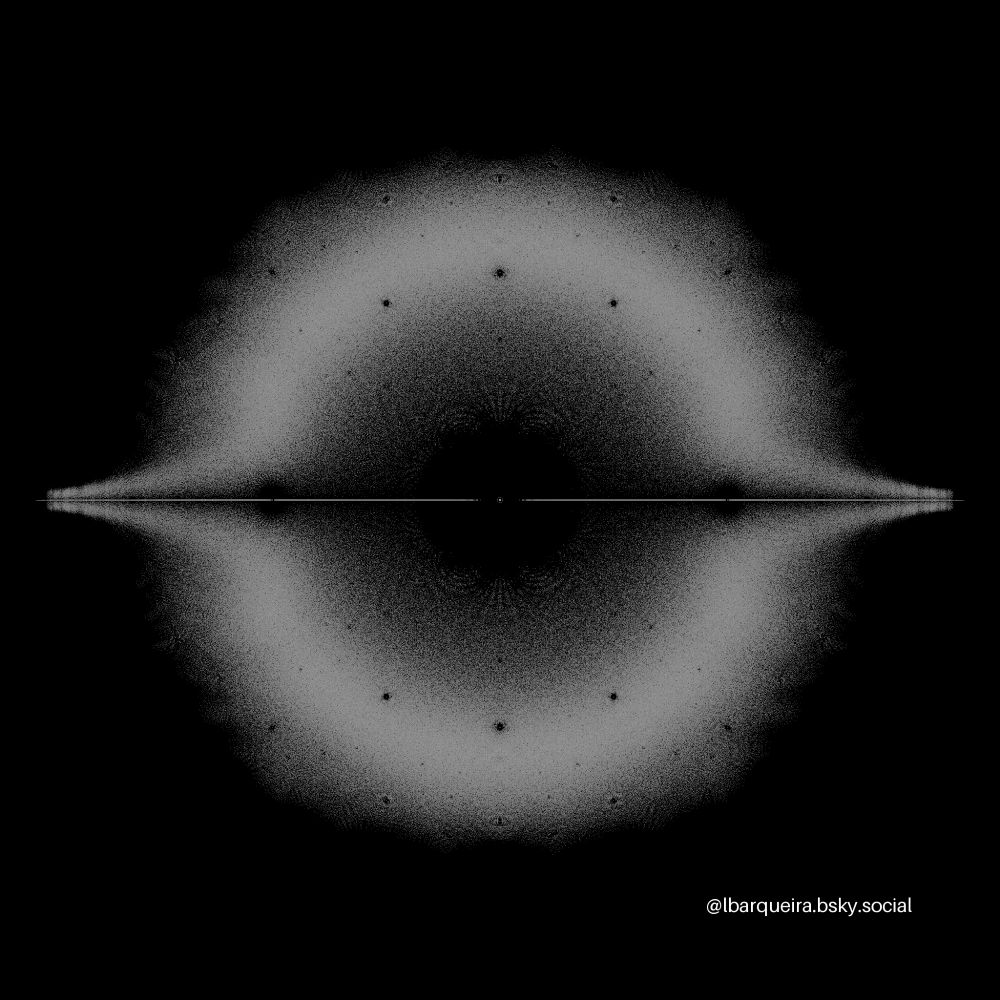
Visualizing a 9th-Degree Polynomial
x⁹ + (-50i·t₁³ -50·t₁² +50i·t₁ +50)x⁵ - 4·x + 50i·t₂³ + 50i·t₂² + 50i·t₂ + 50i
1 million parameter pairs → 9 million roots
Color: Root density (hot = frequent, black = rare)
#Python #MathArt #SciArt #CreativeCoding #Math
x⁹ + (-50i·t₁³ -50·t₁² +50i·t₁ +50)x⁵ - 4·x + 50i·t₂³ + 50i·t₂² + 50i·t₂ + 50i
1 million parameter pairs → 9 million roots
Color: Root density (hot = frequent, black = rare)
#Python #MathArt #SciArt #CreativeCoding #Math

June 20, 2025 at 10:16 PM
Visualizing a 9th-Degree Polynomial
x⁹ + (-50i·t₁³ -50·t₁² +50i·t₁ +50)x⁵ - 4·x + 50i·t₂³ + 50i·t₂² + 50i·t₂ + 50i
1 million parameter pairs → 9 million roots
Color: Root density (hot = frequent, black = rare)
#Python #MathArt #SciArt #CreativeCoding #Math
x⁹ + (-50i·t₁³ -50·t₁² +50i·t₁ +50)x⁵ - 4·x + 50i·t₂³ + 50i·t₂² + 50i·t₂ + 50i
1 million parameter pairs → 9 million roots
Color: Root density (hot = frequent, black = rare)
#Python #MathArt #SciArt #CreativeCoding #Math
Plotting 52M roots of a 13th-Degree Polynomial:
(-100𝑖·𝑡₂² + 100·𝑡₂ − 100𝑖)𝑥¹³ − 100𝑖·𝑡₁² − 100𝑖·𝑡₁ − 100
Where:
𝑡₁, 𝑡₂ are random points on the complex unit circle (|𝑡₁|=|𝑡₂|=1)
Each of 4M (𝑡₁,𝑡₂) pairs generates 13 roots in ℂ
#Python #MathArt #SciArt #CreativeCoding #Math
(-100𝑖·𝑡₂² + 100·𝑡₂ − 100𝑖)𝑥¹³ − 100𝑖·𝑡₁² − 100𝑖·𝑡₁ − 100
Where:
𝑡₁, 𝑡₂ are random points on the complex unit circle (|𝑡₁|=|𝑡₂|=1)
Each of 4M (𝑡₁,𝑡₂) pairs generates 13 roots in ℂ
#Python #MathArt #SciArt #CreativeCoding #Math

June 18, 2025 at 9:47 PM
Plotting 52M roots of a 13th-Degree Polynomial:
(-100𝑖·𝑡₂² + 100·𝑡₂ − 100𝑖)𝑥¹³ − 100𝑖·𝑡₁² − 100𝑖·𝑡₁ − 100
Where:
𝑡₁, 𝑡₂ are random points on the complex unit circle (|𝑡₁|=|𝑡₂|=1)
Each of 4M (𝑡₁,𝑡₂) pairs generates 13 roots in ℂ
#Python #MathArt #SciArt #CreativeCoding #Math
(-100𝑖·𝑡₂² + 100·𝑡₂ − 100𝑖)𝑥¹³ − 100𝑖·𝑡₁² − 100𝑖·𝑡₁ − 100
Where:
𝑡₁, 𝑡₂ are random points on the complex unit circle (|𝑡₁|=|𝑡₂|=1)
Each of 4M (𝑡₁,𝑡₂) pairs generates 13 roots in ℂ
#Python #MathArt #SciArt #CreativeCoding #Math
Eigenvalue density of 12×12 centrosymmetric doubly companion matrices. Where matrix has: subdiagonal = 1, first row entries: −αₖ where αₖ ∈ {−1, 0, 1}, last column entries: −αₖ
1M samples, coefficients: {−1, 0, 1}, view: [−2.2−2.2𝑖, 2.2+2.2𝑖]
#Python #MathArt #SciArt #CreativeCoding #Math
1M samples, coefficients: {−1, 0, 1}, view: [−2.2−2.2𝑖, 2.2+2.2𝑖]
#Python #MathArt #SciArt #CreativeCoding #Math
June 14, 2025 at 10:25 PM
Eigenvalue density of 12×12 centrosymmetric doubly companion matrices. Where matrix has: subdiagonal = 1, first row entries: −αₖ where αₖ ∈ {−1, 0, 1}, last column entries: −αₖ
1M samples, coefficients: {−1, 0, 1}, view: [−2.2−2.2𝑖, 2.2+2.2𝑖]
#Python #MathArt #SciArt #CreativeCoding #Math
1M samples, coefficients: {−1, 0, 1}, view: [−2.2−2.2𝑖, 2.2+2.2𝑖]
#Python #MathArt #SciArt #CreativeCoding #Math
Density plot of eigenvalues from 2M randomly generated 11×11 upper Hessenberg Toeplitz matrices.
Each matrix has: 0 diagonal, −1 subdiagonal, upper entries randomly drawn from {±1, ±𝑖} (the 4th roots of unity). The color represents eigenvalue density.
#Python #MathArt #SciArt #CreativeCoding #Math
Each matrix has: 0 diagonal, −1 subdiagonal, upper entries randomly drawn from {±1, ±𝑖} (the 4th roots of unity). The color represents eigenvalue density.
#Python #MathArt #SciArt #CreativeCoding #Math

June 12, 2025 at 10:45 PM
Density plot of eigenvalues from 2M randomly generated 11×11 upper Hessenberg Toeplitz matrices.
Each matrix has: 0 diagonal, −1 subdiagonal, upper entries randomly drawn from {±1, ±𝑖} (the 4th roots of unity). The color represents eigenvalue density.
#Python #MathArt #SciArt #CreativeCoding #Math
Each matrix has: 0 diagonal, −1 subdiagonal, upper entries randomly drawn from {±1, ±𝑖} (the 4th roots of unity). The color represents eigenvalue density.
#Python #MathArt #SciArt #CreativeCoding #Math
Density plot of eigenvalues from 1 million 10×10 tridiagonal matrices w/ entries randomly chosen from {0, ±1, ±i, ±10, ±10i, ±20, ±20i}. viewing window is [-48-48i, 48+48i]. The color represents eigenvalue density.
#Python #MathArt #SciArt #CreativeCoding #Mathematics
#Python #MathArt #SciArt #CreativeCoding #Mathematics
June 10, 2025 at 11:20 PM
Density plot of eigenvalues from 1 million 10×10 tridiagonal matrices w/ entries randomly chosen from {0, ±1, ±i, ±10, ±10i, ±20, ±20i}. viewing window is [-48-48i, 48+48i]. The color represents eigenvalue density.
#Python #MathArt #SciArt #CreativeCoding #Mathematics
#Python #MathArt #SciArt #CreativeCoding #Mathematics
Reposted by barqueira

Update to the #MathArt starter pack - it comes now with several more, great, stunning #Math artists. Be sure to follow all of them, please spread the word, and let me know if you have further suggestions!
go.bsky.app/CiKwTsg
go.bsky.app/CiKwTsg
June 2, 2025 at 12:16 PM
Update to the #MathArt starter pack - it comes now with several more, great, stunning #Math artists. Be sure to follow all of them, please spread the word, and let me know if you have further suggestions!
go.bsky.app/CiKwTsg
go.bsky.app/CiKwTsg
Eigenvalue density plot in the complex plane from 1.5M Bohemian 20×20 tridiagonal matrices (entries in {0, ±(1+1i)/√2, ±(1−1i)/√2}). Color shows eigenvalue density over [−2.5−2.5i, 2.5+2.5i]. Inspired by Robert Corless
#Python #MathArt #SciArt #CreativeCoding #Mathematics
#Python #MathArt #SciArt #CreativeCoding #Mathematics

June 9, 2025 at 11:15 PM
Eigenvalue density plot in the complex plane from 1.5M Bohemian 20×20 tridiagonal matrices (entries in {0, ±(1+1i)/√2, ±(1−1i)/√2}). Color shows eigenvalue density over [−2.5−2.5i, 2.5+2.5i]. Inspired by Robert Corless
#Python #MathArt #SciArt #CreativeCoding #Mathematics
#Python #MathArt #SciArt #CreativeCoding #Mathematics
Eigenvalue density plot of 15 million 6×6 companion matrices, where the last column is filled with complex numbers of the form 2 * r * exp(iθ) - 1, with r drawn from a Beta(0.01, 0.01) distribution and fixed angle θ = 0.
#Python #MathArt #SciArt #CreativeCoding #Mathematics
#Python #MathArt #SciArt #CreativeCoding #Mathematics

June 7, 2025 at 10:05 PM
Eigenvalue density plot of 15 million 6×6 companion matrices, where the last column is filled with complex numbers of the form 2 * r * exp(iθ) - 1, with r drawn from a Beta(0.01, 0.01) distribution and fixed angle θ = 0.
#Python #MathArt #SciArt #CreativeCoding #Mathematics
#Python #MathArt #SciArt #CreativeCoding #Mathematics
Eigenvalue density plot of 20 million 15×15 circulant matrices, where each matrix is generated with entries from the set {−1, 0, 1}. The plot shows the complex eigenvalues over the region [−0.5−0.5i, 0.5+0.5i].
#Python #MathArt #SciArt #CreativeCoding #Mathematics
#Python #MathArt #SciArt #CreativeCoding #Mathematics

June 5, 2025 at 11:17 PM
Eigenvalue density plot of 20 million 15×15 circulant matrices, where each matrix is generated with entries from the set {−1, 0, 1}. The plot shows the complex eigenvalues over the region [−0.5−0.5i, 0.5+0.5i].
#Python #MathArt #SciArt #CreativeCoding #Mathematics
#Python #MathArt #SciArt #CreativeCoding #Mathematics
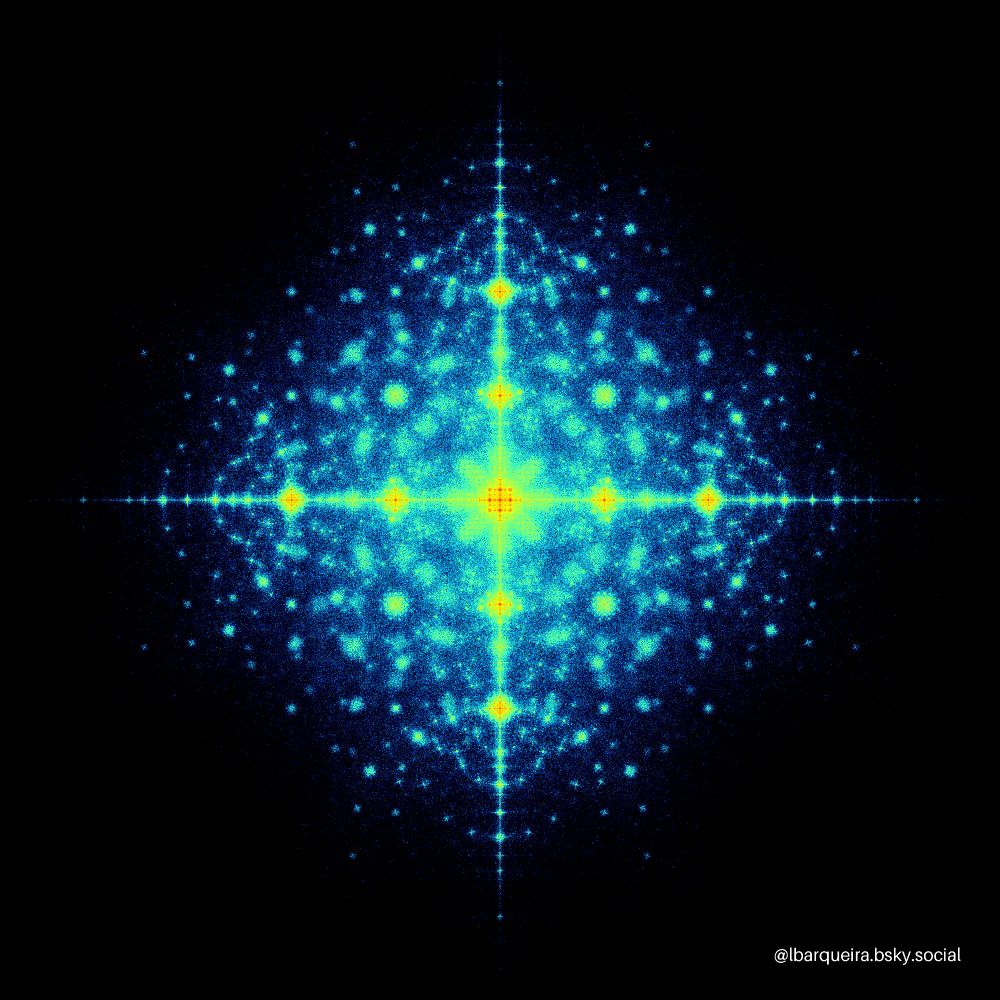
Eigenvalue density from random skew-symmetric tridiagonal 20×20 matrices with entries from {1±i}. Density shown with ocean colormap. Brighter = more eigenvalues.
Credits and inspiration: Rob Corless
#Python #MathArt #SciArt #CreativeCoding #Mathematics
Credits and inspiration: Rob Corless
#Python #MathArt #SciArt #CreativeCoding #Mathematics

June 3, 2025 at 10:31 PM
Eigenvalue density from random skew-symmetric tridiagonal 20×20 matrices with entries from {1±i}. Density shown with ocean colormap. Brighter = more eigenvalues.
Credits and inspiration: Rob Corless
#Python #MathArt #SciArt #CreativeCoding #Mathematics
Credits and inspiration: Rob Corless
#Python #MathArt #SciArt #CreativeCoding #Mathematics