


Johnny
@johnnyfreitag.bsky.social
Product, Design, Dev / Born @ 350ppm / SolarPunk🍃 / Degrowth advocate / Eco-populist
Hot take: Apple introducing this whole new UI system and at the same time time cluttering the system settings with various options to undo this new look is an indication of how lost their design and product teams are.

September 16, 2025 at 1:31 PM
Hot take: Apple introducing this whole new UI system and at the same time time cluttering the system settings with various options to undo this new look is an indication of how lost their design and product teams are.


February 21, 2025 at 6:47 PM
Third term President, secured.

February 2, 2025 at 3:54 PM
Third term President, secured.
5/n
Assuming that the recent acceleration in warming is NOT due to reductions in aerosol emissions, we get can apply a slightly sloping curve. That would land us at about ~2.1°C.
Assuming that the recent acceleration in warming is NOT due to reductions in aerosol emissions, we get can apply a slightly sloping curve. That would land us at about ~2.1°C.

January 28, 2025 at 9:10 AM
5/n
Assuming that the recent acceleration in warming is NOT due to reductions in aerosol emissions, we get can apply a slightly sloping curve. That would land us at about ~2.1°C.
Assuming that the recent acceleration in warming is NOT due to reductions in aerosol emissions, we get can apply a slightly sloping curve. That would land us at about ~2.1°C.
4/n
Assuming a close to linear temperature trend lands us pretty much at 2°C.
Assuming a close to linear temperature trend lands us pretty much at 2°C.

January 28, 2025 at 9:10 AM
4/n
Assuming a close to linear temperature trend lands us pretty much at 2°C.
Assuming a close to linear temperature trend lands us pretty much at 2°C.
3/n
We'll then assume that SO2 emissions were insignificant, meaning that warming could progress unabated. No changes to our CO2 emissions assumptions, so we can simply shift the curve left to close the gap:
We'll then assume that SO2 emissions were insignificant, meaning that warming could progress unabated. No changes to our CO2 emissions assumptions, so we can simply shift the curve left to close the gap:

January 28, 2025 at 9:10 AM
3/n
We'll then assume that SO2 emissions were insignificant, meaning that warming could progress unabated. No changes to our CO2 emissions assumptions, so we can simply shift the curve left to close the gap:
We'll then assume that SO2 emissions were insignificant, meaning that warming could progress unabated. No changes to our CO2 emissions assumptions, so we can simply shift the curve left to close the gap:
2/n
For this, we'll use the most up to date ensemble chart for global average temperatures. Luckily, a good soul has provided a cutting edge graph for Wikipedia: en.wikipedia.org/wiki/Tempera...
First step: We'll remove source labels and extend the scale to 2,5°C.
For this, we'll use the most up to date ensemble chart for global average temperatures. Luckily, a good soul has provided a cutting edge graph for Wikipedia: en.wikipedia.org/wiki/Tempera...
First step: We'll remove source labels and extend the scale to 2,5°C.

January 28, 2025 at 9:10 AM
2/n
For this, we'll use the most up to date ensemble chart for global average temperatures. Luckily, a good soul has provided a cutting edge graph for Wikipedia: en.wikipedia.org/wiki/Tempera...
First step: We'll remove source labels and extend the scale to 2,5°C.
For this, we'll use the most up to date ensemble chart for global average temperatures. Luckily, a good soul has provided a cutting edge graph for Wikipedia: en.wikipedia.org/wiki/Tempera...
First step: We'll remove source labels and extend the scale to 2,5°C.
- Puts hobby scientist hat on -
Circled in red: downstream pathologies of excess omega 6 linoleic acid consumption.
#GLP-1 agonists are very efficient at addressing those, apparently.
Or people could just stop eating soybean and sunflower oil.
Circled in red: downstream pathologies of excess omega 6 linoleic acid consumption.
#GLP-1 agonists are very efficient at addressing those, apparently.
Or people could just stop eating soybean and sunflower oil.

January 26, 2025 at 4:06 PM
- Puts hobby scientist hat on -
Circled in red: downstream pathologies of excess omega 6 linoleic acid consumption.
#GLP-1 agonists are very efficient at addressing those, apparently.
Or people could just stop eating soybean and sunflower oil.
Circled in red: downstream pathologies of excess omega 6 linoleic acid consumption.
#GLP-1 agonists are very efficient at addressing those, apparently.
Or people could just stop eating soybean and sunflower oil.
Chapter 1 in Timothy Snyder‘s book „on tyranny“.

January 10, 2025 at 8:05 PM
Chapter 1 in Timothy Snyder‘s book „on tyranny“.
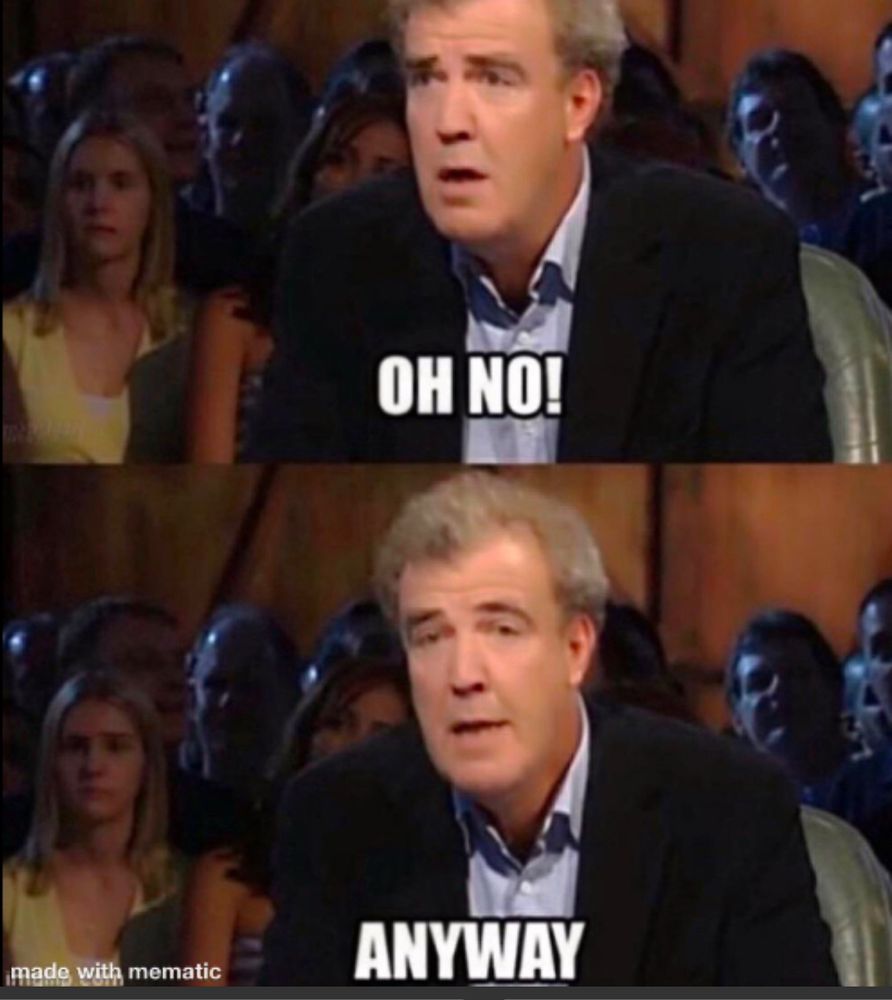
Bluesky going through the motions and I am all here for it

November 21, 2024 at 9:39 AM
Bluesky going through the motions and I am all here for it