


John Alexis Guerra Gomez
@johnguerra.bsky.social
Associate Teaching Professor Northeastern University, KhouryVis member
Research on #dataviz #a11y
Co-creator https://btactile.com https://navio.dev https://duto.org
https://johnguerra.co
Research on #dataviz #a11y
Co-creator https://btactile.com https://navio.dev https://duto.org
https://johnguerra.co
My #IEEEVIS 2025 paper explorer is live! 🎉
👉 johnguerra.co/viz/ieeevis2... 👈
An interactive #dataviz to explore 300+ papers by similarity. Perfect for:
✨ Discovering papers related to your interests
✨ Planning which sessions to attend
✨ Creating your own paper list (new!)
Pls help me distribute it
👉 johnguerra.co/viz/ieeevis2... 👈
An interactive #dataviz to explore 300+ papers by similarity. Perfect for:
✨ Discovering papers related to your interests
✨ Planning which sessions to attend
✨ Creating your own paper list (new!)
Pls help me distribute it
November 2, 2025 at 1:28 PM
My #IEEEVIS 2025 paper explorer is live! 🎉
👉 johnguerra.co/viz/ieeevis2... 👈
An interactive #dataviz to explore 300+ papers by similarity. Perfect for:
✨ Discovering papers related to your interests
✨ Planning which sessions to attend
✨ Creating your own paper list (new!)
Pls help me distribute it
👉 johnguerra.co/viz/ieeevis2... 👈
An interactive #dataviz to explore 300+ papers by similarity. Perfect for:
✨ Discovering papers related to your interests
✨ Planning which sessions to attend
✨ Creating your own paper list (new!)
Pls help me distribute it
To help me keep track of the #chi2025 papers that I don't want to miss I made this quick prototype:
👉🏼 johnguerra.co/viz/chi2025P... 👈🏼
* Search by semantic content
* Aggregate multiple searches
* Find papers by authors, institutions, types, awards...
* Quickly check where to go from your 📲
👉🏼 johnguerra.co/viz/chi2025P... 👈🏼
* Search by semantic content
* Aggregate multiple searches
* Find papers by authors, institutions, types, awards...
* Quickly check where to go from your 📲
April 26, 2025 at 3:12 AM
To help me keep track of the #chi2025 papers that I don't want to miss I made this quick prototype:
👉🏼 johnguerra.co/viz/chi2025P... 👈🏼
* Search by semantic content
* Aggregate multiple searches
* Find papers by authors, institutions, types, awards...
* Quickly check where to go from your 📲
👉🏼 johnguerra.co/viz/chi2025P... 👈🏼
* Search by semantic content
* Aggregate multiple searches
* Find papers by authors, institutions, types, awards...
* Quickly check where to go from your 📲
Here is my #chi2025 paper explorer. Visually explore papers by similarity, search for an specific topic or even find what specific sessions to attend. Please let me know what you think! #dataviz @chi.acm.org
👉🏼 johnguerra.co/viz/chi2025P... 👈🏼
👉🏼 johnguerra.co/viz/chi2025P... 👈🏼
April 16, 2025 at 2:22 PM
Here is my #chi2025 paper explorer. Visually explore papers by similarity, search for an specific topic or even find what specific sessions to attend. Please let me know what you think! #dataviz @chi.acm.org
👉🏼 johnguerra.co/viz/chi2025P... 👈🏼
👉🏼 johnguerra.co/viz/chi2025P... 👈🏼
Many kudos to the vispubdata.org team for keeping the dataset up to date. As a thank you note, here is how easy it is to build the impressive @drpi.bsky.social's 2.5 @ieeevis.bsky.social ego-network of co-authorships:
🙏🏻 johnguerra.co/viz/visPubNe...
2/2
🙏🏻 johnguerra.co/viz/visPubNe...
2/2
March 29, 2025 at 3:40 PM
Many kudos to the vispubdata.org team for keeping the dataset up to date. As a thank you note, here is how easy it is to build the impressive @drpi.bsky.social's 2.5 @ieeevis.bsky.social ego-network of co-authorships:
🙏🏻 johnguerra.co/viz/visPubNe...
2/2
🙏🏻 johnguerra.co/viz/visPubNe...
2/2
Do you want to explore your own @ieeevis.bsky.social co-authors and citations networks? Check out my latest #dataviz
👉🏼 johnguerra.co/viz/visPubNe... 👈🏼
I'm showing the @northeasternu.bsky.social VIS Lab professors network, and the overall authors with more than 20 collaborations. Create your own!
👉🏼 johnguerra.co/viz/visPubNe... 👈🏼
I'm showing the @northeasternu.bsky.social VIS Lab professors network, and the overall authors with more than 20 collaborations. Create your own!
March 29, 2025 at 3:40 PM
Do you want to explore your own @ieeevis.bsky.social co-authors and citations networks? Check out my latest #dataviz
👉🏼 johnguerra.co/viz/visPubNe... 👈🏼
I'm showing the @northeasternu.bsky.social VIS Lab professors network, and the overall authors with more than 20 collaborations. Create your own!
👉🏼 johnguerra.co/viz/visPubNe... 👈🏼
I'm showing the @northeasternu.bsky.social VIS Lab professors network, and the overall authors with more than 20 collaborations. Create your own!
In minutes I'll be starting my talk Interactive Information Visualization: Unleashing the Power of Visual Data Exploration at the #RiceVCS
Please check my slides for tons of links here johnguerra.co/viz/slides/I...
Please check my slides for tons of links here johnguerra.co/viz/slides/I...

March 7, 2025 at 3:06 PM
In minutes I'll be starting my talk Interactive Information Visualization: Unleashing the Power of Visual Data Exploration at the #RiceVCS
Please check my slides for tons of links here johnguerra.co/viz/slides/I...
Please check my slides for tons of links here johnguerra.co/viz/slides/I...
📢 Shout-out for @northeasternu.bsky.social Michelle Borking's research at the #RiceVCS 👏👏👏

March 6, 2025 at 3:55 PM
📢 Shout-out for @northeasternu.bsky.social Michelle Borking's research at the #RiceVCS 👏👏👏
Do you want to animate a @vega-vis.bsky.social vega-lite or @observablehq.com Plot chart? Here is a quick experiment that might help you that animates between two SVGs.
Let me know what you think! #dataviz.
👉🏼 observablehq.com/@john-guerra...
Let me know what you think! #dataviz.
👉🏼 observablehq.com/@john-guerra...
February 26, 2025 at 6:45 PM
Do you want to animate a @vega-vis.bsky.social vega-lite or @observablehq.com Plot chart? Here is a quick experiment that might help you that animates between two SVGs.
Let me know what you think! #dataviz.
👉🏼 observablehq.com/@john-guerra...
Let me know what you think! #dataviz.
👉🏼 observablehq.com/@john-guerra...
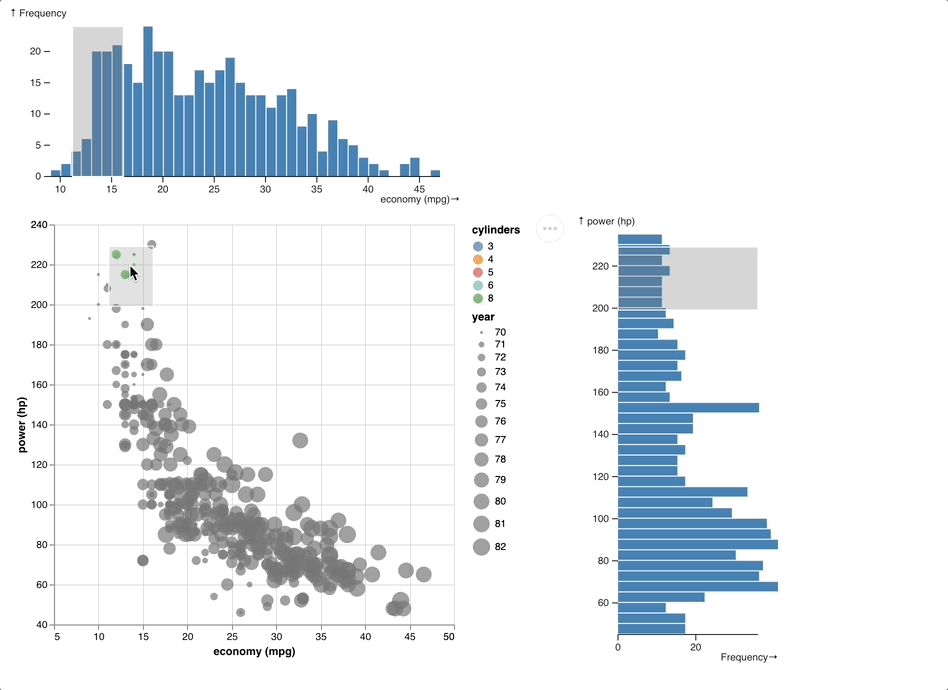
How many attributes can you visualize in one chart? A little experiment on multi dimensional #dataviz that I made for a talk
👉🏼 observablehq.com/@john-guerra...
👉🏼 observablehq.com/@john-guerra...
February 26, 2025 at 12:32 AM
How many attributes can you visualize in one chart? A little experiment on multi dimensional #dataviz that I made for a talk
👉🏼 observablehq.com/@john-guerra...
👉🏼 observablehq.com/@john-guerra...
One of my students wanted to use an online image on her page. I challenged her to recreate it with code... and couldn't resist doing my own #generativeArt experiment 😝
observablehq.com/@john-guerra...
observablehq.com/@john-guerra...
January 26, 2025 at 3:59 PM
One of my students wanted to use an online image on her page. I challenged her to recreate it with code... and couldn't resist doing my own #generativeArt experiment 😝
observablehq.com/@john-guerra...
observablehq.com/@john-guerra...
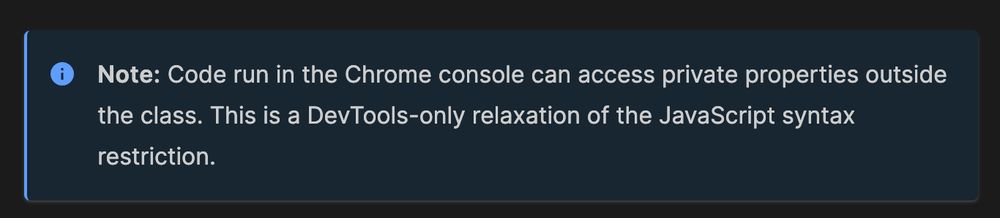
Good catch!, it is actually explained in the MDN documentation:
"Note: Code run in the Chrome console can access private properties outside the class. This is a DevTools-only relaxation of the JavaScript syntax restriction."
developer.mozilla.org/en-US/docs/W...
"Note: Code run in the Chrome console can access private properties outside the class. This is a DevTools-only relaxation of the JavaScript syntax restriction."
developer.mozilla.org/en-US/docs/W...
January 16, 2025 at 6:12 PM
Good catch!, it is actually explained in the MDN documentation:
"Note: Code run in the Chrome console can access private properties outside the class. This is a DevTools-only relaxation of the JavaScript syntax restriction."
developer.mozilla.org/en-US/docs/W...
"Note: Code run in the Chrome console can access private properties outside the class. This is a DevTools-only relaxation of the JavaScript syntax restriction."
developer.mozilla.org/en-US/docs/W...
I love #d3js force network visualizations, but usually with larger networks nodes tend to go all over the place. Here is a simple auto-fit trick that you can use to keep all nodes in view:
👉🏼 observablehq.com/@john-guerra...
#dataviz @observablehq.com
👉🏼 observablehq.com/@john-guerra...
#dataviz @observablehq.com

December 3, 2024 at 8:19 PM
I love #d3js force network visualizations, but usually with larger networks nodes tend to go all over the place. Here is a simple auto-fit trick that you can use to keep all nodes in view:
👉🏼 observablehq.com/@john-guerra...
#dataviz @observablehq.com
👉🏼 observablehq.com/@john-guerra...
#dataviz @observablehq.com
Heading to #Neurips2024 and feeling overwhelmed by the 4k+ papers? 🤯 Check out my paper explorer! Just enter your query and find related papers instantly using sentence embeddings and dimensionality reduction. #dataviz
👉🏼https://johnguerra.co/viz/neurips2024Papers/👈🏼
👉🏼https://johnguerra.co/viz/neurips2024Papers/👈🏼

December 1, 2024 at 4:21 PM
Heading to #Neurips2024 and feeling overwhelmed by the 4k+ papers? 🤯 Check out my paper explorer! Just enter your query and find related papers instantly using sentence embeddings and dimensionality reduction. #dataviz
👉🏼https://johnguerra.co/viz/neurips2024Papers/👈🏼
👉🏼https://johnguerra.co/viz/neurips2024Papers/👈🏼
My #dataviz library, smart-labels, now supports keeping labels always visible, with options for prioritizing by font size:
www.npmjs.com/package/smar...
Here's a work-in-progress network visualization of collaborations within the Northeastern Vis group.
www.npmjs.com/package/smar...
Here's a work-in-progress network visualization of collaborations within the Northeastern Vis group.

November 21, 2024 at 8:51 PM
My #dataviz library, smart-labels, now supports keeping labels always visible, with options for prioritizing by font size:
www.npmjs.com/package/smar...
Here's a work-in-progress network visualization of collaborations within the Northeastern Vis group.
www.npmjs.com/package/smar...
Here's a work-in-progress network visualization of collaborations within the Northeastern Vis group.
I created an interactive co-authorship network #dataviz of @ieeevis.bsky.social researchers
👉🏼 observablehq.com/@john-guerra... 👈🏼
This visualization explores the connections between researchers who have co-authored papers at IEEE VIS 1990-2023
Built with reactivewidgets.org and @observablehq.com
👉🏼 observablehq.com/@john-guerra... 👈🏼
This visualization explores the connections between researchers who have co-authored papers at IEEE VIS 1990-2023
Built with reactivewidgets.org and @observablehq.com
November 21, 2024 at 12:24 AM
I created an interactive co-authorship network #dataviz of @ieeevis.bsky.social researchers
👉🏼 observablehq.com/@john-guerra... 👈🏼
This visualization explores the connections between researchers who have co-authored papers at IEEE VIS 1990-2023
Built with reactivewidgets.org and @observablehq.com
👉🏼 observablehq.com/@john-guerra... 👈🏼
This visualization explores the connections between researchers who have co-authored papers at IEEE VIS 1990-2023
Built with reactivewidgets.org and @observablehq.com
What Language/Database/Platform/AI people work with vs want to work with from the StackOverflow Anual survey.
observablehq.com/@john-guerra...
It seems like we should be learning Zig...
A #dataviz makeover of the original chord diagram (second image)
observablehq.com/@john-guerra...
It seems like we should be learning Zig...
A #dataviz makeover of the original chord diagram (second image)


November 19, 2024 at 1:16 AM
What Language/Database/Platform/AI people work with vs want to work with from the StackOverflow Anual survey.
observablehq.com/@john-guerra...
It seems like we should be learning Zig...
A #dataviz makeover of the original chord diagram (second image)
observablehq.com/@john-guerra...
It seems like we should be learning Zig...
A #dataviz makeover of the original chord diagram (second image)
Using Reactive Widgets (johnguerra/reactiveWidg...) I can quickly build larger applications, like this #CSCW2024 paper explorer were you can browse the 400+ papers by topics and search for your interests.
👉🏼 johnguerra.co/viz/cscw2024... 👈🏼
3/3
👉🏼 johnguerra.co/viz/cscw2024... 👈🏼
3/3

November 16, 2024 at 5:04 PM
Using Reactive Widgets (johnguerra/reactiveWidg...) I can quickly build larger applications, like this #CSCW2024 paper explorer were you can browse the 400+ papers by topics and search for your interests.
👉🏼 johnguerra.co/viz/cscw2024... 👈🏼
3/3
👉🏼 johnguerra.co/viz/cscw2024... 👈🏼
3/3
You can use reactive widgets to speed up your interactive visualization application development, while also facilitating re-usability.
It is also very useful for coordinating views, even if they are written using different libraries. Here's is a simple example synchronizing #vega-lite & #d3js
2/3
It is also very useful for coordinating views, even if they are written using different libraries. Here's is a simple example synchronizing #vega-lite & #d3js
2/3
November 16, 2024 at 5:04 PM
You can use reactive widgets to speed up your interactive visualization application development, while also facilitating re-usability.
It is also very useful for coordinating views, even if they are written using different libraries. Here's is a simple example synchronizing #vega-lite & #d3js
2/3
It is also very useful for coordinating views, even if they are written using different libraries. Here's is a simple example synchronizing #vega-lite & #d3js
2/3
To emphasize that land area is not that important for elections, I created this US election results visualization story johnguerra.co/viz/USElecti... up to 2020 data... Waiting to get access to this year's results
November 12, 2024 at 3:54 PM
To emphasize that land area is not that important for elections, I created this US election results visualization story johnguerra.co/viz/USElecti... up to 2020 data... Waiting to get access to this year's results