


Johanie Fournier
@johaniefournier.bsky.social
Turning Agricultural Data into Insights | R Programming Educator & Ag Data Analyst Expert 🌍📊 with #Rstat | Advocate for Sustainable Agriculture 🌱
https://johaniefournieragr.link/
https://johaniefournieragr.link/
Pinned

Getting Administrative Boundaries with {rgeoboundaries} in R!
YouTube video by Johanie Fournier
youtu.be
I just created a tiny tutorial on {rgeoboundaries}.
How do you find the auto zoom? I'm not sure if I like it or if it's making me dizzy.
#rstats
youtu.be/K5khtyIdnbk
How do you find the auto zoom? I'm not sure if I like it or if it's making me dizzy.
#rstats
youtu.be/K5khtyIdnbk

In my latest post, I explore 30 years of precipitation data and apply machine learning to forecast the next decade comparing:
🔹 Random Forest
🔹 XGBoost
🔹 MARS
Read the full analysis & access the code here 👉 buff.ly/3WE1i6V
#RStats
🔹 Random Forest
🔹 XGBoost
🔹 MARS
Read the full analysis & access the code here 👉 buff.ly/3WE1i6V
#RStats

St. Lawrence Lowlands Precipitation Data: 30-Year Trends Prediction | Johanie Fournier
Freelance Agronomist Doing Data Analysis
buff.ly
May 14, 2025 at 1:06 PM
In my latest post, I explore 30 years of precipitation data and apply machine learning to forecast the next decade comparing:
🔹 Random Forest
🔹 XGBoost
🔹 MARS
Read the full analysis & access the code here 👉 buff.ly/3WE1i6V
#RStats
🔹 Random Forest
🔹 XGBoost
🔹 MARS
Read the full analysis & access the code here 👉 buff.ly/3WE1i6V
#RStats
TyT2025W19: Seismic Events at Mount Vesuvius
Is there a way to not accumulate the data but instead removing the data point each time the year changes?
code: buff.ly/5AXCcW8
#tydytuesday #Rstats
Is there a way to not accumulate the data but instead removing the data point each time the year changes?
code: buff.ly/5AXCcW8
#tydytuesday #Rstats
May 13, 2025 at 4:15 AM
TyT2025W19: Seismic Events at Mount Vesuvius
Is there a way to not accumulate the data but instead removing the data point each time the year changes?
code: buff.ly/5AXCcW8
#tydytuesday #Rstats
Is there a way to not accumulate the data but instead removing the data point each time the year changes?
code: buff.ly/5AXCcW8
#tydytuesday #Rstats
How to Compute a Distance Matrix in R | Quick Tutorial!
How to Compute a Distance Matrix in R | Quick Tutorial!
Want to calculate distances between points in R? Whether you're working with geographic coordinates or numerical data, distance matrices are crucial for clus...
m.youtube.com
May 8, 2025 at 1:19 PM
How to Compute a Distance Matrix in R | Quick Tutorial!
Kriging Made Easy with KrigR's kriging Function in R!

Kriging Made Easy with KrigR's kriging Function in R!
Want to perform downscaling in R with minimal effort? In this video, I’ll show you how to use the kriging function from the KrigR package to disaggregate spa...
m.youtube.com
April 9, 2025 at 4:04 PM
Kriging Made Easy with KrigR's kriging Function in R!


Your browser is up to date
You can use YouTube's latest features!
m.youtube.com
March 26, 2025 at 4:03 PM
La neige joue au yo-yo cette semaine, où est-ce que je passe ma commande pour en avoir dimanche?
March 25, 2025 at 4:50 PM
La neige joue au yo-yo cette semaine, où est-ce que je passe ma commande pour en avoir dimanche?
I'm curious — what do you think is the most effective way to visualize spatio-temporal data?
1) Panel of small multiples
2) Animated map
3) Heat maps
4) Interactive map with a window slider
Let me know in the comments if you want examples of each!
#Rstats
1) Panel of small multiples
2) Animated map
3) Heat maps
4) Interactive map with a window slider
Let me know in the comments if you want examples of each!
#Rstats
March 25, 2025 at 4:01 PM
I'm curious — what do you think is the most effective way to visualize spatio-temporal data?
1) Panel of small multiples
2) Animated map
3) Heat maps
4) Interactive map with a window slider
Let me know in the comments if you want examples of each!
#Rstats
1) Panel of small multiples
2) Animated map
3) Heat maps
4) Interactive map with a window slider
Let me know in the comments if you want examples of each!
#Rstats
High Resolution Climate Data Download Tutorial using {KrigR}!

High Resolution Climate Data Download Tutorial using {KrigR}!
In this quick tutorial, learn how to efficiently download high-resolution climate data using the cDownloads function from the package {KrigR}. Whether you ne...
m.youtube.com
March 20, 2025 at 4:01 PM
High Resolution Climate Data Download Tutorial using {KrigR}!
Side by side interactive map with {leaflet} and {leaflet.extras2}!
Code here: buff.ly/439lyBG
#RStats
Need help with that? Drop your question in the comments or DM me!
Code here: buff.ly/439lyBG
#RStats
Need help with that? Drop your question in the comments or DM me!
March 19, 2025 at 4:01 PM
Side by side interactive map with {leaflet} and {leaflet.extras2}!
Code here: buff.ly/439lyBG
#RStats
Need help with that? Drop your question in the comments or DM me!
Code here: buff.ly/439lyBG
#RStats
Need help with that? Drop your question in the comments or DM me!
NDVI Case Study!

Case Study: NDVI Analysis in R
Case Study: NDVI Analysis in R In this tutorial, we explore the Normalized Difference Vegetation Index (NDVI) using geospatial data in R. Whether you're work...
m.youtube.com
March 13, 2025 at 4:00 PM
NDVI Case Study!
Analyzed 20 years of temperature trends in Chaudières-Appalaches using R packages:
✅ {pollen} to assess Growing Degree Days (GDD)
✅ {vegeperiod} for the vegetation period changes
Read the full analysis here: 🔗 buff.ly/4gIfClY
#RStats
✅ {pollen} to assess Growing Degree Days (GDD)
✅ {vegeperiod} for the vegetation period changes
Read the full analysis here: 🔗 buff.ly/4gIfClY
#RStats

How Temperature and GDD Trends Are Transforming the Growing Season in Chaudières-Appalaches? | Johanie Fournier
Freelance Agronomist Doing Data Analysis
buff.ly
March 12, 2025 at 4:00 PM
Analyzed 20 years of temperature trends in Chaudières-Appalaches using R packages:
✅ {pollen} to assess Growing Degree Days (GDD)
✅ {vegeperiod} for the vegetation period changes
Read the full analysis here: 🔗 buff.ly/4gIfClY
#RStats
✅ {pollen} to assess Growing Degree Days (GDD)
✅ {vegeperiod} for the vegetation period changes
Read the full analysis here: 🔗 buff.ly/4gIfClY
#RStats

Just published a deep dive into using XGBoost for predicting precipitation in Centre-du-Québec!
#Rstats
Check it out: https://buff.ly/40AbzSV
#Rstats
Check it out: https://buff.ly/40AbzSV

From Trends to Predictions: Machine Learning Forecasts for Centre-du-Québec’s Precipitation | Johanie Fournier
Freelance Agronomist Doing Data Analysis
buff.ly
February 26, 2025 at 5:00 PM
Just published a deep dive into using XGBoost for predicting precipitation in Centre-du-Québec!
#Rstats
Check it out: https://buff.ly/40AbzSV
#Rstats
Check it out: https://buff.ly/40AbzSV
Animated visualization inspired by the amazing tutorials of Milos Popovic, PhD.
code here: https://buff.ly/3WZV5m5
#Rstats
code here: https://buff.ly/3WZV5m5
#Rstats
February 25, 2025 at 5:01 PM
Animated visualization inspired by the amazing tutorials of Milos Popovic, PhD.
code here: https://buff.ly/3WZV5m5
#Rstats
code here: https://buff.ly/3WZV5m5
#Rstats
Les érables commencent à cerner! 🎉🍁
February 22, 2025 at 10:35 PM
Les érables commencent à cerner! 🎉🍁
Did it really rain more over the past 30 years in Centre-du-Québec?
I dug into the data to spot trends, patterns, and surprises because sometimes, what we think we know about the weather isn’t quite what the data says!
Check out my analysis and let me know →https://buff.ly/40E6skI
#RStats
I dug into the data to spot trends, patterns, and surprises because sometimes, what we think we know about the weather isn’t quite what the data says!
Check out my analysis and let me know →https://buff.ly/40E6skI
#RStats

30 Years of Precipitation for Centre-du-Québec: Trends, Patterns & Anomalies | Johanie Fournier
Freelance Agronomist Doing Data Analysis
buff.ly
February 19, 2025 at 11:35 AM
Did it really rain more over the past 30 years in Centre-du-Québec?
I dug into the data to spot trends, patterns, and surprises because sometimes, what we think we know about the weather isn’t quite what the data says!
Check out my analysis and let me know →https://buff.ly/40E6skI
#RStats
I dug into the data to spot trends, patterns, and surprises because sometimes, what we think we know about the weather isn’t quite what the data says!
Check out my analysis and let me know →https://buff.ly/40E6skI
#RStats
Reposted by Johanie Fournier

I put together a little #quartopub extension to automatically create image galleries for Quarto websites: vuorre.com/quarto-galle...

February 18, 2025 at 9:20 PM
I put together a little #quartopub extension to automatically create image galleries for Quarto websites: vuorre.com/quarto-galle...
I just created a tiny tutorial on {rgeoboundaries}.
How do you find the auto zoom? I'm not sure if I like it or if it's making me dizzy.
#rstats
youtu.be/K5khtyIdnbk
How do you find the auto zoom? I'm not sure if I like it or if it's making me dizzy.
#rstats
youtu.be/K5khtyIdnbk
Getting Administrative Boundaries with {rgeoboundaries} in R!
YouTube video by Johanie Fournier
youtu.be
February 14, 2025 at 4:30 PM
I just created a tiny tutorial on {rgeoboundaries}.
How do you find the auto zoom? I'm not sure if I like it or if it's making me dizzy.
#rstats
youtu.be/K5khtyIdnbk
How do you find the auto zoom? I'm not sure if I like it or if it's making me dizzy.
#rstats
youtu.be/K5khtyIdnbk
Journée tempête!🎉
a snowy scene with the words " it 's a blizzard " on the bottom
ALT: a snowy scene with the words " it 's a blizzard " on the bottom
media.tenor.com
February 13, 2025 at 1:30 PM
Journée tempête!🎉
In my latest post, I explore 30 years of precipitation data and apply machine learning to forecast the next decade comparing:
🔹 Random Forest
🔹 XGBoost
🔹 MARS
Read the full analysis & access the code here 👉 https://buff.ly/3WE1i6V
#RStats
🔹 Random Forest
🔹 XGBoost
🔹 MARS
Read the full analysis & access the code here 👉 https://buff.ly/3WE1i6V
#RStats
St. Lawrence Lowlands Precipitation Data: 30-Year Trends Prediction | Johanie Fournier
Freelance Agronomist Doing Data Analysis
buff.ly
February 12, 2025 at 7:46 PM
In my latest post, I explore 30 years of precipitation data and apply machine learning to forecast the next decade comparing:
🔹 Random Forest
🔹 XGBoost
🔹 MARS
Read the full analysis & access the code here 👉 https://buff.ly/3WE1i6V
#RStats
🔹 Random Forest
🔹 XGBoost
🔹 MARS
Read the full analysis & access the code here 👉 https://buff.ly/3WE1i6V
#RStats
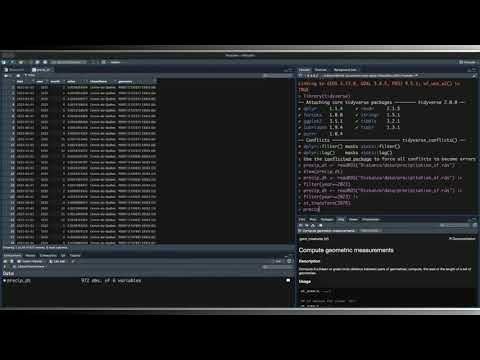
🌍 Accessing Climate Data with {KrigR} in R! 📊
Looking at 30 years of precipitation trends:
🔹 Connect to AgERA5 climate data via API
🔹 Extract precipitation trends with KrigR::CDownloadS()
🔹 Detect anomalies & visualize patterns
Full analysis & code 👉https://buff.ly/42EamfM
#RStats
Looking at 30 years of precipitation trends:
🔹 Connect to AgERA5 climate data via API
🔹 Extract precipitation trends with KrigR::CDownloadS()
🔹 Detect anomalies & visualize patterns
Full analysis & code 👉https://buff.ly/42EamfM
#RStats

St. Lawrence Lowlands Precipitation Data: 30-Year Trends & Anomalies | Johanie Fournier
Freelance Agronomist Doing Data Analysis
buff.ly
February 5, 2025 at 7:46 PM
🌍 Accessing Climate Data with {KrigR} in R! 📊
Looking at 30 years of precipitation trends:
🔹 Connect to AgERA5 climate data via API
🔹 Extract precipitation trends with KrigR::CDownloadS()
🔹 Detect anomalies & visualize patterns
Full analysis & code 👉https://buff.ly/42EamfM
#RStats
Looking at 30 years of precipitation trends:
🔹 Connect to AgERA5 climate data via API
🔹 Extract precipitation trends with KrigR::CDownloadS()
🔹 Detect anomalies & visualize patterns
Full analysis & code 👉https://buff.ly/42EamfM
#RStats