Jeff Allen
@jamaps.bsky.social
maps, graphics, cities, etc.
website: https://jamaps.github.io/
github: https://github.com/jamaps
~9-5 M-F: https://schoolofcities.utoronto.ca/research-type/data-visualization/
website: https://jamaps.github.io/
github: https://github.com/jamaps
~9-5 M-F: https://schoolofcities.utoronto.ca/research-type/data-visualization/
Map we made for the School of Cities' Learning From What Works project — a major report profiling 89 amazing community projects and organizations from across Canada
Check out the report here: schoolofcities.utoronto.ca/research-pub...
Check out the report here: schoolofcities.utoronto.ca/research-pub...

December 5, 2025 at 1:16 PM
Map we made for the School of Cities' Learning From What Works project — a major report profiling 89 amazing community projects and organizations from across Canada
Check out the report here: schoolofcities.utoronto.ca/research-pub...
Check out the report here: schoolofcities.utoronto.ca/research-pub...
Ottawa figure-ground type map digression from this morning
higher-res here: jamaps.github.io/maps/ott-bui...
#ottawa #maps
higher-res here: jamaps.github.io/maps/ott-bui...
#ottawa #maps

December 3, 2025 at 12:42 PM
Ottawa figure-ground type map digression from this morning
higher-res here: jamaps.github.io/maps/ott-bui...
#ottawa #maps
higher-res here: jamaps.github.io/maps/ott-bui...
#ottawa #maps
recent map experiment of Toronto's terrain
made via QGIS/Inkscape/GIMP and TIN data from @torontoopendata.cityof.toronto.ca
higher-res here: jamaps.github.io/maps/terrain...
#toronto #maps #terrain #topography
made via QGIS/Inkscape/GIMP and TIN data from @torontoopendata.cityof.toronto.ca
higher-res here: jamaps.github.io/maps/terrain...
#toronto #maps #terrain #topography

December 2, 2025 at 1:49 PM
recent map experiment of Toronto's terrain
made via QGIS/Inkscape/GIMP and TIN data from @torontoopendata.cityof.toronto.ca
higher-res here: jamaps.github.io/maps/terrain...
#toronto #maps #terrain #topography
made via QGIS/Inkscape/GIMP and TIN data from @torontoopendata.cityof.toronto.ca
higher-res here: jamaps.github.io/maps/terrain...
#toronto #maps #terrain #topography
Recently made a few maps of the new Finch West Line 6 + surrounding land-use
More here: schoolofcities.utoronto.ca/maps-of-line...
#toronto #transit #maps
More here: schoolofcities.utoronto.ca/maps-of-line...
#toronto #transit #maps

November 29, 2025 at 4:02 PM
Recently made a few maps of the new Finch West Line 6 + surrounding land-use
More here: schoolofcities.utoronto.ca/maps-of-line...
#toronto #transit #maps
More here: schoolofcities.utoronto.ca/maps-of-line...
#toronto #transit #maps
Line 6 Finch West is opening soon - here's a chart of 25 years of population change along the route
I adapted this from Michael Liu's great work here: schoolofcities.github.io/tod-toronto-...
#transit #dataviz #toronto
I adapted this from Michael Liu's great work here: schoolofcities.github.io/tod-toronto-...
#transit #dataviz #toronto

November 27, 2025 at 5:15 PM
Line 6 Finch West is opening soon - here's a chart of 25 years of population change along the route
I adapted this from Michael Liu's great work here: schoolofcities.github.io/tod-toronto-...
#transit #dataviz #toronto
I adapted this from Michael Liu's great work here: schoolofcities.github.io/tod-toronto-...
#transit #dataviz #toronto
Charting number of rental units in apartment buildings in Toronto by year of construction
(This is a quick update to a similar chart I made ~2.5 years ago)
#toronto #housing #dataviz #NationalHousingDay
(This is a quick update to a similar chart I made ~2.5 years ago)
#toronto #housing #dataviz #NationalHousingDay

November 22, 2025 at 1:03 PM
Charting number of rental units in apartment buildings in Toronto by year of construction
(This is a quick update to a similar chart I made ~2.5 years ago)
#toronto #housing #dataviz #NationalHousingDay
(This is a quick update to a similar chart I made ~2.5 years ago)
#toronto #housing #dataviz #NationalHousingDay
Graphics from our recent case study "From Tracks to Trail: Planning for equitable (re)development" (Albuquerque, New Mexico)
Read it here: schoolofcities.github.io/eddit/albuqu...
#maps #dataviz
Read it here: schoolofcities.github.io/eddit/albuqu...
#maps #dataviz


September 26, 2025 at 2:08 PM
Graphics from our recent case study "From Tracks to Trail: Planning for equitable (re)development" (Albuquerque, New Mexico)
Read it here: schoolofcities.github.io/eddit/albuqu...
#maps #dataviz
Read it here: schoolofcities.github.io/eddit/albuqu...
#maps #dataviz

quickly mapped out estimates of what % of children are driven to school in the greater toronto/hamilton area
check out more related maps from this data here: schoolofcities.github.io/transportati...
check out more related maps from this data here: schoolofcities.github.io/transportati...

September 2, 2025 at 8:50 PM
quickly mapped out estimates of what % of children are driven to school in the greater toronto/hamilton area
check out more related maps from this data here: schoolofcities.github.io/transportati...
check out more related maps from this data here: schoolofcities.github.io/transportati...
recent maps/scrollytelling piece on under-valued surface parking lots in Toronto (via an analysis of property tax data)
view the project here: schoolofcities.github.io/underutilize...
#toronto #maps #dataviz #parking
view the project here: schoolofcities.github.io/underutilize...
#toronto #maps #dataviz #parking
August 21, 2025 at 5:20 PM
recent maps/scrollytelling piece on under-valued surface parking lots in Toronto (via an analysis of property tax data)
view the project here: schoolofcities.github.io/underutilize...
#toronto #maps #dataviz #parking
view the project here: schoolofcities.github.io/underutilize...
#toronto #maps #dataviz #parking
I like this new raised pedestrian crossing at Draper and Wellington
#toronto #urbandesign #walkability
#toronto #urbandesign #walkability

August 20, 2025 at 12:22 AM
I like this new raised pedestrian crossing at Draper and Wellington
#toronto #urbandesign #walkability
#toronto #urbandesign #walkability
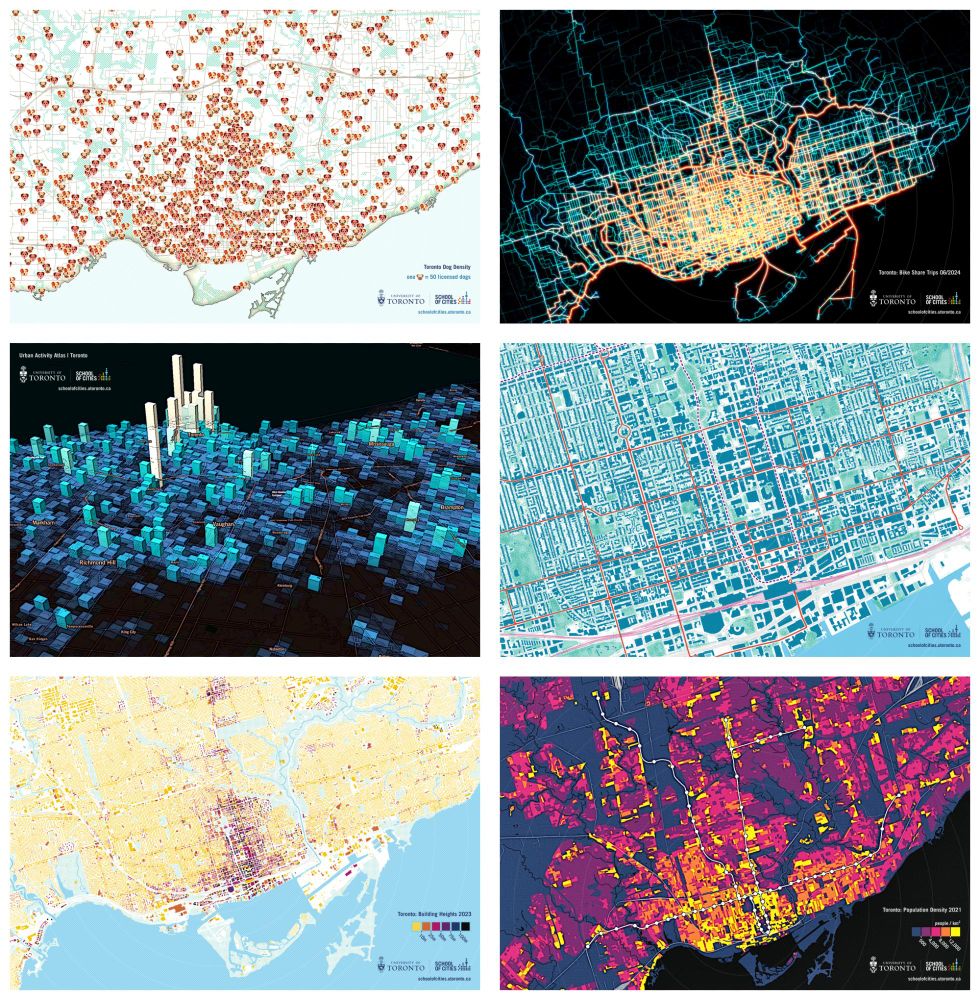
recently updated and printed more @uoftcities.bsky.social Toronto-map-viz postcards
planning to give out a bunch at Civic Spark tomorrow
#maps #dataviz #toronto
planning to give out a bunch at Civic Spark tomorrow
#maps #dataviz #toronto
August 15, 2025 at 6:58 PM
recently updated and printed more @uoftcities.bsky.social Toronto-map-viz postcards
planning to give out a bunch at Civic Spark tomorrow
#maps #dataviz #toronto
planning to give out a bunch at Civic Spark tomorrow
#maps #dataviz #toronto
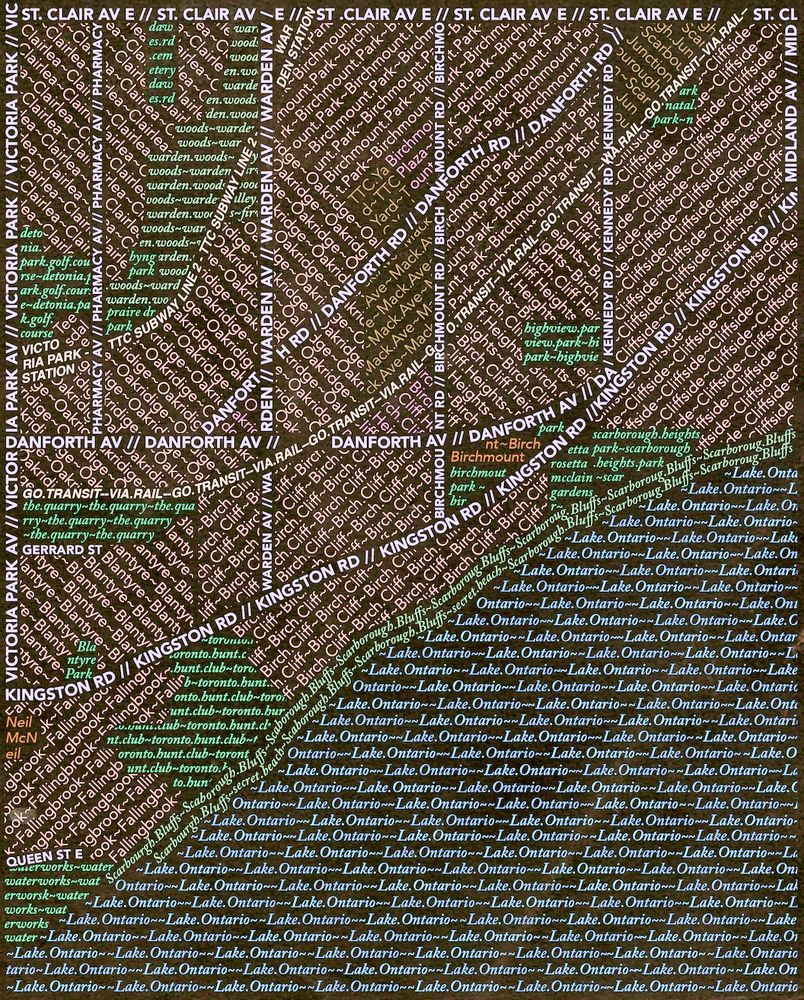
typographic map experiment of southwest Scarborough
(an older project, recent tinkering)
#scarborough #maps #typography
(an older project, recent tinkering)
#scarborough #maps #typography
June 30, 2025 at 5:29 PM
typographic map experiment of southwest Scarborough
(an older project, recent tinkering)
#scarborough #maps #typography
(an older project, recent tinkering)
#scarborough #maps #typography
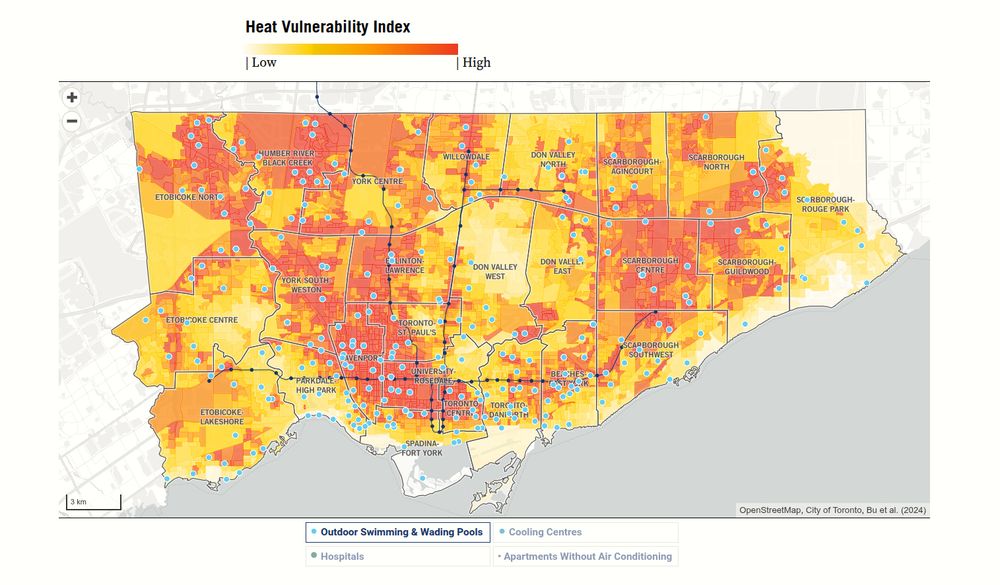
helped create a few maps of heat vulnerability in Toronto around this time last year
thought today's a good time to re-share
check out more here! - schoolofcities.github.io/heat-vulnera...
#toronto #heat #maps
thought today's a good time to re-share
check out more here! - schoolofcities.github.io/heat-vulnera...
#toronto #heat #maps
June 23, 2025 at 1:01 PM
helped create a few maps of heat vulnerability in Toronto around this time last year
thought today's a good time to re-share
check out more here! - schoolofcities.github.io/heat-vulnera...
#toronto #heat #maps
thought today's a good time to re-share
check out more here! - schoolofcities.github.io/heat-vulnera...
#toronto #heat #maps
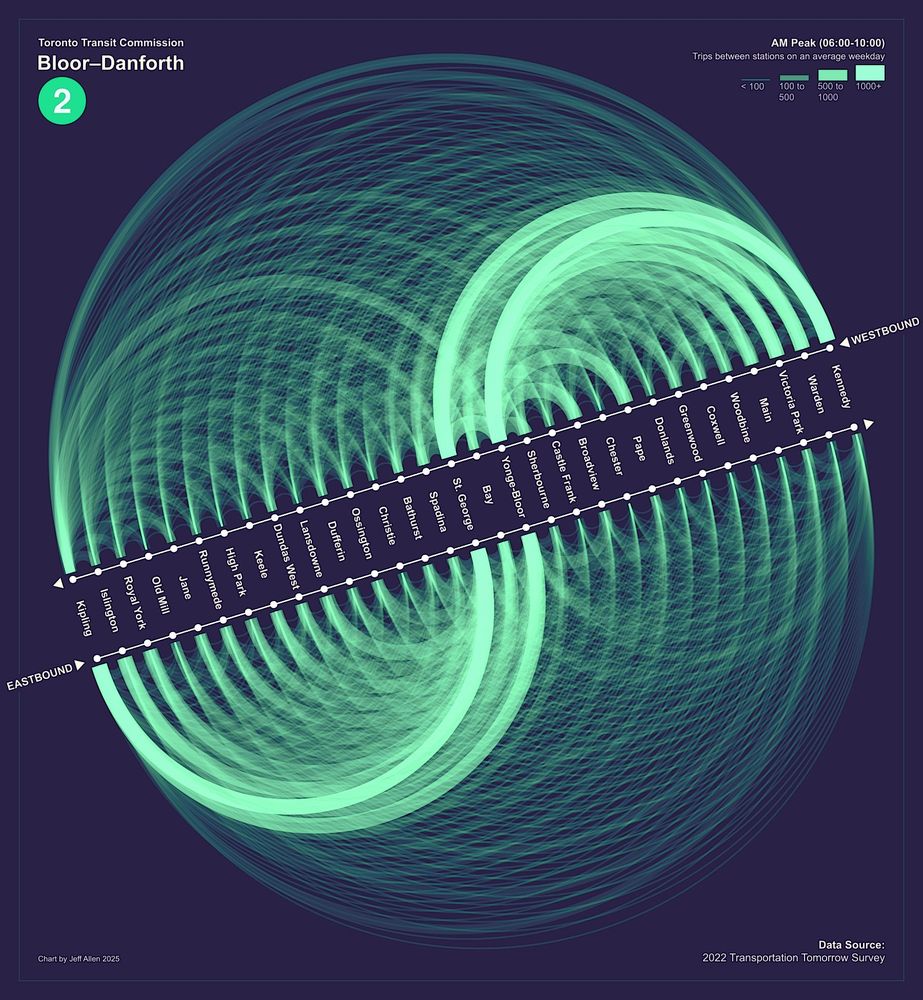
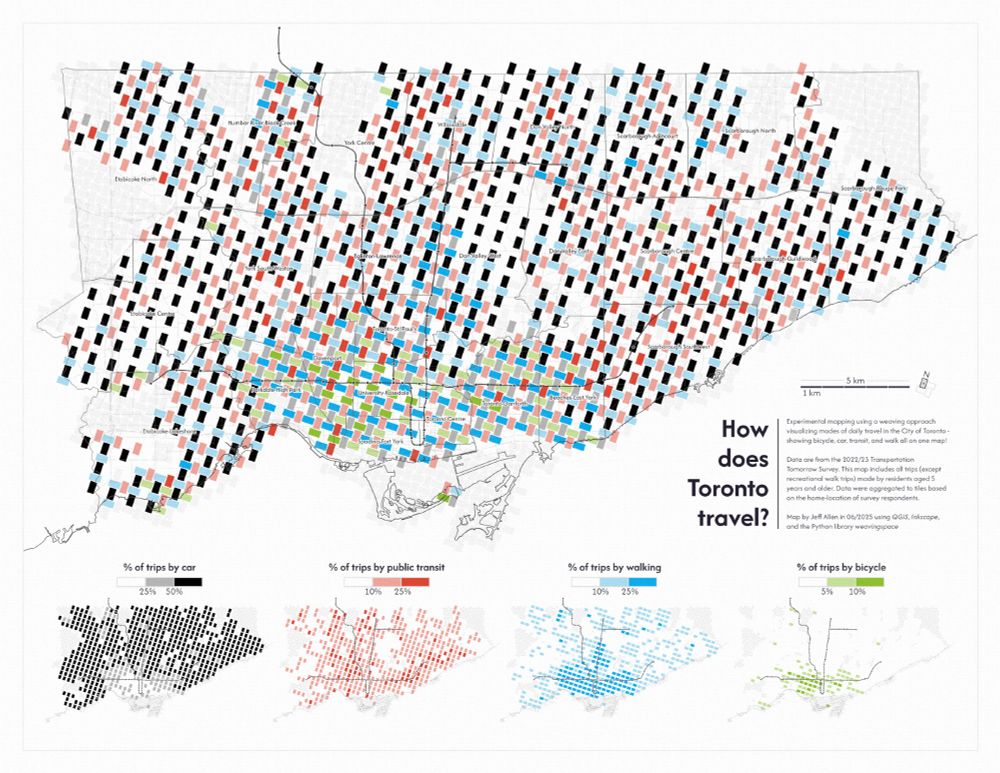
recent experiment mapping daily travel mode share in Toronto via weaving space
more info about this little project here: schoolofcities.github.io/transportati...
#toronto #maps #gis #dataviz
more info about this little project here: schoolofcities.github.io/transportati...
#toronto #maps #gis #dataviz
June 13, 2025 at 12:02 PM
recent experiment mapping daily travel mode share in Toronto via weaving space
more info about this little project here: schoolofcities.github.io/transportati...
#toronto #maps #gis #dataviz
more info about this little project here: schoolofcities.github.io/transportati...
#toronto #maps #gis #dataviz
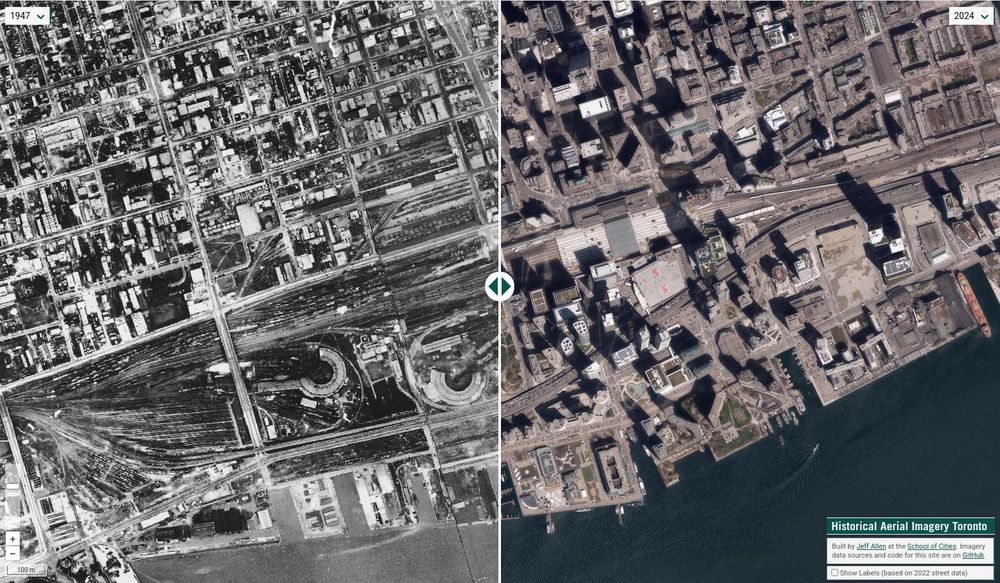
interested in Toronto history? - recently updated our site for viewing and comparing historical aerial imagery / air photos
now includes 1939, 1947, 1954, 1965, 1978, 1985, 2005, 2009, 2012, 2018, 2022, and 2024
schoolofcities.github.io/historical-a...
#toronto #torontohistory #aerial #gis
now includes 1939, 1947, 1954, 1965, 1978, 1985, 2005, 2009, 2012, 2018, 2022, and 2024
schoolofcities.github.io/historical-a...
#toronto #torontohistory #aerial #gis
June 4, 2025 at 11:40 AM
interested in Toronto history? - recently updated our site for viewing and comparing historical aerial imagery / air photos
now includes 1939, 1947, 1954, 1965, 1978, 1985, 2005, 2009, 2012, 2018, 2022, and 2024
schoolofcities.github.io/historical-a...
#toronto #torontohistory #aerial #gis
now includes 1939, 1947, 1954, 1965, 1978, 1985, 2005, 2009, 2012, 2018, 2022, and 2024
schoolofcities.github.io/historical-a...
#toronto #torontohistory #aerial #gis

June 1, 2025 at 5:33 PM
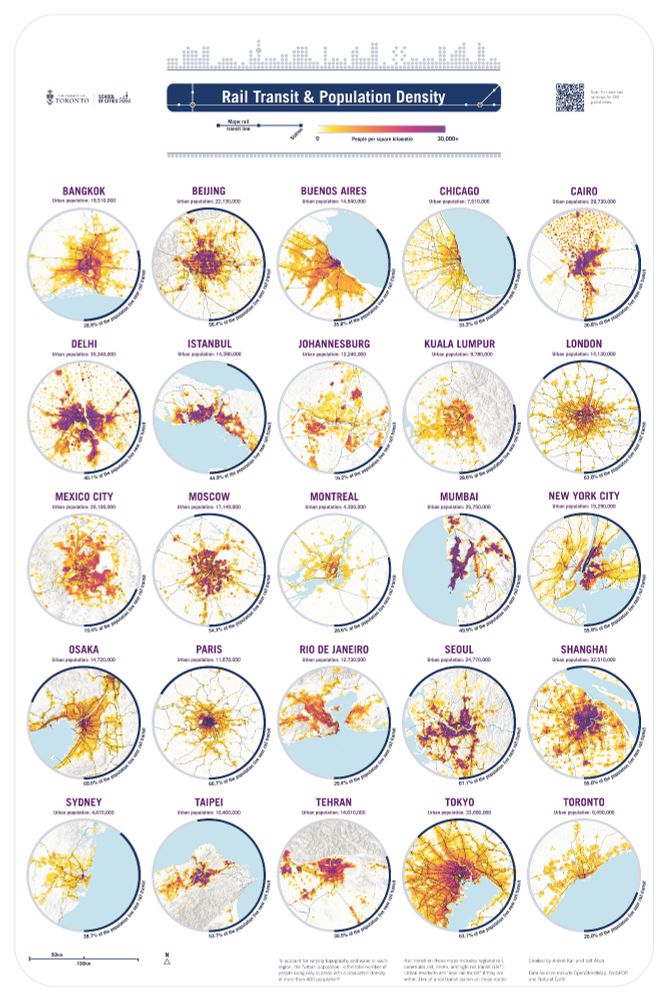
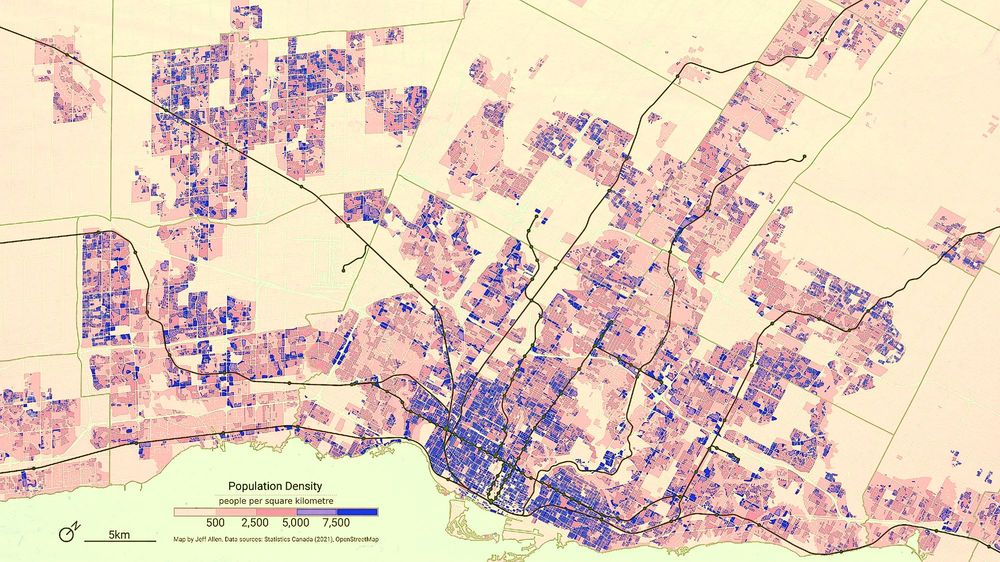
fun map poster of rail transit and population density by Aniket Kali and myself - just showed this at the Canadian Cartographic Association 2025 conference this week!
check out more maps here:) schoolofcities.github.io/rail-transit...
#maps #transit #gis #geopandas #inkscape #openstreetmap
check out more maps here:) schoolofcities.github.io/rail-transit...
#maps #transit #gis #geopandas #inkscape #openstreetmap
May 23, 2025 at 5:42 PM
fun map poster of rail transit and population density by Aniket Kali and myself - just showed this at the Canadian Cartographic Association 2025 conference this week!
check out more maps here:) schoolofcities.github.io/rail-transit...
#maps #transit #gis #geopandas #inkscape #openstreetmap
check out more maps here:) schoolofcities.github.io/rail-transit...
#maps #transit #gis #geopandas #inkscape #openstreetmap
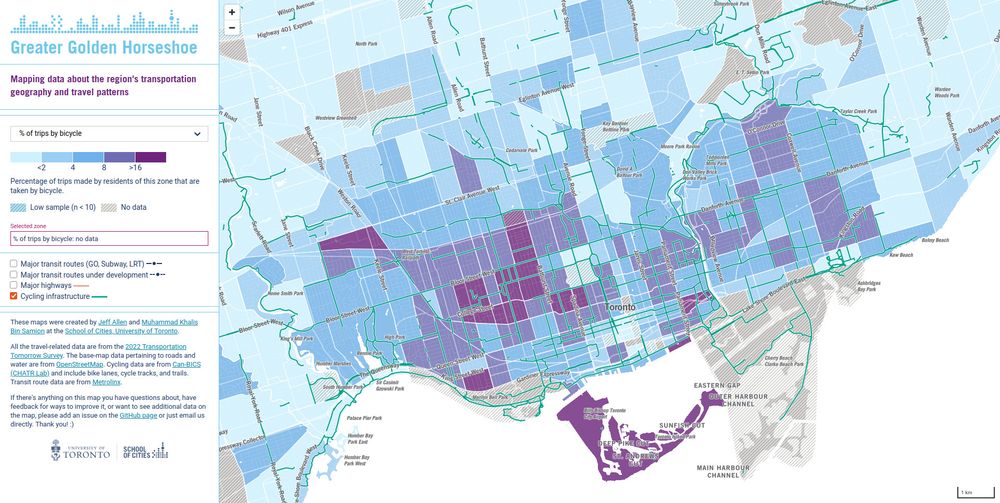
% of trips by bicycle in Toronto
more maps here! schoolofcities.github.io/ggh-transpor...
#maps #dataviz #toronto #biketo
more maps here! schoolofcities.github.io/ggh-transpor...
#maps #dataviz #toronto #biketo
April 12, 2025 at 1:28 PM
% of trips by bicycle in Toronto
more maps here! schoolofcities.github.io/ggh-transpor...
#maps #dataviz #toronto #biketo
more maps here! schoolofcities.github.io/ggh-transpor...
#maps #dataviz #toronto #biketo
April 8, 2025 at 12:06 PM
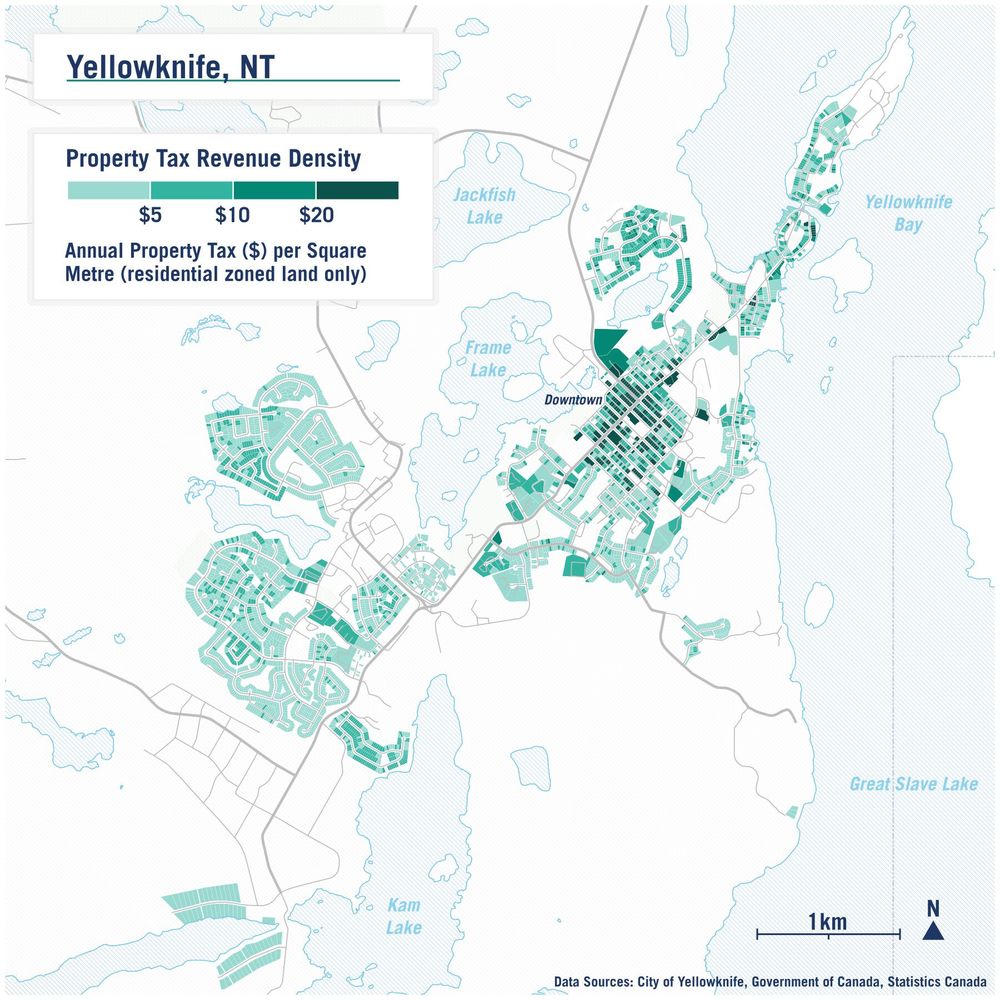
quick map I made about a year ago of Yellowknife showing property tax revenue density
keep on going back to this one as a way to show benefits of denser/central neighbourhoods
wish we had more openly available property tax data like this across Canada
#maps #gis #qgis #yellowknife #urbanism
keep on going back to this one as a way to show benefits of denser/central neighbourhoods
wish we had more openly available property tax data like this across Canada
#maps #gis #qgis #yellowknife #urbanism
April 7, 2025 at 10:14 PM
quick map I made about a year ago of Yellowknife showing property tax revenue density
keep on going back to this one as a way to show benefits of denser/central neighbourhoods
wish we had more openly available property tax data like this across Canada
#maps #gis #qgis #yellowknife #urbanism
keep on going back to this one as a way to show benefits of denser/central neighbourhoods
wish we had more openly available property tax data like this across Canada
#maps #gis #qgis #yellowknife #urbanism

March 24, 2025 at 9:05 PM