


Inès Zaid
@ineszaid.bsky.social
Formally, PhD Researcher & Junior Lecturer at the 3D Geoinfo Group at TU Delft, Section Urban Data Science in the Dep. of Urbanism.
Informally, an architect-in-recovery & urbanist.
Really, obsessed with data-driven design, urbanism and maps. Keen trekker.
Informally, an architect-in-recovery & urbanist.
Really, obsessed with data-driven design, urbanism and maps. Keen trekker.
Reposted by Inès Zaid

#30DayMapChallenge #30DayMapChallenge2025 #30DayMapChallengeRbanism #30DayMapChallengeR
Day 22: Data challenge: natural earth
Ports in the Mediterranean Sea
By Roger Marín de Yzaguirre
#GeoData #rstats #DataViz #Maps #SpatialViz
Day 22: Data challenge: natural earth
Ports in the Mediterranean Sea
By Roger Marín de Yzaguirre
#GeoData #rstats #DataViz #Maps #SpatialViz


November 25, 2025 at 8:47 AM
#30DayMapChallenge #30DayMapChallenge2025 #30DayMapChallengeRbanism #30DayMapChallengeR
Day 22: Data challenge: natural earth
Ports in the Mediterranean Sea
By Roger Marín de Yzaguirre
#GeoData #rstats #DataViz #Maps #SpatialViz
Day 22: Data challenge: natural earth
Ports in the Mediterranean Sea
By Roger Marín de Yzaguirre
#GeoData #rstats #DataViz #Maps #SpatialViz
Reposted by Inès Zaid
#30DayMapChallenge #30DayMapChallenge2025 #30DayMapChallengeRbanism #30DayMapChallengeR
Day 25: Hexagons
MCDA Analysis of Water Network in Dresden
by Soroush Saffarzadeh
#GeoData #rstats #DataViz #Maps #SpatialViz
Day 25: Hexagons
MCDA Analysis of Water Network in Dresden
by Soroush Saffarzadeh
#GeoData #rstats #DataViz #Maps #SpatialViz

November 25, 2025 at 8:39 AM
#30DayMapChallenge #30DayMapChallenge2025 #30DayMapChallengeRbanism #30DayMapChallengeR
Day 25: Hexagons
MCDA Analysis of Water Network in Dresden
by Soroush Saffarzadeh
#GeoData #rstats #DataViz #Maps #SpatialViz
Day 25: Hexagons
MCDA Analysis of Water Network in Dresden
by Soroush Saffarzadeh
#GeoData #rstats #DataViz #Maps #SpatialViz
Reposted by Inès Zaid
#30DayMapChallenge #30DayMapChallenge2025 #30DayMapChallengeRbanism #30DayMapChallengeR
Day 24: Places and their names
Tobacco Heritage Locations in the Netherlands
by Massoud Ghaderian
#GeoData #rstats #DataViz #Maps #SpatialViz
Day 24: Places and their names
Tobacco Heritage Locations in the Netherlands
by Massoud Ghaderian
#GeoData #rstats #DataViz #Maps #SpatialViz


November 25, 2025 at 8:33 AM
#30DayMapChallenge #30DayMapChallenge2025 #30DayMapChallengeRbanism #30DayMapChallengeR
Day 24: Places and their names
Tobacco Heritage Locations in the Netherlands
by Massoud Ghaderian
#GeoData #rstats #DataViz #Maps #SpatialViz
Day 24: Places and their names
Tobacco Heritage Locations in the Netherlands
by Massoud Ghaderian
#GeoData #rstats #DataViz #Maps #SpatialViz
Reposted by Inès Zaid
#30DayMapChallenge #30DayMapChallenge2025 #30DayMapChallengeRbanism #30DayMapChallengeR
Day 23: Process
A heart of green. Reforestation 1985-2020 on Loess Plateau, China
by Yaying Hao
#GeoData #rstats #DataViz #Maps #SpatialViz
Day 23: Process
A heart of green. Reforestation 1985-2020 on Loess Plateau, China
by Yaying Hao
#GeoData #rstats #DataViz #Maps #SpatialViz


November 25, 2025 at 8:27 AM
#30DayMapChallenge #30DayMapChallenge2025 #30DayMapChallengeRbanism #30DayMapChallengeR
Day 23: Process
A heart of green. Reforestation 1985-2020 on Loess Plateau, China
by Yaying Hao
#GeoData #rstats #DataViz #Maps #SpatialViz
Day 23: Process
A heart of green. Reforestation 1985-2020 on Loess Plateau, China
by Yaying Hao
#GeoData #rstats #DataViz #Maps #SpatialViz
Reposted by Inès Zaid
#30DayMapChallenge #30DayMapChallenge2025 #30DayMapChallengeRbanism #30DayMapChallengeR
Day 20: Water
Stream and its shaped valley in 3D view
by Yehan Wu
#GeoData #rstats #DataViz #Maps #SpatialViz
Day 20: Water
Stream and its shaped valley in 3D view
by Yehan Wu
#GeoData #rstats #DataViz #Maps #SpatialViz

November 20, 2025 at 2:28 PM
#30DayMapChallenge #30DayMapChallenge2025 #30DayMapChallengeRbanism #30DayMapChallengeR
Day 20: Water
Stream and its shaped valley in 3D view
by Yehan Wu
#GeoData #rstats #DataViz #Maps #SpatialViz
Day 20: Water
Stream and its shaped valley in 3D view
by Yehan Wu
#GeoData #rstats #DataViz #Maps #SpatialViz
Reposted by Inès Zaid
#30DayMapChallenge #30DayMapChallenge2025 #30DayMapChallengeRbanism #30DayMapChallengeR
Day 19. Cell
Grids, Spatial Lag of Low-Income Families (Q05) – Variation 2009–2023, 100-meter grids in Amsterdam
by Diego Buitrago-Mora
#GeoData #rstats #DataViz #Maps #SpatialViz
Day 19. Cell
Grids, Spatial Lag of Low-Income Families (Q05) – Variation 2009–2023, 100-meter grids in Amsterdam
by Diego Buitrago-Mora
#GeoData #rstats #DataViz #Maps #SpatialViz


November 20, 2025 at 9:06 AM
#30DayMapChallenge #30DayMapChallenge2025 #30DayMapChallengeRbanism #30DayMapChallengeR
Day 19. Cell
Grids, Spatial Lag of Low-Income Families (Q05) – Variation 2009–2023, 100-meter grids in Amsterdam
by Diego Buitrago-Mora
#GeoData #rstats #DataViz #Maps #SpatialViz
Day 19. Cell
Grids, Spatial Lag of Low-Income Families (Q05) – Variation 2009–2023, 100-meter grids in Amsterdam
by Diego Buitrago-Mora
#GeoData #rstats #DataViz #Maps #SpatialViz
Reposted by Inès Zaid
#30DayMapChallenge #30DayMapChallenge2025 #30DayMapChallengeRbanism #30DayMapChallengeR
Day 19. Projections
World Continents UTM Vs. Equal-Area (LAEA) Projection
by Soroush Saffarzadeh
#GeoData #rstats #DataViz #Maps #SpatialViz
Day 19. Projections
World Continents UTM Vs. Equal-Area (LAEA) Projection
by Soroush Saffarzadeh
#GeoData #rstats #DataViz #Maps #SpatialViz


November 19, 2025 at 6:12 PM
#30DayMapChallenge #30DayMapChallenge2025 #30DayMapChallengeRbanism #30DayMapChallengeR
Day 19. Projections
World Continents UTM Vs. Equal-Area (LAEA) Projection
by Soroush Saffarzadeh
#GeoData #rstats #DataViz #Maps #SpatialViz
Day 19. Projections
World Continents UTM Vs. Equal-Area (LAEA) Projection
by Soroush Saffarzadeh
#GeoData #rstats #DataViz #Maps #SpatialViz
Reposted by Inès Zaid
#30DayMapChallenge #30DayMapChallenge2025 #30DayMapChallengeRbanism #30DayMapChallengeR
Day 18: Out Of This World
Render a 3D map of Olympus Mons on Mars using elevation data
by Ignacio Urria Yáñez.
#GeoData #rstats #DataViz #Maps #SpatialViz
Day 18: Out Of This World
Render a 3D map of Olympus Mons on Mars using elevation data
by Ignacio Urria Yáñez.
#GeoData #rstats #DataViz #Maps #SpatialViz


November 18, 2025 at 12:26 PM
#30DayMapChallenge #30DayMapChallenge2025 #30DayMapChallengeRbanism #30DayMapChallengeR
Day 18: Out Of This World
Render a 3D map of Olympus Mons on Mars using elevation data
by Ignacio Urria Yáñez.
#GeoData #rstats #DataViz #Maps #SpatialViz
Day 18: Out Of This World
Render a 3D map of Olympus Mons on Mars using elevation data
by Ignacio Urria Yáñez.
#GeoData #rstats #DataViz #Maps #SpatialViz
Reposted by Inès Zaid
#30DayMapChallenge #30DayMapChallenge2025 #30DayMapChallengeRbanism #30DayMapChallengeR
Day 17: A New Tool
Mapping Co-Hotspots in Amsterdam: A Social-Spatial Network Analysis using SNoMaN Software
by Shuyu Zhang
#GeoData #rstats #DataViz #Maps #SpatialViz
Day 17: A New Tool
Mapping Co-Hotspots in Amsterdam: A Social-Spatial Network Analysis using SNoMaN Software
by Shuyu Zhang
#GeoData #rstats #DataViz #Maps #SpatialViz


November 17, 2025 at 4:05 PM
#30DayMapChallenge #30DayMapChallenge2025 #30DayMapChallengeRbanism #30DayMapChallengeR
Day 17: A New Tool
Mapping Co-Hotspots in Amsterdam: A Social-Spatial Network Analysis using SNoMaN Software
by Shuyu Zhang
#GeoData #rstats #DataViz #Maps #SpatialViz
Day 17: A New Tool
Mapping Co-Hotspots in Amsterdam: A Social-Spatial Network Analysis using SNoMaN Software
by Shuyu Zhang
#GeoData #rstats #DataViz #Maps #SpatialViz
Reposted by Inès Zaid
#30DayMapChallenge #30DayMapChallenge2025 #30DayMapChallengeRbanism #30DayMapChallengeR
Day 15: FIRE.
Finance, Insurance, Real Estate and other advanced services as markers of urban globalisation
by @clementinecttn.bsky.social
#GeoData #rstats #DataViz #Maps #SpatialViz
Day 15: FIRE.
Finance, Insurance, Real Estate and other advanced services as markers of urban globalisation
by @clementinecttn.bsky.social
#GeoData #rstats #DataViz #Maps #SpatialViz


November 17, 2025 at 3:59 PM
#30DayMapChallenge #30DayMapChallenge2025 #30DayMapChallengeRbanism #30DayMapChallengeR
Day 15: FIRE.
Finance, Insurance, Real Estate and other advanced services as markers of urban globalisation
by @clementinecttn.bsky.social
#GeoData #rstats #DataViz #Maps #SpatialViz
Day 15: FIRE.
Finance, Insurance, Real Estate and other advanced services as markers of urban globalisation
by @clementinecttn.bsky.social
#GeoData #rstats #DataViz #Maps #SpatialViz
Reposted by Inès Zaid
#30DayMapChallenge #30DayMapChallenge2025 #30DayMapChallengeRbanism #30DayMapChallengeR
Day 11: Minimal Map
Blue Whale Sightings
by Roger Marín de Yzaguirre
#GeoData #rstats #DataViz #Maps #SpatialViz
Day 11: Minimal Map
Blue Whale Sightings
by Roger Marín de Yzaguirre
#GeoData #rstats #DataViz #Maps #SpatialViz


November 11, 2025 at 4:06 PM
#30DayMapChallenge #30DayMapChallenge2025 #30DayMapChallengeRbanism #30DayMapChallengeR
Day 11: Minimal Map
Blue Whale Sightings
by Roger Marín de Yzaguirre
#GeoData #rstats #DataViz #Maps #SpatialViz
Day 11: Minimal Map
Blue Whale Sightings
by Roger Marín de Yzaguirre
#GeoData #rstats #DataViz #Maps #SpatialViz
Reposted by Inès Zaid
#30DayMapChallenge #30DayMapChallenge2025 #30DayMapChallengeRbanism #30DayMapChallengeR
Day 9: Analog.
M(ap), or M analog plot
by @cforgaci.bsky.social
#GeoData #rstats #DataViz #Maps #SpatialViz
Day 9: Analog.
M(ap), or M analog plot
by @cforgaci.bsky.social
#GeoData #rstats #DataViz #Maps #SpatialViz


November 9, 2025 at 3:48 PM
#30DayMapChallenge #30DayMapChallenge2025 #30DayMapChallengeRbanism #30DayMapChallengeR
Day 9: Analog.
M(ap), or M analog plot
by @cforgaci.bsky.social
#GeoData #rstats #DataViz #Maps #SpatialViz
Day 9: Analog.
M(ap), or M analog plot
by @cforgaci.bsky.social
#GeoData #rstats #DataViz #Maps #SpatialViz
Reposted by Inès Zaid
#30DayMapChallenge #30DayMapChallenge2025 #30DayMapChallengeRbanism #30DayMapChallengeR
Day 8: Urban.
Periurban intensities.
by @bhausleitner.bsky.social & @cforgaci.bsky.social
#GeoData #rstats #DataViz #Maps #SpatialViz
Day 8: Urban.
Periurban intensities.
by @bhausleitner.bsky.social & @cforgaci.bsky.social
#GeoData #rstats #DataViz #Maps #SpatialViz


November 8, 2025 at 8:12 PM
#30DayMapChallenge #30DayMapChallenge2025 #30DayMapChallengeRbanism #30DayMapChallengeR
Day 8: Urban.
Periurban intensities.
by @bhausleitner.bsky.social & @cforgaci.bsky.social
#GeoData #rstats #DataViz #Maps #SpatialViz
Day 8: Urban.
Periurban intensities.
by @bhausleitner.bsky.social & @cforgaci.bsky.social
#GeoData #rstats #DataViz #Maps #SpatialViz
Reposted by Inès Zaid
#30DayMapChallenge #30DayMapChallenge2025 #30DayMapChallengeRbanism #30DayMapChallengeR
Day 7: Accessibility.
Access, A Matter of Means.
by @ineszaid.bsky.social
#GeoData #rstats #DataViz #Maps #SpatialViz
Day 7: Accessibility.
Access, A Matter of Means.
by @ineszaid.bsky.social
#GeoData #rstats #DataViz #Maps #SpatialViz


November 7, 2025 at 11:42 AM
#30DayMapChallenge #30DayMapChallenge2025 #30DayMapChallengeRbanism #30DayMapChallengeR
Day 7: Accessibility.
Access, A Matter of Means.
by @ineszaid.bsky.social
#GeoData #rstats #DataViz #Maps #SpatialViz
Day 7: Accessibility.
Access, A Matter of Means.
by @ineszaid.bsky.social
#GeoData #rstats #DataViz #Maps #SpatialViz
Reposted by Inès Zaid
#30DayMapChallenge #30DayMapChallenge2025 #30DayMapChallengeRbanism #30DayMapChallengeR
Day 5: Earth.
Comparing Global and Local Digital Terrain Models
by @cforgaci.bsky.social
#GeoData #rstats #DataViz #Maps #SpatialViz
Day 5: Earth.
Comparing Global and Local Digital Terrain Models
by @cforgaci.bsky.social
#GeoData #rstats #DataViz #Maps #SpatialViz

November 5, 2025 at 9:03 AM
#30DayMapChallenge #30DayMapChallenge2025 #30DayMapChallengeRbanism #30DayMapChallengeR
Day 5: Earth.
Comparing Global and Local Digital Terrain Models
by @cforgaci.bsky.social
#GeoData #rstats #DataViz #Maps #SpatialViz
Day 5: Earth.
Comparing Global and Local Digital Terrain Models
by @cforgaci.bsky.social
#GeoData #rstats #DataViz #Maps #SpatialViz
Exciting opening in our 3D Geoinformation group at TU Delft !
We are looking for a postdoc to work on energy data, flexibility, and digital twins for Positive Energy Districts. If you are passionate about resilient and data-driven urban futures, have a look 👇
careers.tudelft.nl/job/Delft-Po...
We are looking for a postdoc to work on energy data, flexibility, and digital twins for Positive Energy Districts. If you are passionate about resilient and data-driven urban futures, have a look 👇
careers.tudelft.nl/job/Delft-Po...

Postdoc in 3D Geoinformation for Energy Data and Flexibility Management for PEDs
Postdoc in 3D Geoinformation for Energy Data and Flexibility Management for PEDs
careers.tudelft.nl
November 4, 2025 at 5:41 PM
Exciting opening in our 3D Geoinformation group at TU Delft !
We are looking for a postdoc to work on energy data, flexibility, and digital twins for Positive Energy Districts. If you are passionate about resilient and data-driven urban futures, have a look 👇
careers.tudelft.nl/job/Delft-Po...
We are looking for a postdoc to work on energy data, flexibility, and digital twins for Positive Energy Districts. If you are passionate about resilient and data-driven urban futures, have a look 👇
careers.tudelft.nl/job/Delft-Po...
Reposted by Inès Zaid
#30DayMapChallenge #30DayMapChallenge2025 #30DayMapChallengeRbanism #30DayMapChallengeR
Day 4: My Data.
Cycling into the “Highlands” of the Netherlands: Veluwezoom (already too high for me!)
by Yehan Wu
Day 4: My Data.
Cycling into the “Highlands” of the Netherlands: Veluwezoom (already too high for me!)
by Yehan Wu


November 4, 2025 at 8:46 AM
#30DayMapChallenge #30DayMapChallenge2025 #30DayMapChallengeRbanism #30DayMapChallengeR
Day 4: My Data.
Cycling into the “Highlands” of the Netherlands: Veluwezoom (already too high for me!)
by Yehan Wu
Day 4: My Data.
Cycling into the “Highlands” of the Netherlands: Veluwezoom (already too high for me!)
by Yehan Wu
Reposted by Inès Zaid
#30DayMapChallenge #30DayMapChallenge2025 #30DayMapChallengeRbanism #30DayMapChallengeR
Day 3. Polygons.
Destruction Patterns in Gaza
by @dni-ka.bsky.social
Day 3. Polygons.
Destruction Patterns in Gaza
by @dni-ka.bsky.social

November 3, 2025 at 1:23 PM
#30DayMapChallenge #30DayMapChallenge2025 #30DayMapChallengeRbanism #30DayMapChallengeR
Day 3. Polygons.
Destruction Patterns in Gaza
by @dni-ka.bsky.social
Day 3. Polygons.
Destruction Patterns in Gaza
by @dni-ka.bsky.social
Reposted by Inès Zaid
#30DayMapChallenge #30DayMapChallenge2025 #30DayMapChallengeRbanism #30DayMapChallengeR
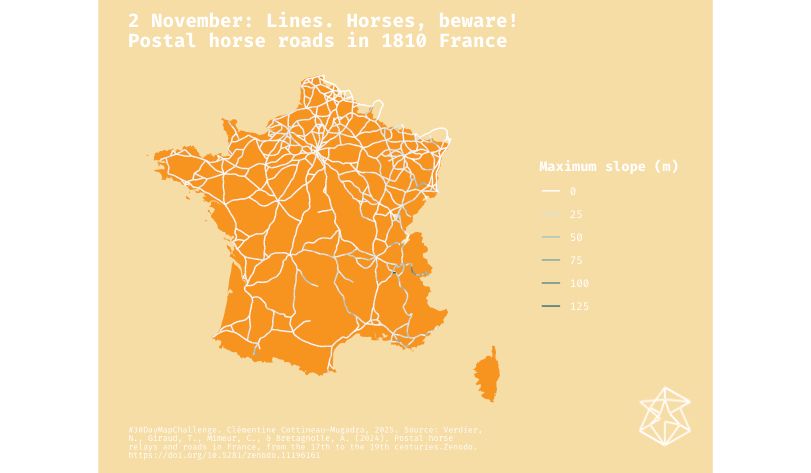
Day 2. Lines.
Horses, beware! Postal horse roads in 1810 France
by @clementinecttn.bsky.social
Day 2. Lines.
Horses, beware! Postal horse roads in 1810 France
by @clementinecttn.bsky.social

November 2, 2025 at 9:02 AM
#30DayMapChallenge #30DayMapChallenge2025 #30DayMapChallengeRbanism #30DayMapChallengeR
Day 2. Lines.
Horses, beware! Postal horse roads in 1810 France
by @clementinecttn.bsky.social
Day 2. Lines.
Horses, beware! Postal horse roads in 1810 France
by @clementinecttn.bsky.social
Reposted by Inès Zaid
#30DayMapChallenge #30DayMapChallenge2025 #30DayMapChallengeRbanism #30DayMapChallengeR
Day 1. Points.
Pigeons, beware! 1km around distributors of contraceptive seeds in the City of Brussels
by @clementinecttn.bsky.social
Day 1. Points.
Pigeons, beware! 1km around distributors of contraceptive seeds in the City of Brussels
by @clementinecttn.bsky.social


November 1, 2025 at 12:47 PM
#30DayMapChallenge #30DayMapChallenge2025 #30DayMapChallengeRbanism #30DayMapChallengeR
Day 1. Points.
Pigeons, beware! 1km around distributors of contraceptive seeds in the City of Brussels
by @clementinecttn.bsky.social
Day 1. Points.
Pigeons, beware! 1km around distributors of contraceptive seeds in the City of Brussels
by @clementinecttn.bsky.social
🌱After a brief hiatus, I’m excited to reconnect with the Bsky community and share my recent chapter "Building Adaptability & Urban Regeneration", exploring how urban spaces evolve, the blind spots, trend and influences in the discourse surrounding #adaptability
👉 research.tudelft.nl/en/publicati...
👉 research.tudelft.nl/en/publicati...


October 9, 2025 at 11:30 AM
🌱After a brief hiatus, I’m excited to reconnect with the Bsky community and share my recent chapter "Building Adaptability & Urban Regeneration", exploring how urban spaces evolve, the blind spots, trend and influences in the discourse surrounding #adaptability
👉 research.tudelft.nl/en/publicati...
👉 research.tudelft.nl/en/publicati...
An other great series by @artefr.bsky.social , featuring the architecture of cultural temples, and their urban impact in a critical lens.
www.arte.tv/en/videos/RC...
www.arte.tv/en/videos/RC...

Temples of Culture - Culture | ARTE in English
Museums, concert halls, and opera houses are beacons of the urban landscape. More and more cities are building iconic constructions by star architects, the bigger and more spectacular the better. Desi...
www.arte.tv
March 4, 2025 at 2:31 PM
An other great series by @artefr.bsky.social , featuring the architecture of cultural temples, and their urban impact in a critical lens.
www.arte.tv/en/videos/RC...
www.arte.tv/en/videos/RC...
Reposted by Inès Zaid

Sprawl bad, ex. #1,548
scienceblog.com/552892/urban...
scienceblog.com/552892/urban...

Urban Sprawl May Trap Low-Income Families in Poverty Cycle
Growing up in a sprawling neighborhood could cost you nearly $3,000 in annual income compared to living in a more compact area, according to new research
scienceblog.com
January 9, 2025 at 7:04 PM
Sprawl bad, ex. #1,548
scienceblog.com/552892/urban...
scienceblog.com/552892/urban...
A hard (but really worthwhile) read for a Monday morning, by Centre for Cities
I recommend to check this report, but have a cuppa first ☕️
www.centreforcities.org/publication/...
I recommend to check this report, but have a cuppa first ☕️
www.centreforcities.org/publication/...

January 22, 2024 at 10:56 AM
A hard (but really worthwhile) read for a Monday morning, by Centre for Cities
I recommend to check this report, but have a cuppa first ☕️
www.centreforcities.org/publication/...
I recommend to check this report, but have a cuppa first ☕️
www.centreforcities.org/publication/...