

Rbanism
@rbanism.bsky.social
TUDelft BK-Urbanism community of practice that aims to empower students, researchers, and practitioners to use open-source software and open science practices to answer urban questions effectively and with confidence | #rstats #urbanism | rbanism.org
#30DayMapChallenge #30DayMapChallenge2025 #30DayMapChallengeRbanism #30DayMapChallengeR
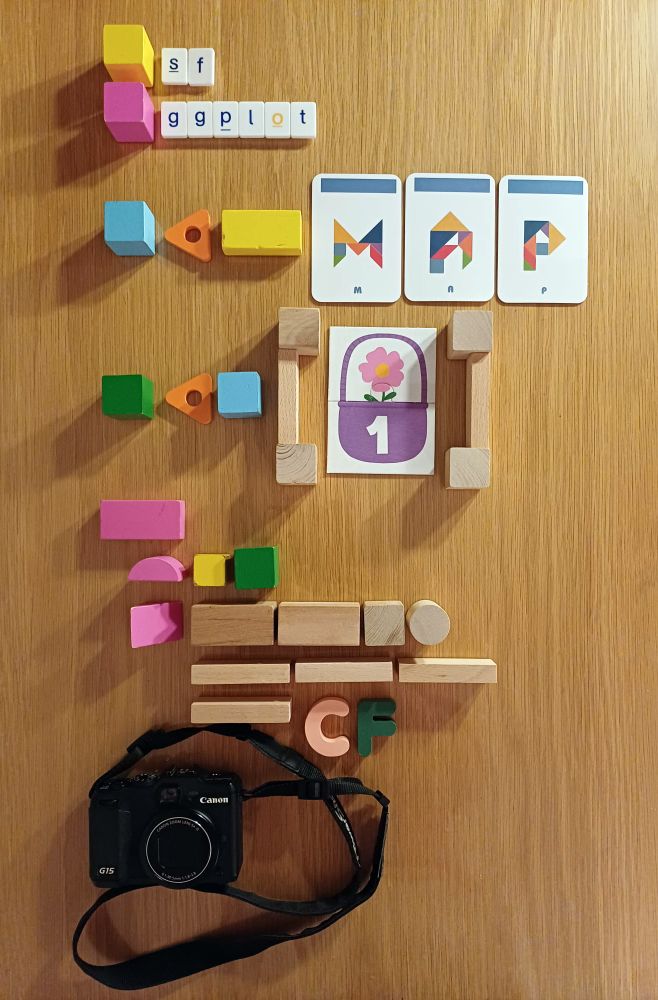
Day 9: Analog.
M(ap), or M analog plot
by @cforgaci.bsky.social
#GeoData #rstats #DataViz #Maps #SpatialViz
Day 9: Analog.
M(ap), or M analog plot
by @cforgaci.bsky.social
#GeoData #rstats #DataViz #Maps #SpatialViz

November 9, 2025 at 3:48 PM
#30DayMapChallenge #30DayMapChallenge2025 #30DayMapChallengeRbanism #30DayMapChallengeR
Day 9: Analog.
M(ap), or M analog plot
by @cforgaci.bsky.social
#GeoData #rstats #DataViz #Maps #SpatialViz
Day 9: Analog.
M(ap), or M analog plot
by @cforgaci.bsky.social
#GeoData #rstats #DataViz #Maps #SpatialViz
#30DayMapChallenge #30DayMapChallenge2025 #30DayMapChallengeRbanism #30DayMapChallengeR
Day 8: Urban.
Periurban intensities.
by @bhausleitner.bsky.social & @cforgaci.bsky.social
#GeoData #rstats #DataViz #Maps #SpatialViz
Day 8: Urban.
Periurban intensities.
by @bhausleitner.bsky.social & @cforgaci.bsky.social
#GeoData #rstats #DataViz #Maps #SpatialViz


November 8, 2025 at 8:12 PM
#30DayMapChallenge #30DayMapChallenge2025 #30DayMapChallengeRbanism #30DayMapChallengeR
Day 8: Urban.
Periurban intensities.
by @bhausleitner.bsky.social & @cforgaci.bsky.social
#GeoData #rstats #DataViz #Maps #SpatialViz
Day 8: Urban.
Periurban intensities.
by @bhausleitner.bsky.social & @cforgaci.bsky.social
#GeoData #rstats #DataViz #Maps #SpatialViz
#30DayMapChallenge #30DayMapChallenge2025 #30DayMapChallengeRbanism #30DayMapChallengeR
Day 7: Accessibility.
Access, A Matter of Means.
by @ineszaid.bsky.social
#GeoData #rstats #DataViz #Maps #SpatialViz
Day 7: Accessibility.
Access, A Matter of Means.
by @ineszaid.bsky.social
#GeoData #rstats #DataViz #Maps #SpatialViz


November 7, 2025 at 11:42 AM
#30DayMapChallenge #30DayMapChallenge2025 #30DayMapChallengeRbanism #30DayMapChallengeR
Day 7: Accessibility.
Access, A Matter of Means.
by @ineszaid.bsky.social
#GeoData #rstats #DataViz #Maps #SpatialViz
Day 7: Accessibility.
Access, A Matter of Means.
by @ineszaid.bsky.social
#GeoData #rstats #DataViz #Maps #SpatialViz
#30DayMapChallenge #30DayMapChallenge2025 #30DayMapChallengeRbanism #30DayMapChallengeR
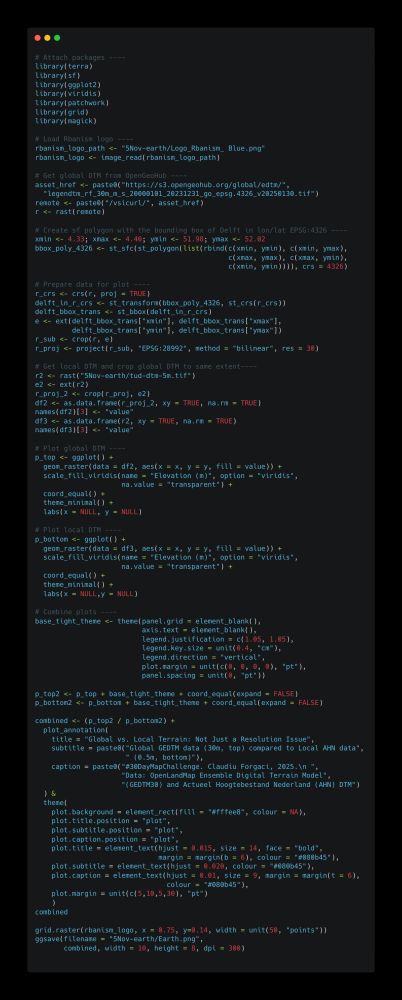
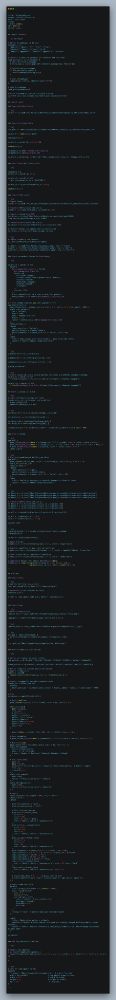
Day 5: Earth.
Comparing Global and Local Digital Terrain Models
by @cforgaci.bsky.social
#GeoData #rstats #DataViz #Maps #SpatialViz
Day 5: Earth.
Comparing Global and Local Digital Terrain Models
by @cforgaci.bsky.social
#GeoData #rstats #DataViz #Maps #SpatialViz

November 5, 2025 at 9:03 AM
#30DayMapChallenge #30DayMapChallenge2025 #30DayMapChallengeRbanism #30DayMapChallengeR
Day 5: Earth.
Comparing Global and Local Digital Terrain Models
by @cforgaci.bsky.social
#GeoData #rstats #DataViz #Maps #SpatialViz
Day 5: Earth.
Comparing Global and Local Digital Terrain Models
by @cforgaci.bsky.social
#GeoData #rstats #DataViz #Maps #SpatialViz
#30DayMapChallenge #30DayMapChallenge2025 #30DayMapChallengeRbanism #30DayMapChallengeR
Day 4: My Data.
Cycling into the “Highlands” of the Netherlands: Veluwezoom (already too high for me!)
by Yehan Wu
Day 4: My Data.
Cycling into the “Highlands” of the Netherlands: Veluwezoom (already too high for me!)
by Yehan Wu


November 4, 2025 at 8:46 AM
#30DayMapChallenge #30DayMapChallenge2025 #30DayMapChallengeRbanism #30DayMapChallengeR
Day 4: My Data.
Cycling into the “Highlands” of the Netherlands: Veluwezoom (already too high for me!)
by Yehan Wu
Day 4: My Data.
Cycling into the “Highlands” of the Netherlands: Veluwezoom (already too high for me!)
by Yehan Wu
#30DayMapChallenge #30DayMapChallenge2025 #30DayMapChallengeRbanism #30DayMapChallengeR
Day 3. Polygons.
Destruction Patterns in Gaza
by @dni-ka.bsky.social
Day 3. Polygons.
Destruction Patterns in Gaza
by @dni-ka.bsky.social

November 3, 2025 at 1:23 PM
#30DayMapChallenge #30DayMapChallenge2025 #30DayMapChallengeRbanism #30DayMapChallengeR
Day 3. Polygons.
Destruction Patterns in Gaza
by @dni-ka.bsky.social
Day 3. Polygons.
Destruction Patterns in Gaza
by @dni-ka.bsky.social
#30DayMapChallenge #30DayMapChallenge2025 #30DayMapChallengeRbanism #30DayMapChallengeR
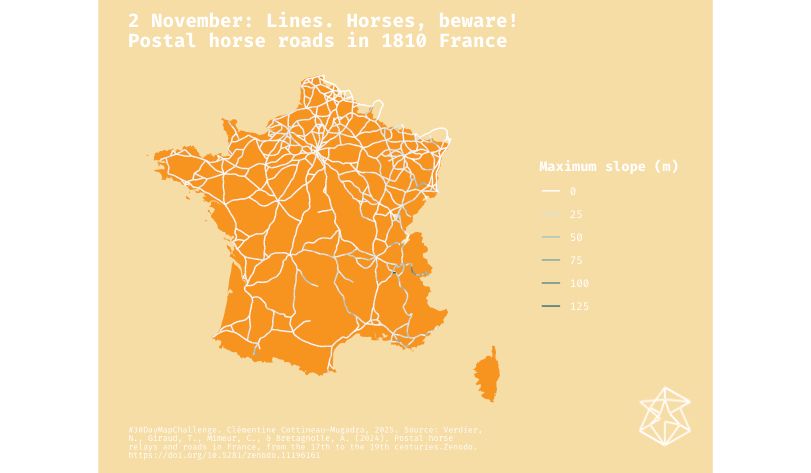
Day 2. Lines.
Horses, beware! Postal horse roads in 1810 France
by @clementinecttn.bsky.social
Day 2. Lines.
Horses, beware! Postal horse roads in 1810 France
by @clementinecttn.bsky.social

November 2, 2025 at 9:02 AM
#30DayMapChallenge #30DayMapChallenge2025 #30DayMapChallengeRbanism #30DayMapChallengeR
Day 2. Lines.
Horses, beware! Postal horse roads in 1810 France
by @clementinecttn.bsky.social
Day 2. Lines.
Horses, beware! Postal horse roads in 1810 France
by @clementinecttn.bsky.social
#30DayMapChallenge #30DayMapChallenge2025 #30DayMapChallengeRbanism #30DayMapChallengeR
Day 1. Points.
Pigeons, beware! 1km around distributors of contraceptive seeds in the City of Brussels
by @clementinecttn.bsky.social
Day 1. Points.
Pigeons, beware! 1km around distributors of contraceptive seeds in the City of Brussels
by @clementinecttn.bsky.social


November 1, 2025 at 12:47 PM
#30DayMapChallenge #30DayMapChallenge2025 #30DayMapChallengeRbanism #30DayMapChallengeR
Day 1. Points.
Pigeons, beware! 1km around distributors of contraceptive seeds in the City of Brussels
by @clementinecttn.bsky.social
Day 1. Points.
Pigeons, beware! 1km around distributors of contraceptive seeds in the City of Brussels
by @clementinecttn.bsky.social
Reposted by Rbanism

#30DayMapChallenge starts tomorrow: 30 days, 30 map ideas.
If you’re using R, Python, or Julia, consider sharing open-source examples or tutorials. 🧭
30daymapchallenge.com
#GeoData #DataViz #Maps #SpatialViz
If you’re using R, Python, or Julia, consider sharing open-source examples or tutorials. 🧭
30daymapchallenge.com
#GeoData #DataViz #Maps #SpatialViz

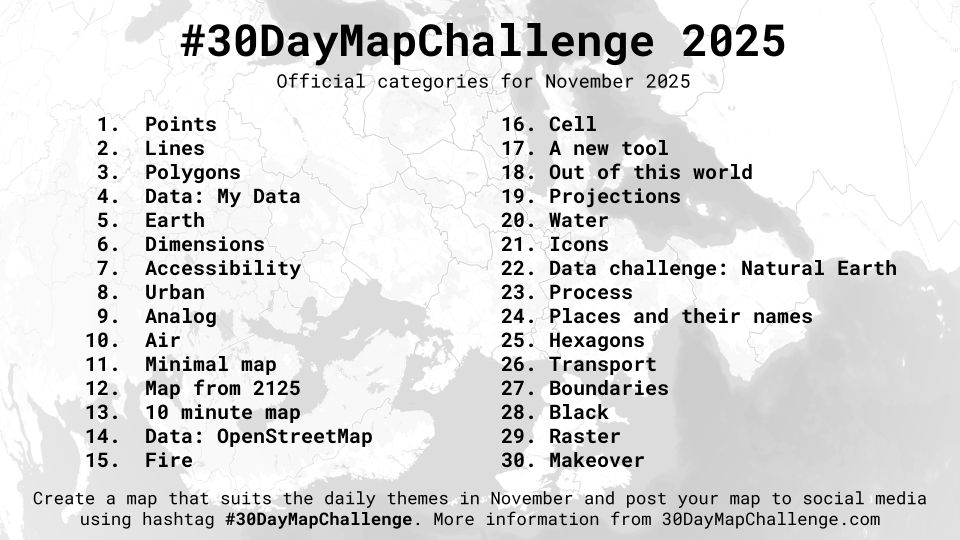
30DayMapChallenge
Daily mapping challenge happening every November!
30daymapchallenge.com
October 31, 2025 at 3:02 PM
#30DayMapChallenge starts tomorrow: 30 days, 30 map ideas.
If you’re using R, Python, or Julia, consider sharing open-source examples or tutorials. 🧭
30daymapchallenge.com
#GeoData #DataViz #Maps #SpatialViz
If you’re using R, Python, or Julia, consider sharing open-source examples or tutorials. 🧭
30daymapchallenge.com
#GeoData #DataViz #Maps #SpatialViz
Reposted by Rbanism

Looking for an overview of different #RStats packages for visualising spatial data? 📊 Here's a previous blog post of mine: nrennie.rbind.io/blog/r-packa...
This blog post is almost three years old now, but all of the code still works!
#DataViz #RSpatial #30DayMapChallenge
This blog post is almost three years old now, but all of the code still works!
#DataViz #RSpatial #30DayMapChallenge

R packages for visualising spatial data – Nicola Rennie
Throughout the #30DayChartChallenge I made most of my maps with R. This blog post details the R packages I find myself using most often when visualising spatial data.
nrennie.rbind.io
October 28, 2025 at 9:23 PM
Looking for an overview of different #RStats packages for visualising spatial data? 📊 Here's a previous blog post of mine: nrennie.rbind.io/blog/r-packa...
This blog post is almost three years old now, but all of the code still works!
#DataViz #RSpatial #30DayMapChallenge
This blog post is almost three years old now, but all of the code still works!
#DataViz #RSpatial #30DayMapChallenge
Join us today at 4pm! Kick-off meeting to prepare our upcoming #30DayMapChallenge with R

October 27, 2025 at 7:40 AM
Join us today at 4pm! Kick-off meeting to prepare our upcoming #30DayMapChallenge with R
It's that time of the year again! 🗺️📍💻
#30DayMapChallenge #30DayMapChallenge2025 #30DayMapChallengeRbanism
30daymapchallenge.com
#30DayMapChallenge #30DayMapChallenge2025 #30DayMapChallengeRbanism
30daymapchallenge.com
October 23, 2025 at 2:38 PM
It's that time of the year again! 🗺️📍💻
#30DayMapChallenge #30DayMapChallenge2025 #30DayMapChallengeRbanism
30daymapchallenge.com
#30DayMapChallenge #30DayMapChallenge2025 #30DayMapChallengeRbanism
30daymapchallenge.com
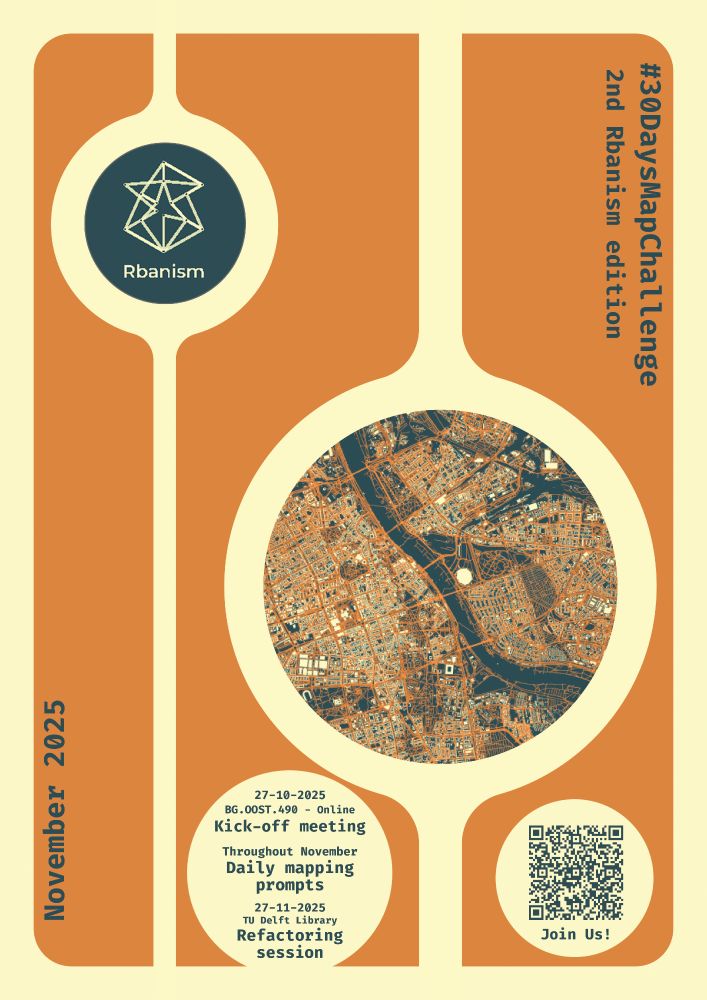
This November, Rbanism launches the second edition of #30DayMapChallenge and we invite researchers, MSc and BSc students, and map makers to join us!
For 30 days, we’ll explore together creative mapping through daily themes, all scripted and coded in R!
Scan the QR and join
#Rbanism #R #bk #tudelft
For 30 days, we’ll explore together creative mapping through daily themes, all scripted and coded in R!
Scan the QR and join
#Rbanism #R #bk #tudelft
October 23, 2025 at 10:19 AM
This November, Rbanism launches the second edition of #30DayMapChallenge and we invite researchers, MSc and BSc students, and map makers to join us!
For 30 days, we’ll explore together creative mapping through daily themes, all scripted and coded in R!
Scan the QR and join
#Rbanism #R #bk #tudelft
For 30 days, we’ll explore together creative mapping through daily themes, all scripted and coded in R!
Scan the QR and join
#Rbanism #R #bk #tudelft
Thanks @carpentries.carpentries.org for relaying our call for beta-testing!
We are excited to share our new lesson **Geospatial Data Carpentry for Urbanism** and open it for feedback.
Any question > rbanism@tudelft.nl
We are excited to share our new lesson **Geospatial Data Carpentry for Urbanism** and open it for feedback.
Any question > rbanism@tudelft.nl
Developers of the "Geospatial Data Carpentry for Urbanism" lesson, currently in The Carpentries Incubator, are looking for Carpentries community members and Instructors willing to to host and teach beta pilot workshops in 2025 and 2026: carpentries.org/blog/2025/10...

Calling for Beta Pilot Workshops: Geospatial Data Carpentry for Urbanism
Researchers from the Department of Urbanism and members of the Digital Competence Centre at TU Delft have worked since 2023 on the curriculum Geospatial Data Carpentry for Urbanism, currently in The C...
carpentries.org
October 23, 2025 at 6:55 AM
Thanks @carpentries.carpentries.org for relaying our call for beta-testing!
We are excited to share our new lesson **Geospatial Data Carpentry for Urbanism** and open it for feedback.
Any question > rbanism@tudelft.nl
We are excited to share our new lesson **Geospatial Data Carpentry for Urbanism** and open it for feedback.
Any question > rbanism@tudelft.nl
Reposted by Rbanism

Developers of the "Geospatial Data Carpentry for Urbanism" lesson, currently in The Carpentries Incubator, are looking for Carpentries community members and Instructors willing to to host and teach beta pilot workshops in 2025 and 2026: carpentries.org/blog/2025/10...
Calling for Beta Pilot Workshops: Geospatial Data Carpentry for Urbanism
Researchers from the Department of Urbanism and members of the Digital Competence Centre at TU Delft have worked since 2023 on the curriculum Geospatial Data Carpentry for Urbanism, currently in The C...
carpentries.org
October 21, 2025 at 3:45 PM
Developers of the "Geospatial Data Carpentry for Urbanism" lesson, currently in The Carpentries Incubator, are looking for Carpentries community members and Instructors willing to to host and teach beta pilot workshops in 2025 and 2026: carpentries.org/blog/2025/10...
Reposted by Rbanism

In this article, @javiersanmillan.bsky.social @clementinecttn.bsky.social and Maarten van Ham compare the spatiotemporal patterns of income vs. wealth segregation, affluence and poverty in the Netherlands. Using geo-coded register microdata, they show that...
doi.org/10.1002/psp....
doi.org/10.1002/psp....

From Flux to Capital: Distinguishing Patterns of Income and Wealth Segregation in the Netherlands
Who are “the rich” and how should their residential patterns be studied? In society, the rich are defined not only by their high income but also—and perhaps more importantly—by their high wealth. How...
doi.org
October 17, 2025 at 11:16 AM
In this article, @javiersanmillan.bsky.social @clementinecttn.bsky.social and Maarten van Ham compare the spatiotemporal patterns of income vs. wealth segregation, affluence and poverty in the Netherlands. Using geo-coded register microdata, they show that...
doi.org/10.1002/psp....
doi.org/10.1002/psp....
Reposted by Rbanism

Cool idea by @odissei.bsky.social and the Institute for Replication: CBS Replication Games!
...Including one article on housing and household mobility...
odissei-data.nl/2025/10/01/c...
...Including one article on housing and household mobility...
odissei-data.nl/2025/10/01/c...

CBS Replication games - call for participants - ODISSEI – Open Data Infrastructure for Social Science and Economic Innovations
During the CBS replication Games, teams of researchers will attempt to reproduce and test the robustness of findings from six economics papers published since 2020 in top economic journals
odissei-data.nl
October 2, 2025 at 10:00 AM
Cool idea by @odissei.bsky.social and the Institute for Replication: CBS Replication Games!
...Including one article on housing and household mobility...
odissei-data.nl/2025/10/01/c...
...Including one article on housing and household mobility...
odissei-data.nl/2025/10/01/c...
💻 + 🗺️ + 🍕
We are teaming up with the #Rcafé team at TU Delft to organise a *refactoring workshop* next month. The objective: to (learn to) clean and optimise the code of our #30DayMapChallenge maps together... while eating pizza.
Free registration: www.eventbrite.nl/e/nice-and-c...
We are teaming up with the #Rcafé team at TU Delft to organise a *refactoring workshop* next month. The objective: to (learn to) clean and optimise the code of our #30DayMapChallenge maps together... while eating pizza.
Free registration: www.eventbrite.nl/e/nice-and-c...
Nice and Clean: Refactoring Code from the #30DayMapChallenge
Hands-on workshop to refactor #30DayMapChallenge R scripts into clean, reusable code....and enjoy some pizza!
www.eventbrite.nl
October 2, 2025 at 7:40 AM
💻 + 🗺️ + 🍕
We are teaming up with the #Rcafé team at TU Delft to organise a *refactoring workshop* next month. The objective: to (learn to) clean and optimise the code of our #30DayMapChallenge maps together... while eating pizza.
Free registration: www.eventbrite.nl/e/nice-and-c...
We are teaming up with the #Rcafé team at TU Delft to organise a *refactoring workshop* next month. The objective: to (learn to) clean and optimise the code of our #30DayMapChallenge maps together... while eating pizza.
Free registration: www.eventbrite.nl/e/nice-and-c...
In 2 weeks, we are running our yearly Geospatial Data Carpentry for Urbanism workshop at the TU Delft library. This training lasts 2 days and cover the basics of R, vector, raster & OSM data management, mapping and geoprocessing. Registration is free but mandatory www.tudelft.nl/en/library/r...

Geospatial Data Carpentry for Urbanism
www.tudelft.nl
January 27, 2025 at 11:18 AM
In 2 weeks, we are running our yearly Geospatial Data Carpentry for Urbanism workshop at the TU Delft library. This training lasts 2 days and cover the basics of R, vector, raster & OSM data management, mapping and geoprocessing. Registration is free but mandatory www.tudelft.nl/en/library/r...
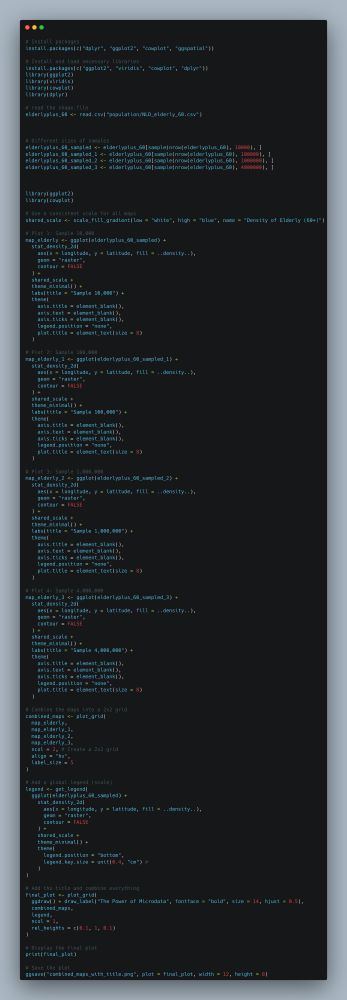
#30DayMapChallenge Day 27. Micromapping
Density of Elderly (older than 60) in 2019
By Diego Buitrago-Mora, 2024.
Data: Data for Good at Meta - High Resolution Population Density Maps and Demographic Estimates
#Rbanism #30DayMapChallenge2024 #rstats #30DayMapChallenge2024_Rbanism
Density of Elderly (older than 60) in 2019
By Diego Buitrago-Mora, 2024.
Data: Data for Good at Meta - High Resolution Population Density Maps and Demographic Estimates
#Rbanism #30DayMapChallenge2024 #rstats #30DayMapChallenge2024_Rbanism

December 2, 2024 at 11:04 AM
#30DayMapChallenge Day 27. Micromapping
Density of Elderly (older than 60) in 2019
By Diego Buitrago-Mora, 2024.
Data: Data for Good at Meta - High Resolution Population Density Maps and Demographic Estimates
#Rbanism #30DayMapChallenge2024 #rstats #30DayMapChallenge2024_Rbanism
Density of Elderly (older than 60) in 2019
By Diego Buitrago-Mora, 2024.
Data: Data for Good at Meta - High Resolution Population Density Maps and Demographic Estimates
#Rbanism #30DayMapChallenge2024 #rstats #30DayMapChallenge2024_Rbanism
#30DayMapChallenge Day 30. The Final Map
Places in the Rbanism 30daymapchallenge
By Claudiu Forgaci, 2024.
Data: Rbanism 30daymapchallenge repository
#Rbanism #30DayMapChallenge2024 #rstats #30DayMapChallenge2024_Rbanism
Places in the Rbanism 30daymapchallenge
By Claudiu Forgaci, 2024.
Data: Rbanism 30daymapchallenge repository
#Rbanism #30DayMapChallenge2024 #rstats #30DayMapChallenge2024_Rbanism


November 30, 2024 at 5:09 PM
#30DayMapChallenge Day 30. The Final Map
Places in the Rbanism 30daymapchallenge
By Claudiu Forgaci, 2024.
Data: Rbanism 30daymapchallenge repository
#Rbanism #30DayMapChallenge2024 #rstats #30DayMapChallenge2024_Rbanism
Places in the Rbanism 30daymapchallenge
By Claudiu Forgaci, 2024.
Data: Rbanism 30daymapchallenge repository
#Rbanism #30DayMapChallenge2024 #rstats #30DayMapChallenge2024_Rbanism
#30DayMapChallenge Day 29. Data: Overture
The Urban Fabric of Warsaw
By Claudiu Forgaci, 2024.
Data: Overture Maps
#Rbanism #30DayMapChallenge2024 #rstats #30DayMapChallenge2024_Rbanism
The Urban Fabric of Warsaw
By Claudiu Forgaci, 2024.
Data: Overture Maps
#Rbanism #30DayMapChallenge2024 #rstats #30DayMapChallenge2024_Rbanism


November 29, 2024 at 2:24 PM
#30DayMapChallenge Day 29. Data: Overture
The Urban Fabric of Warsaw
By Claudiu Forgaci, 2024.
Data: Overture Maps
#Rbanism #30DayMapChallenge2024 #rstats #30DayMapChallenge2024_Rbanism
The Urban Fabric of Warsaw
By Claudiu Forgaci, 2024.
Data: Overture Maps
#Rbanism #30DayMapChallenge2024 #rstats #30DayMapChallenge2024_Rbanism
#30DayMapChallenge Day 28. Blue Planet
World Capitals with River Orientation
By Claudiu Forgaci, 2024.
Data: Open Street Map, NaturalEarth.
#Rbanism #30DayMapChallenge2024 #rstats #30DayMapChallenge2024_Rbanism
World Capitals with River Orientation
By Claudiu Forgaci, 2024.
Data: Open Street Map, NaturalEarth.
#Rbanism #30DayMapChallenge2024 #rstats #30DayMapChallenge2024_Rbanism


November 29, 2024 at 2:22 PM
#30DayMapChallenge Day 28. Blue Planet
World Capitals with River Orientation
By Claudiu Forgaci, 2024.
Data: Open Street Map, NaturalEarth.
#Rbanism #30DayMapChallenge2024 #rstats #30DayMapChallenge2024_Rbanism
World Capitals with River Orientation
By Claudiu Forgaci, 2024.
Data: Open Street Map, NaturalEarth.
#Rbanism #30DayMapChallenge2024 #rstats #30DayMapChallenge2024_Rbanism
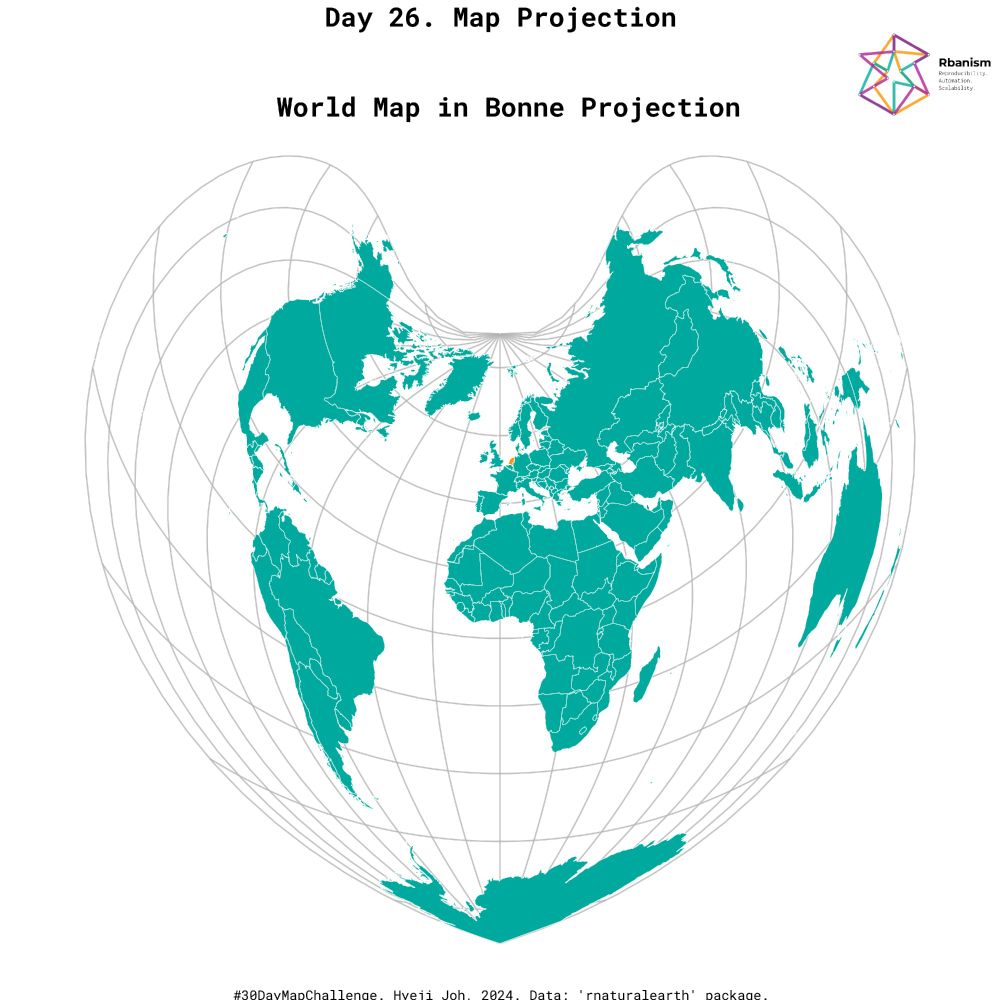
#30DayMapChallenge Day 26. Map Projection
World Map in Bonne Projection
By Hyeji Joh, 2024.
Data: rnaturalearth.
#Rbanism #30DayMapChallenge2024 #rstats #30DayMapChallenge2024_Rbanism
World Map in Bonne Projection
By Hyeji Joh, 2024.
Data: rnaturalearth.
#Rbanism #30DayMapChallenge2024 #rstats #30DayMapChallenge2024_Rbanism

November 27, 2024 at 11:11 AM
#30DayMapChallenge Day 26. Map Projection
World Map in Bonne Projection
By Hyeji Joh, 2024.
Data: rnaturalearth.
#Rbanism #30DayMapChallenge2024 #rstats #30DayMapChallenge2024_Rbanism
World Map in Bonne Projection
By Hyeji Joh, 2024.
Data: rnaturalearth.
#Rbanism #30DayMapChallenge2024 #rstats #30DayMapChallenge2024_Rbanism
#30DayMapChallenge Day 25. Heat
Heat Stress Due to Warm Night Current in the Netherlands
By Yaying Hao, 2024.
Data: Klimaat Atlas
#Rbanism #30DayMapChallenge2024 #rstats #30DayMapChallenge2024_Rbanism
Heat Stress Due to Warm Night Current in the Netherlands
By Yaying Hao, 2024.
Data: Klimaat Atlas
#Rbanism #30DayMapChallenge2024 #rstats #30DayMapChallenge2024_Rbanism


November 27, 2024 at 11:08 AM
#30DayMapChallenge Day 25. Heat
Heat Stress Due to Warm Night Current in the Netherlands
By Yaying Hao, 2024.
Data: Klimaat Atlas
#Rbanism #30DayMapChallenge2024 #rstats #30DayMapChallenge2024_Rbanism
Heat Stress Due to Warm Night Current in the Netherlands
By Yaying Hao, 2024.
Data: Klimaat Atlas
#Rbanism #30DayMapChallenge2024 #rstats #30DayMapChallenge2024_Rbanism