


Reposted

"the 21st century professor is more of a small business owner, dealing with immense administrative burdens like hiring & time sheets, reimbursements, purchasing, health and safety, scheduling exams, financial reporting, teaching assistant duty forms, & so on"
I could have written this post myself
I could have written this post myself

Tracking my work hours reveals a crisis brewing in academia. Being a successful academic shouldn't require us to also be an accountant, HR manager, safety coordinator, travel agent, etc. #WorkLifeBalance #academia
bit.ly/49Zc0KN
bit.ly/49Zc0KN

Recentring the research and teaching mission of universities: The horror of tracking my work hours
Blogging all things ecology and evolution
bit.ly
January 17, 2025 at 10:19 PM
"the 21st century professor is more of a small business owner, dealing with immense administrative burdens like hiring & time sheets, reimbursements, purchasing, health and safety, scheduling exams, financial reporting, teaching assistant duty forms, & so on"
I could have written this post myself
I could have written this post myself
Reposted
The final global data for 2024 is now available
CO₂ continues to accumulate in the atmosphere, and temperatures keep rising relentlessly
More: jgpausas.blogs.uv.es/2025/01/07/r...
Data: @copernicusecmwf.bsky.social & GML-NOAA
🧪🌎🌐 #climatechange climatesky envsci
CO₂ continues to accumulate in the atmosphere, and temperatures keep rising relentlessly
More: jgpausas.blogs.uv.es/2025/01/07/r...
Data: @copernicusecmwf.bsky.social & GML-NOAA
🧪🌎🌐 #climatechange climatesky envsci

January 7, 2025 at 3:24 PM
The final global data for 2024 is now available
CO₂ continues to accumulate in the atmosphere, and temperatures keep rising relentlessly
More: jgpausas.blogs.uv.es/2025/01/07/r...
Data: @copernicusecmwf.bsky.social & GML-NOAA
🧪🌎🌐 #climatechange climatesky envsci
CO₂ continues to accumulate in the atmosphere, and temperatures keep rising relentlessly
More: jgpausas.blogs.uv.es/2025/01/07/r...
Data: @copernicusecmwf.bsky.social & GML-NOAA
🧪🌎🌐 #climatechange climatesky envsci
Reposted

How we can tackle climate change in 2025, according to the UN chief:
“Today, governments around the globe spend nine times more making fossil fuels cheaper than they do on making clean energy more affordable for consumers.” António Guterres
www.euronews.com/green/2025/0...
“Today, governments around the globe spend nine times more making fossil fuels cheaper than they do on making clean energy more affordable for consumers.” António Guterres
www.euronews.com/green/2025/0...

How we can tackle climate change in 2025, according to the UN chief
United Nations Secretary-General Antonio Guterres reminded the world that every year since the Paris Agreement has been the hottest on record.
www.euronews.com
January 20, 2025 at 10:24 AM
How we can tackle climate change in 2025, according to the UN chief:
“Today, governments around the globe spend nine times more making fossil fuels cheaper than they do on making clean energy more affordable for consumers.” António Guterres
www.euronews.com/green/2025/0...
“Today, governments around the globe spend nine times more making fossil fuels cheaper than they do on making clean energy more affordable for consumers.” António Guterres
www.euronews.com/green/2025/0...
Reposted

Many cannot comprehend how the LA fire could happen in winter, or understand the link to climate change.
The scientific community is so disconnected from news outlets, leading to public uncertainty on the climate.
We need News Literacy Education, yesterday.
www.theguardian.com/commentisfre...
The scientific community is so disconnected from news outlets, leading to public uncertainty on the climate.
We need News Literacy Education, yesterday.
www.theguardian.com/commentisfre...

The media needs to show how the climate crisis is fueling the LA wildfires
With few exceptions, the news has shied away from showing how the unfolding climate crisis plays a large role in the disaster
www.theguardian.com
January 20, 2025 at 11:13 AM
Many cannot comprehend how the LA fire could happen in winter, or understand the link to climate change.
The scientific community is so disconnected from news outlets, leading to public uncertainty on the climate.
We need News Literacy Education, yesterday.
www.theguardian.com/commentisfre...
The scientific community is so disconnected from news outlets, leading to public uncertainty on the climate.
We need News Literacy Education, yesterday.
www.theguardian.com/commentisfre...
Support for an envitommentalist and advocate for sustainability. Good luck.


January 18, 2025 at 4:00 PM
Support for an envitommentalist and advocate for sustainability. Good luck.
Reposted

Nearly 2,000 Florida manatees died in 2021 and 2022. Despite pleas for more protections, the U.S. Fish and Wildlife Service proposes that the sea cows’ listing remain the same under the Endangered Species Act.

Florida Manatees Retain Threatened Status Under New Federal Proposal, Despite Outcry for Greater Protection - Inside Climate News
Nearly 2,000 Florida manatees died in 2021 and 2022. The U.S. Fish and Wildlife Service said the sea cows’ plight does not fit the definition of endangered.
insideclimatenews.org
January 17, 2025 at 10:10 PM
Nearly 2,000 Florida manatees died in 2021 and 2022. Despite pleas for more protections, the U.S. Fish and Wildlife Service proposes that the sea cows’ listing remain the same under the Endangered Species Act.
Reposted

Seasonal changes in UK rainfall since 1836
The UK has become ~15% wetter in the last two centuries, mainly in the winter and autumn, even though the wettest year on record is 1872.
Summers have become very slightly drier overall (mainly in the south), even though the driest year on record is 1855.
The UK has become ~15% wetter in the last two centuries, mainly in the winter and autumn, even though the wettest year on record is 1872.
Summers have become very slightly drier overall (mainly in the south), even though the driest year on record is 1855.


January 13, 2025 at 11:43 AM
Seasonal changes in UK rainfall since 1836
The UK has become ~15% wetter in the last two centuries, mainly in the winter and autumn, even though the wettest year on record is 1872.
Summers have become very slightly drier overall (mainly in the south), even though the driest year on record is 1855.
The UK has become ~15% wetter in the last two centuries, mainly in the winter and autumn, even though the wettest year on record is 1872.
Summers have become very slightly drier overall (mainly in the south), even though the driest year on record is 1855.
Reposted
Changes in global mean surface temperature since 1850
Two styles of visualisation to show the six main datasets.
Which do you prefer? One set of axes or small multiples?
[Note: this uses the WMO approach to offsetting the datasets from pre-industrial. Thanks to @micefearboggis.bsky.social.]
Two styles of visualisation to show the six main datasets.
Which do you prefer? One set of axes or small multiples?
[Note: this uses the WMO approach to offsetting the datasets from pre-industrial. Thanks to @micefearboggis.bsky.social.]


January 13, 2025 at 2:24 PM
Changes in global mean surface temperature since 1850
Two styles of visualisation to show the six main datasets.
Which do you prefer? One set of axes or small multiples?
[Note: this uses the WMO approach to offsetting the datasets from pre-industrial. Thanks to @micefearboggis.bsky.social.]
Two styles of visualisation to show the six main datasets.
Which do you prefer? One set of axes or small multiples?
[Note: this uses the WMO approach to offsetting the datasets from pre-industrial. Thanks to @micefearboggis.bsky.social.]
Reposted
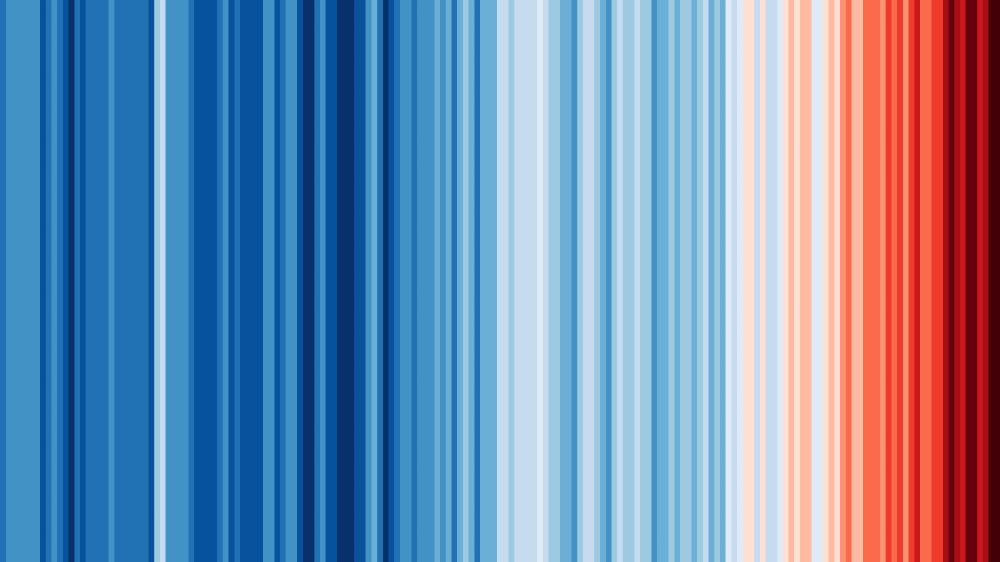
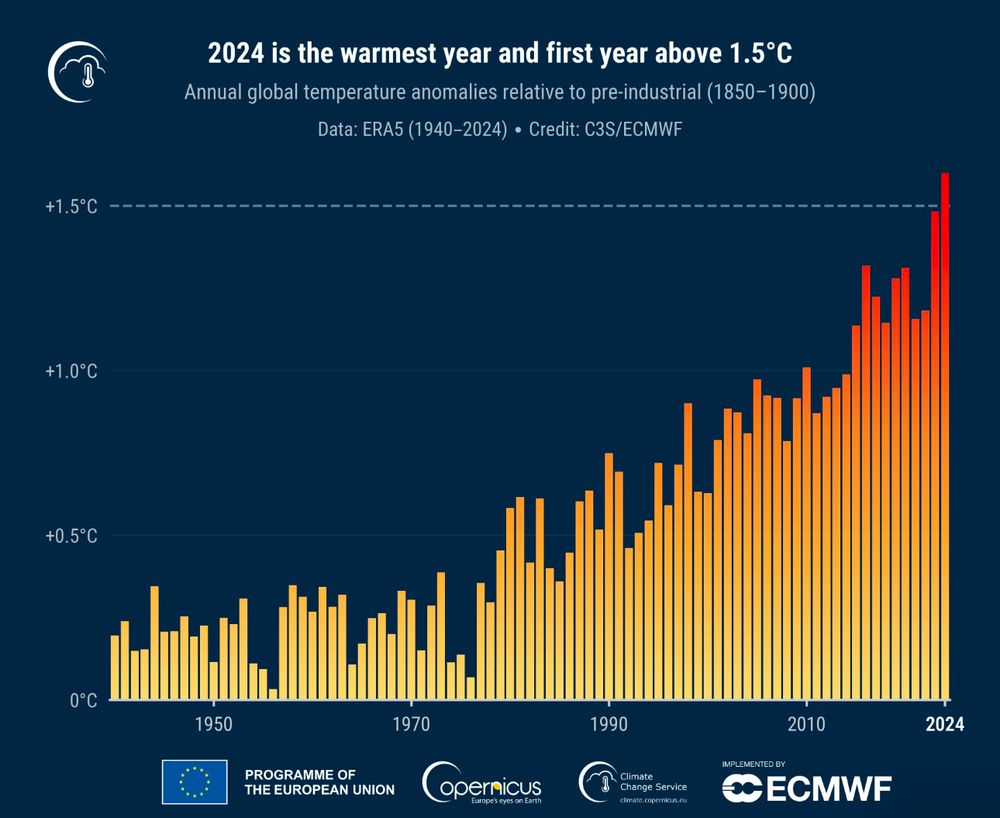
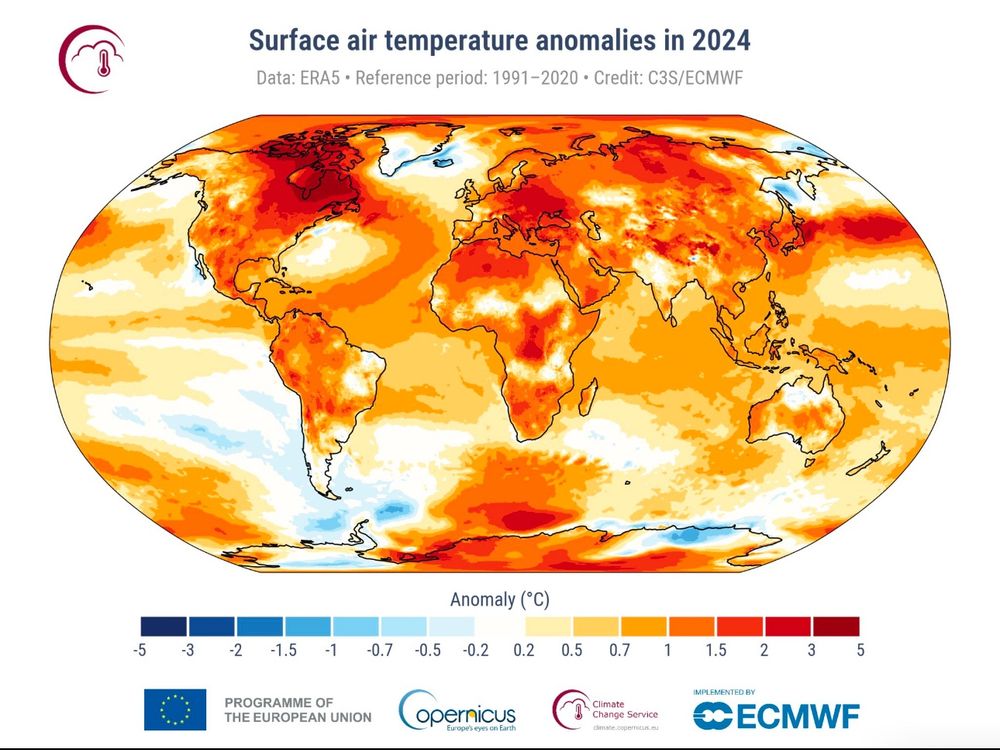
The data is in. 2024 was the warmest year on record, and probably in the whole of human history – about 1.6°C warmer than the pre-industrial period.
More than 1 billion individual thermometer measurements, made by thousands of people over many decades, have been condensed into a single number.
More than 1 billion individual thermometer measurements, made by thousands of people over many decades, have been condensed into a single number.
January 10, 2025 at 9:36 AM
The data is in. 2024 was the warmest year on record, and probably in the whole of human history – about 1.6°C warmer than the pre-industrial period.
More than 1 billion individual thermometer measurements, made by thousands of people over many decades, have been condensed into a single number.
More than 1 billion individual thermometer measurements, made by thousands of people over many decades, have been condensed into a single number.
Reposted

2024 @copernicusecmwf.bsky.social #climate data out today:
📈 2024 - first year more than 1.5°C above pre-industrial; for ERA5 it was 1.6ºC
🌡️ the past 10 years were the 10 warmest years on record
📈 2024 was warmest year for all continental regions, except Antarctica and Australasia
🌍🌡️🧪⚒️🌊
📈 2024 - first year more than 1.5°C above pre-industrial; for ERA5 it was 1.6ºC
🌡️ the past 10 years were the 10 warmest years on record
📈 2024 was warmest year for all continental regions, except Antarctica and Australasia
🌍🌡️🧪⚒️🌊
January 10, 2025 at 6:20 AM
2024 @copernicusecmwf.bsky.social #climate data out today:
📈 2024 - first year more than 1.5°C above pre-industrial; for ERA5 it was 1.6ºC
🌡️ the past 10 years were the 10 warmest years on record
📈 2024 was warmest year for all continental regions, except Antarctica and Australasia
🌍🌡️🧪⚒️🌊
📈 2024 - first year more than 1.5°C above pre-industrial; for ERA5 it was 1.6ºC
🌡️ the past 10 years were the 10 warmest years on record
📈 2024 was warmest year for all continental regions, except Antarctica and Australasia
🌍🌡️🧪⚒️🌊
RealClimate: ¡AI Caramba! www.realclimate.org/index.php/ar...

¡AI Caramba!
Rapid progress in the use of machine learning for weather and climate models is evident almost everywhere, but can we distinguish between real advances and vaporware? First off, let's define some...
www.realclimate.org
January 8, 2025 at 2:33 PM
RealClimate: ¡AI Caramba! www.realclimate.org/index.php/ar...
Reposted

A new visualization showing the Keeling Curve alongside the Antarctic ice core CO2 data.
svs.gsfc.nasa.gov/5447
svs.gsfc.nasa.gov/5447
January 2, 2025 at 9:17 PM
A new visualization showing the Keeling Curve alongside the Antarctic ice core CO2 data.
svs.gsfc.nasa.gov/5447
svs.gsfc.nasa.gov/5447
Hello world!
November 21, 2024 at 11:41 AM
Hello world!