


Gregers Kristian Kjerulf
@gregerskjerulf.bsky.social
#dataanalysis #rstats #dataviz
Senior Data Analyst, DTU Food
Views mine
www.gregdubrow.io
www.linkedin.com/in/dubrowg/
https://medium.com/the-polymaths-dilemma
Senior Data Analyst, DTU Food
Views mine
www.gregdubrow.io
www.linkedin.com/in/dubrowg/
https://medium.com/the-polymaths-dilemma
As always for Halloween, I have two costumes.
On the left - data analyst
On the right - SEXY data analyst
On the left - data analyst
On the right - SEXY data analyst


October 31, 2025 at 8:12 PM
As always for Halloween, I have two costumes.
On the left - data analyst
On the right - SEXY data analyst
On the left - data analyst
On the right - SEXY data analyst
Somebody at my graduate alma mater's fundraising office's IT team is going to be busy this weekend. 😳
These two plus a third one have all hit in the last 10 minutes or so.
Probably time to change my passwords in the alumni portal.
These two plus a third one have all hit in the last 10 minutes or so.
Probably time to change my passwords in the alumni portal.


October 31, 2025 at 3:55 PM
Somebody at my graduate alma mater's fundraising office's IT team is going to be busy this weekend. 😳
These two plus a third one have all hit in the last 10 minutes or so.
Probably time to change my passwords in the alumni portal.
These two plus a third one have all hit in the last 10 minutes or so.
Probably time to change my passwords in the alumni portal.
CatGPT thought my language was too verbose & inefficient, and chided me for using map_dfr() as it's been soft-deprecated.

October 10, 2025 at 10:43 AM
CatGPT thought my language was too verbose & inefficient, and chided me for using map_dfr() as it's been soft-deprecated.

Cheers to all who attended and contributed, and to Simone Pasolini for his excellent event management work. Thanks to the staff at Matrikel1 for setting us up in a room with a beautiful view of the canal and Christiansborg.

September 18, 2025 at 9:09 PM
Cheers to all who attended and contributed, and to Simone Pasolini for his excellent event management work. Thanks to the staff at Matrikel1 for setting us up in a room with a beautiful view of the canal and Christiansborg.
A fun afternoon co-presenting the DDSA Data Science in Practice session on data visualization. We had a creative & engaged group who, barely knowing each other, worked in groups to produce insightful data viz on data they hadn't seen before today
Link to slides:
greg-dubrow.github.io/DDSA_DataViz...
Link to slides:
greg-dubrow.github.io/DDSA_DataViz...


September 18, 2025 at 9:09 PM
A fun afternoon co-presenting the DDSA Data Science in Practice session on data visualization. We had a creative & engaged group who, barely knowing each other, worked in groups to produce insightful data viz on data they hadn't seen before today
Link to slides:
greg-dubrow.github.io/DDSA_DataViz...
Link to slides:
greg-dubrow.github.io/DDSA_DataViz...

What's the value of contributing to the #30DayChartChallenge ?
I took a moment for self-reflection to think about that & put it into a new post on the blog
www.gregdubrow.io/posts/lesson...
Thoughts on improving my #rstats & #dataviz skills, learning more about education in 🇩🇰 & lots more.. 1/
I took a moment for self-reflection to think about that & put it into a new post on the blog
www.gregdubrow.io/posts/lesson...
Thoughts on improving my #rstats & #dataviz skills, learning more about education in 🇩🇰 & lots more.. 1/
May 16, 2025 at 11:16 AM
What's the value of contributing to the #30DayChartChallenge ?
I took a moment for self-reflection to think about that & put it into a new post on the blog
www.gregdubrow.io/posts/lesson...
Thoughts on improving my #rstats & #dataviz skills, learning more about education in 🇩🇰 & lots more.. 1/
I took a moment for self-reflection to think about that & put it into a new post on the blog
www.gregdubrow.io/posts/lesson...
Thoughts on improving my #rstats & #dataviz skills, learning more about education in 🇩🇰 & lots more.. 1/
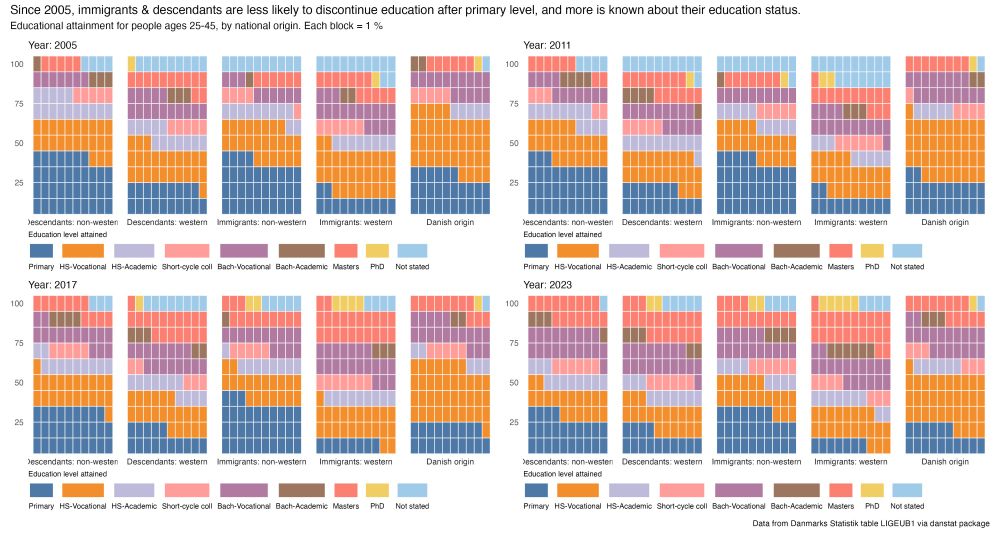
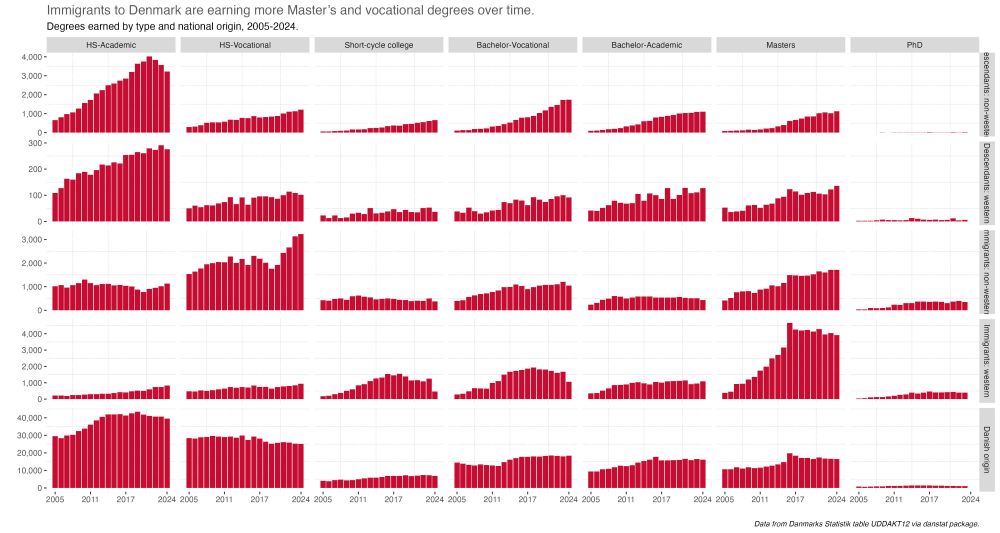
A bit late for my last #30DayChartChallenge some #rstats #dataviz for day 28's prompt - inclusion. Looking at the immigrant experience in the 🇩🇰 education system
tl/dr is more attainment beyond primary level & immigrants rely on vocational degs for social mobility
www.gregdubrow.io/posts/30-day...
tl/dr is more attainment beyond primary level & immigrants rely on vocational degs for social mobility
www.gregdubrow.io/posts/30-day...
May 6, 2025 at 11:22 AM
A bit late for my last #30DayChartChallenge some #rstats #dataviz for day 28's prompt - inclusion. Looking at the immigrant experience in the 🇩🇰 education system
tl/dr is more attainment beyond primary level & immigrants rely on vocational degs for social mobility
www.gregdubrow.io/posts/30-day...
tl/dr is more attainment beyond primary level & immigrants rely on vocational degs for social mobility
www.gregdubrow.io/posts/30-day...
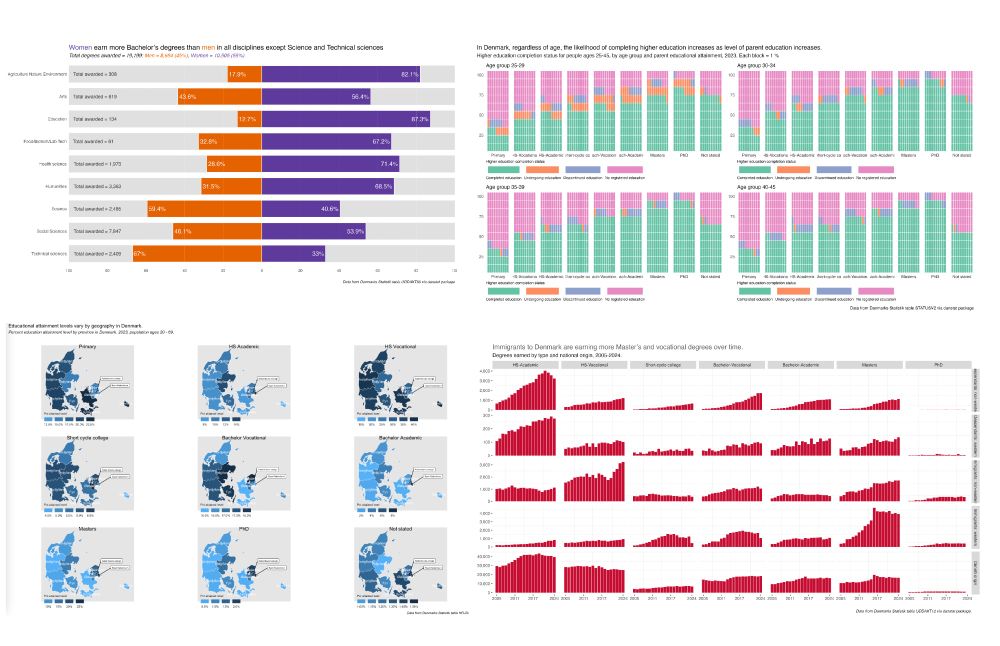
What is educ attainment by province in 🇩🇰? See this (late) post for #30DayChartChallenge prompt 18 El Pais *
#dataviz is maps plotting % by province **. I reused code from a 2024 post, w/ interactivity via g🦒 📦
#rstats data -> 🇩🇰s Statistik via danstat 📦
Full post www.gregdubrow.io/posts/30-day...
#dataviz is maps plotting % by province **. I reused code from a 2024 post, w/ interactivity via g🦒 📦
#rstats data -> 🇩🇰s Statistik via danstat 📦
Full post www.gregdubrow.io/posts/30-day...

April 27, 2025 at 10:23 AM
What is educ attainment by province in 🇩🇰? See this (late) post for #30DayChartChallenge prompt 18 El Pais *
#dataviz is maps plotting % by province **. I reused code from a 2024 post, w/ interactivity via g🦒 📦
#rstats data -> 🇩🇰s Statistik via danstat 📦
Full post www.gregdubrow.io/posts/30-day...
#dataviz is maps plotting % by province **. I reused code from a 2024 post, w/ interactivity via g🦒 📦
#rstats data -> 🇩🇰s Statistik via danstat 📦
Full post www.gregdubrow.io/posts/30-day...
The #30DayChartChallenge prompts 24 & 25, @who.int & risk
For no particular reason, looking at measles vax rates worldwide. #dataviz in #rstats using rgho 📦
More details in post, but messy data in early 2000s & not sold on design choice for Euro subregion plot
www.gregdubrow.io/posts/30-day...
For no particular reason, looking at measles vax rates worldwide. #dataviz in #rstats using rgho 📦
More details in post, but messy data in early 2000s & not sold on design choice for Euro subregion plot
www.gregdubrow.io/posts/30-day...

April 26, 2025 at 9:26 AM
The #30DayChartChallenge prompts 24 & 25, @who.int & risk
For no particular reason, looking at measles vax rates worldwide. #dataviz in #rstats using rgho 📦
More details in post, but messy data in early 2000s & not sold on design choice for Euro subregion plot
www.gregdubrow.io/posts/30-day...
For no particular reason, looking at measles vax rates worldwide. #dataviz in #rstats using rgho 📦
More details in post, but messy data in early 2000s & not sold on design choice for Euro subregion plot
www.gregdubrow.io/posts/30-day...
A #30DayChartChallenge prompt 23 log scales post turns into a post about gender pay gap in 🇩🇰
#dataviz #rstats via danstat 📦
Sadly pay gaps is common, even in countries like 🇩🇰 w/ wage equality laws & good unions.
Digging deeper by deg type, still a gap. More at:
www.gregdubrow.io/posts/30-day...
#dataviz #rstats via danstat 📦
Sadly pay gaps is common, even in countries like 🇩🇰 w/ wage equality laws & good unions.
Digging deeper by deg type, still a gap. More at:
www.gregdubrow.io/posts/30-day...

April 25, 2025 at 10:33 AM
A #30DayChartChallenge prompt 23 log scales post turns into a post about gender pay gap in 🇩🇰
#dataviz #rstats via danstat 📦
Sadly pay gaps is common, even in countries like 🇩🇰 w/ wage equality laws & good unions.
Digging deeper by deg type, still a gap. More at:
www.gregdubrow.io/posts/30-day...
#dataviz #rstats via danstat 📦
Sadly pay gaps is common, even in countries like 🇩🇰 w/ wage equality laws & good unions.
Digging deeper by deg type, still a gap. More at:
www.gregdubrow.io/posts/30-day...
Prompt 19 | #30DayChartChallenge | smooth
(yes, I did 20 yesterday & today should be prompt 23 🤷♂️)
It's time series #dataviz of bachelor degs in 🇩🇰, overall & by sex. #rstats using danstat 📦
Most interesting thing for me was tech science degs. Read more in the post:
www.gregdubrow.io/posts/30-day...
(yes, I did 20 yesterday & today should be prompt 23 🤷♂️)
It's time series #dataviz of bachelor degs in 🇩🇰, overall & by sex. #rstats using danstat 📦
Most interesting thing for me was tech science degs. Read more in the post:
www.gregdubrow.io/posts/30-day...

April 23, 2025 at 12:03 PM
Prompt 19 | #30DayChartChallenge | smooth
(yes, I did 20 yesterday & today should be prompt 23 🤷♂️)
It's time series #dataviz of bachelor degs in 🇩🇰, overall & by sex. #rstats using danstat 📦
Most interesting thing for me was tech science degs. Read more in the post:
www.gregdubrow.io/posts/30-day...
(yes, I did 20 yesterday & today should be prompt 23 🤷♂️)
It's time series #dataviz of bachelor degs in 🇩🇰, overall & by sex. #rstats using danstat 📦
Most interesting thing for me was tech science degs. Read more in the post:
www.gregdubrow.io/posts/30-day...
Prompt 20 | #30DayChartChallenge | urbanization
I wanted to see if more people were moving to larger urban areas & if they were more educated
The answers are yes & yes. More detail & #dataviz thoughts in the post
Data from 🇩🇰 Statistik via danstat 📦 for #rstats
www.gregdubrow.io/posts/30-day...
I wanted to see if more people were moving to larger urban areas & if they were more educated
The answers are yes & yes. More detail & #dataviz thoughts in the post
Data from 🇩🇰 Statistik via danstat 📦 for #rstats
www.gregdubrow.io/posts/30-day...

April 22, 2025 at 1:25 PM
Prompt 20 | #30DayChartChallenge | urbanization
I wanted to see if more people were moving to larger urban areas & if they were more educated
The answers are yes & yes. More detail & #dataviz thoughts in the post
Data from 🇩🇰 Statistik via danstat 📦 for #rstats
www.gregdubrow.io/posts/30-day...
I wanted to see if more people were moving to larger urban areas & if they were more educated
The answers are yes & yes. More detail & #dataviz thoughts in the post
Data from 🇩🇰 Statistik via danstat 📦 for #rstats
www.gregdubrow.io/posts/30-day...
My #30DayChartChallenge posts are no longer in order - here's prompt 13, clusters. It's R&D expenses by sector & field in 🇩🇰. The fun here was using the g🦒 #rstats 📦 to add tooltips to the #dataviz
Full post: www.gregdubrow.io/posts/30-day...
I likely won't get back on prompt schedule, but onward
Full post: www.gregdubrow.io/posts/30-day...
I likely won't get back on prompt schedule, but onward

April 21, 2025 at 10:59 AM
My #30DayChartChallenge posts are no longer in order - here's prompt 13, clusters. It's R&D expenses by sector & field in 🇩🇰. The fun here was using the g🦒 #rstats 📦 to add tooltips to the #dataviz
Full post: www.gregdubrow.io/posts/30-day...
I likely won't get back on prompt schedule, but onward
Full post: www.gregdubrow.io/posts/30-day...
I likely won't get back on prompt schedule, but onward
For #30DayChartChallenge prompt 15, complicated, I expanded on 14 to look at higher ed completion by age & parent ed levels in 🇩🇰. Age didn't matter... ↗️ education your parents have, more likely you are to finish college
🧇 charts #dataviz in #rstats
Full post at:
www.gregdubrow.io/posts/30-day...
🧇 charts #dataviz in #rstats
Full post at:
www.gregdubrow.io/posts/30-day...

April 20, 2025 at 11:19 AM
For #30DayChartChallenge prompt 15, complicated, I expanded on 14 to look at higher ed completion by age & parent ed levels in 🇩🇰. Age didn't matter... ↗️ education your parents have, more likely you are to finish college
🧇 charts #dataviz in #rstats
Full post at:
www.gregdubrow.io/posts/30-day...
🧇 charts #dataviz in #rstats
Full post at:
www.gregdubrow.io/posts/30-day...
Was interrupted a bit, but back w/ a (late) #30DayChartChallenge post for Day 14: Kinship. For this #dataviz I did a #snakey plot to look at higher ed outcomes for people 25-45 depending on parent ed. As always in #rstats & data from Danmarks Statistik
Full post at www.gregdubrow.io/posts/30-day...
Full post at www.gregdubrow.io/posts/30-day...

April 18, 2025 at 1:01 PM
Was interrupted a bit, but back w/ a (late) #30DayChartChallenge post for Day 14: Kinship. For this #dataviz I did a #snakey plot to look at higher ed outcomes for people 25-45 depending on parent ed. As always in #rstats & data from Danmarks Statistik
Full post at www.gregdubrow.io/posts/30-day...
Full post at www.gregdubrow.io/posts/30-day...
Nugget explaining to me that I need to write an #rstats function and not cut-paste-amend the same code again and again
#catsofbluesky
#catsofbluesky

April 10, 2025 at 12:10 PM
Nugget explaining to me that I need to write an #rstats function and not cut-paste-amend the same code again and again
#catsofbluesky
#catsofbluesky
Are there differences in what types of Bachelor degrees are awarded to women v men in 🇩🇰?
For the #30DayChartChallenge prompts 5 & 9, Ranking & Diverging, I found differences to be more stark than expected.
#dataviz in #ggplot & #rstats using data from Danmarks Statistik via danstat 📦
1/...
For the #30DayChartChallenge prompts 5 & 9, Ranking & Diverging, I found differences to be more stark than expected.
#dataviz in #ggplot & #rstats using data from Danmarks Statistik via danstat 📦
1/...


April 9, 2025 at 11:53 AM
Are there differences in what types of Bachelor degrees are awarded to women v men in 🇩🇰?
For the #30DayChartChallenge prompts 5 & 9, Ranking & Diverging, I found differences to be more stark than expected.
#dataviz in #ggplot & #rstats using data from Danmarks Statistik via danstat 📦
1/...
For the #30DayChartChallenge prompts 5 & 9, Ranking & Diverging, I found differences to be more stark than expected.
#dataviz in #ggplot & #rstats using data from Danmarks Statistik via danstat 📦
1/...
Which vocational secondary education degrees are the most popular in 🇩🇰?
To answer I combined #30DayChartChallenge prompts 7 & 8, outliers & histogram, into one post.
www.gregdubrow.io/posts/30-day...
#dataviz in #ggplot / #rstats w/ data from Danmarks Statistik via danstat 📦
1/...
To answer I combined #30DayChartChallenge prompts 7 & 8, outliers & histogram, into one post.
www.gregdubrow.io/posts/30-day...
#dataviz in #ggplot / #rstats w/ data from Danmarks Statistik via danstat 📦
1/...


April 8, 2025 at 9:51 AM
Which vocational secondary education degrees are the most popular in 🇩🇰?
To answer I combined #30DayChartChallenge prompts 7 & 8, outliers & histogram, into one post.
www.gregdubrow.io/posts/30-day...
#dataviz in #ggplot / #rstats w/ data from Danmarks Statistik via danstat 📦
1/...
To answer I combined #30DayChartChallenge prompts 7 & 8, outliers & histogram, into one post.
www.gregdubrow.io/posts/30-day...
#dataviz in #ggplot / #rstats w/ data from Danmarks Statistik via danstat 📦
1/...
Florence Nightingale is prompt 6 #30DayChartChallenge so I took a look at vocational education for SOSU, or social- og sundhedsassistent, a nurse's assistant.
I was especially interested in who is earning the degrees.
www.gregdubrow.io/posts/30-day...
#dataviz #ggplot #rstats,
I was especially interested in who is earning the degrees.
www.gregdubrow.io/posts/30-day...
#dataviz #ggplot #rstats,

April 6, 2025 at 6:21 PM
Florence Nightingale is prompt 6 #30DayChartChallenge so I took a look at vocational education for SOSU, or social- og sundhedsassistent, a nurse's assistant.
I was especially interested in who is earning the degrees.
www.gregdubrow.io/posts/30-day...
#dataviz #ggplot #rstats,
I was especially interested in who is earning the degrees.
www.gregdubrow.io/posts/30-day...
#dataviz #ggplot #rstats,
2025 #30DayChartChallenge - prompt 5 is ranking
A deep dive Bachelor's degrees awarded by discipline, major & sex. Some (surprising?) diffs betw men & women in terms of degree choices. As always #dataviz in #ggplot / #rstats
Lots of charts! See for yourself at
www.gregdubrow.io/posts/30-day...
A deep dive Bachelor's degrees awarded by discipline, major & sex. Some (surprising?) diffs betw men & women in terms of degree choices. As always #dataviz in #ggplot / #rstats
Lots of charts! See for yourself at
www.gregdubrow.io/posts/30-day...
April 5, 2025 at 12:40 PM
2025 #30DayChartChallenge - prompt 5 is ranking
A deep dive Bachelor's degrees awarded by discipline, major & sex. Some (surprising?) diffs betw men & women in terms of degree choices. As always #dataviz in #ggplot / #rstats
Lots of charts! See for yourself at
www.gregdubrow.io/posts/30-day...
A deep dive Bachelor's degrees awarded by discipline, major & sex. Some (surprising?) diffs betw men & women in terms of degree choices. As always #dataviz in #ggplot / #rstats
Lots of charts! See for yourself at
www.gregdubrow.io/posts/30-day...
It's #30DayChartChallenge day 4, prompt = Big or Small.
Today a packed circle graph showing 4-year Bachelor's degs awarded in 🇩🇰 in 2023 by discipline. Most popular was Social Sciences.
Data from Danmarks Statistik via danstat 📦, plots made w/ #ggplot in #rstats
www.gregdubrow.io/posts/30-day...
Today a packed circle graph showing 4-year Bachelor's degs awarded in 🇩🇰 in 2023 by discipline. Most popular was Social Sciences.
Data from Danmarks Statistik via danstat 📦, plots made w/ #ggplot in #rstats
www.gregdubrow.io/posts/30-day...

April 4, 2025 at 11:06 AM
It's #30DayChartChallenge day 4, prompt = Big or Small.
Today a packed circle graph showing 4-year Bachelor's degs awarded in 🇩🇰 in 2023 by discipline. Most popular was Social Sciences.
Data from Danmarks Statistik via danstat 📦, plots made w/ #ggplot in #rstats
www.gregdubrow.io/posts/30-day...
Today a packed circle graph showing 4-year Bachelor's degs awarded in 🇩🇰 in 2023 by discipline. Most popular was Social Sciences.
Data from Danmarks Statistik via danstat 📦, plots made w/ #ggplot in #rstats
www.gregdubrow.io/posts/30-day...
Circular is the #30DayChartChallenge day 3 prompt so here's 60 displaying monthly earnings by educ attainment, employment sector & type in 🇩🇰
In private sector, a Masters is worth 8K to 10K + DKK/month than Bacc. Effect ↗️ in regional govt jobs. #ggplot in #rstats
www.gregdubrow.io/posts/30-day...
In private sector, a Masters is worth 8K to 10K + DKK/month than Bacc. Effect ↗️ in regional govt jobs. #ggplot in #rstats
www.gregdubrow.io/posts/30-day...

April 3, 2025 at 10:33 AM
Circular is the #30DayChartChallenge day 3 prompt so here's 60 displaying monthly earnings by educ attainment, employment sector & type in 🇩🇰
In private sector, a Masters is worth 8K to 10K + DKK/month than Bacc. Effect ↗️ in regional govt jobs. #ggplot in #rstats
www.gregdubrow.io/posts/30-day...
In private sector, a Masters is worth 8K to 10K + DKK/month than Bacc. Effect ↗️ in regional govt jobs. #ggplot in #rstats
www.gregdubrow.io/posts/30-day...
The #30DayChartChallenge day 2 prompt is slope, so I made 4 slope graphs
Data from Danmarks Statistik via danstat 📦
Story here is betw 2005-2023, Danes of all ages have ↗️ levels of education. Especially younger Danes, as having a Masters is almost a necessity
www.gregdubrow.io/posts/30-day...
Data from Danmarks Statistik via danstat 📦
Story here is betw 2005-2023, Danes of all ages have ↗️ levels of education. Especially younger Danes, as having a Masters is almost a necessity
www.gregdubrow.io/posts/30-day...

April 2, 2025 at 2:14 PM
The #30DayChartChallenge day 2 prompt is slope, so I made 4 slope graphs
Data from Danmarks Statistik via danstat 📦
Story here is betw 2005-2023, Danes of all ages have ↗️ levels of education. Especially younger Danes, as having a Masters is almost a necessity
www.gregdubrow.io/posts/30-day...
Data from Danmarks Statistik via danstat 📦
Story here is betw 2005-2023, Danes of all ages have ↗️ levels of education. Especially younger Danes, as having a Masters is almost a necessity
www.gregdubrow.io/posts/30-day...