


Gregers Kristian Kjerulf
@gregerskjerulf.bsky.social
#dataanalysis #rstats #dataviz
Senior Data Analyst, DTU Food
Views mine
www.gregdubrow.io
www.linkedin.com/in/dubrowg/
https://medium.com/the-polymaths-dilemma
Senior Data Analyst, DTU Food
Views mine
www.gregdubrow.io
www.linkedin.com/in/dubrowg/
https://medium.com/the-polymaths-dilemma
As always for Halloween, I have two costumes.
On the left - data analyst
On the right - SEXY data analyst
On the left - data analyst
On the right - SEXY data analyst


October 31, 2025 at 8:12 PM
As always for Halloween, I have two costumes.
On the left - data analyst
On the right - SEXY data analyst
On the left - data analyst
On the right - SEXY data analyst
Somebody at my graduate alma mater's fundraising office's IT team is going to be busy this weekend. 😳
These two plus a third one have all hit in the last 10 minutes or so.
Probably time to change my passwords in the alumni portal.
These two plus a third one have all hit in the last 10 minutes or so.
Probably time to change my passwords in the alumni portal.


October 31, 2025 at 3:55 PM
Somebody at my graduate alma mater's fundraising office's IT team is going to be busy this weekend. 😳
These two plus a third one have all hit in the last 10 minutes or so.
Probably time to change my passwords in the alumni portal.
These two plus a third one have all hit in the last 10 minutes or so.
Probably time to change my passwords in the alumni portal.

A fun afternoon co-presenting the DDSA Data Science in Practice session on data visualization. We had a creative & engaged group who, barely knowing each other, worked in groups to produce insightful data viz on data they hadn't seen before today
Link to slides:
greg-dubrow.github.io/DDSA_DataViz...
Link to slides:
greg-dubrow.github.io/DDSA_DataViz...


September 18, 2025 at 9:09 PM
A fun afternoon co-presenting the DDSA Data Science in Practice session on data visualization. We had a creative & engaged group who, barely knowing each other, worked in groups to produce insightful data viz on data they hadn't seen before today
Link to slides:
greg-dubrow.github.io/DDSA_DataViz...
Link to slides:
greg-dubrow.github.io/DDSA_DataViz...
If I were still teaching or if I go back to it, I'd use an exercise like this. A good antidote to students relying on AI to do all the work. While it's sad that AI is negatively impacting the classroom, it's good to see innovative "analog" pedagogical solutions to keep students engaged.

I’ve done this for 2 weeks now and it *absolutely rules*. Best class discussions I’ve ever had. Best engagement with readings. They write in this worksheet for 15 minutes, then talk about their responses in groups of 3-4, then groups share with the whole class, and *then* we talk about the readings
Updating my comparative public admin seminar class—which was decimated by AI last year—to maybe be a little more LLM-proof by adding a 20–30 minute start-of-class writing & discussion activity. Will it work? Who knows! Full details and PDF here: governancef25.classes.andrewheiss.com/assignment/c...
September 5, 2025 at 6:49 AM
If I were still teaching or if I go back to it, I'd use an exercise like this. A good antidote to students relying on AI to do all the work. While it's sad that AI is negatively impacting the classroom, it's good to see innovative "analog" pedagogical solutions to keep students engaged.

Worth a check to see if any of your work has been hoovered up to train Anthropic models. The Atlantic story has a link to search Libgen. If you have pirated work, you can join the class action if you like by following the link in the 2nd post.

There are tons of graphic novels, academic papers, film and TV scripts, & prose novels/nonfiction on the LibGen list Anthropic used.
As settlement approaches, make it easy for the class action lawyers to contact you! Here’s how
Part 1: is your work in Libgen?
www.theatlantic.com/technology/a...
As settlement approaches, make it easy for the class action lawyers to contact you! Here’s how
Part 1: is your work in Libgen?
www.theatlantic.com/technology/a...

Search LibGen, the Pirated-Books Database That Meta Used to Train AI
Millions of books and scientific papers are captured in the collection’s current iteration.
www.theatlantic.com
August 28, 2025 at 11:27 AM
Worth a check to see if any of your work has been hoovered up to train Anthropic models. The Atlantic story has a link to search Libgen. If you have pirated work, you can join the class action if you like by following the link in the 2nd post.
What's the value of contributing to the #30DayChartChallenge ?
I took a moment for self-reflection to think about that & put it into a new post on the blog
www.gregdubrow.io/posts/lesson...
Thoughts on improving my #rstats & #dataviz skills, learning more about education in 🇩🇰 & lots more.. 1/
I took a moment for self-reflection to think about that & put it into a new post on the blog
www.gregdubrow.io/posts/lesson...
Thoughts on improving my #rstats & #dataviz skills, learning more about education in 🇩🇰 & lots more.. 1/
May 16, 2025 at 11:16 AM
What's the value of contributing to the #30DayChartChallenge ?
I took a moment for self-reflection to think about that & put it into a new post on the blog
www.gregdubrow.io/posts/lesson...
Thoughts on improving my #rstats & #dataviz skills, learning more about education in 🇩🇰 & lots more.. 1/
I took a moment for self-reflection to think about that & put it into a new post on the blog
www.gregdubrow.io/posts/lesson...
Thoughts on improving my #rstats & #dataviz skills, learning more about education in 🇩🇰 & lots more.. 1/
Had a fun time presenting on social sciences data analysis to the CopenhagenR meetup group this week.
Slides are here: greg-dubrow.github.io/copenhagenR-...
If you're into #rstats & #dataviz the CPH r group is a hyggeligt & informative space. Come to the meetups & even better, present something!
Slides are here: greg-dubrow.github.io/copenhagenR-...
If you're into #rstats & #dataviz the CPH r group is a hyggeligt & informative space. Come to the meetups & even better, present something!
copenhagenR-May2025-slides – copenhagenr-may2025-slides
greg-dubrow.github.io
May 15, 2025 at 10:59 AM
Had a fun time presenting on social sciences data analysis to the CopenhagenR meetup group this week.
Slides are here: greg-dubrow.github.io/copenhagenR-...
If you're into #rstats & #dataviz the CPH r group is a hyggeligt & informative space. Come to the meetups & even better, present something!
Slides are here: greg-dubrow.github.io/copenhagenR-...
If you're into #rstats & #dataviz the CPH r group is a hyggeligt & informative space. Come to the meetups & even better, present something!
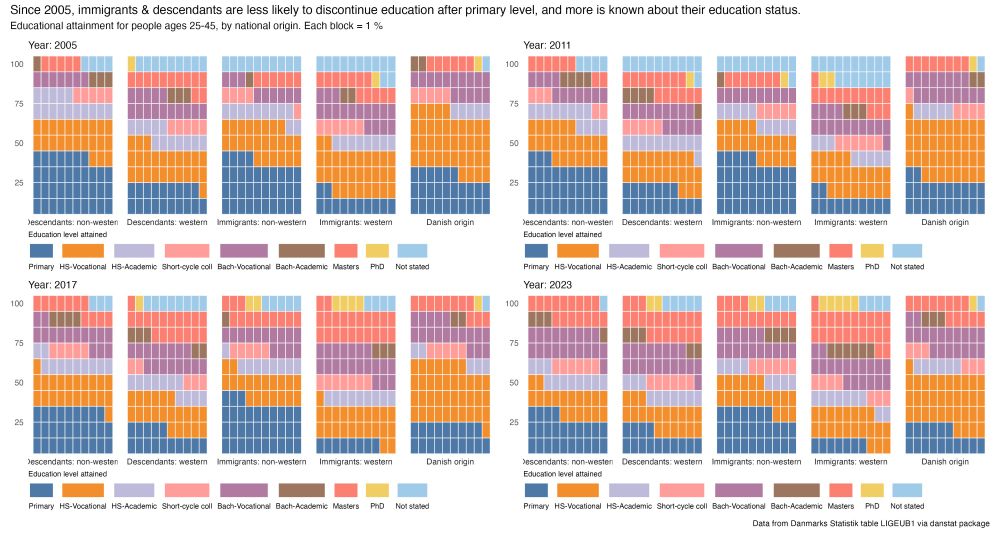
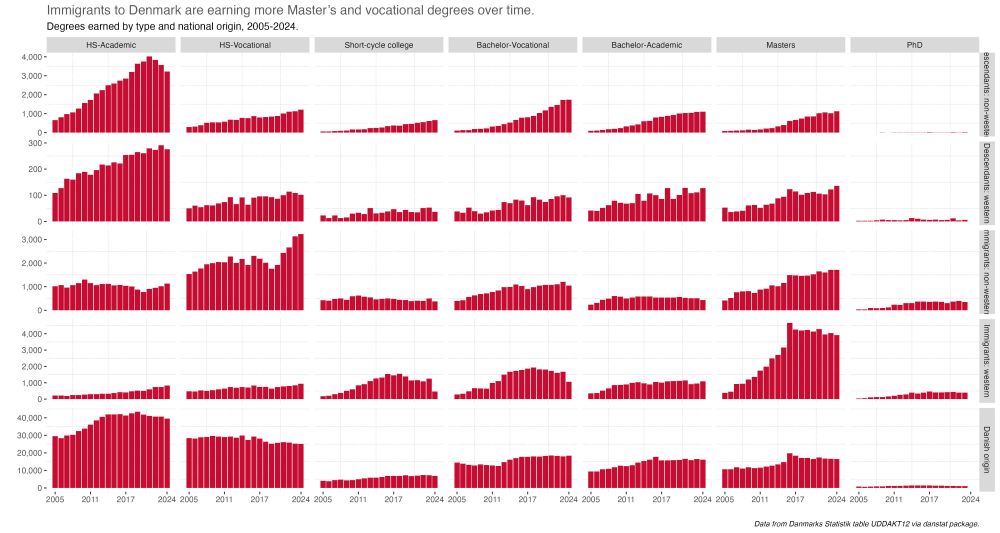
A bit late for my last #30DayChartChallenge some #rstats #dataviz for day 28's prompt - inclusion. Looking at the immigrant experience in the 🇩🇰 education system
tl/dr is more attainment beyond primary level & immigrants rely on vocational degs for social mobility
www.gregdubrow.io/posts/30-day...
tl/dr is more attainment beyond primary level & immigrants rely on vocational degs for social mobility
www.gregdubrow.io/posts/30-day...
May 6, 2025 at 11:22 AM
A bit late for my last #30DayChartChallenge some #rstats #dataviz for day 28's prompt - inclusion. Looking at the immigrant experience in the 🇩🇰 education system
tl/dr is more attainment beyond primary level & immigrants rely on vocational degs for social mobility
www.gregdubrow.io/posts/30-day...
tl/dr is more attainment beyond primary level & immigrants rely on vocational degs for social mobility
www.gregdubrow.io/posts/30-day...
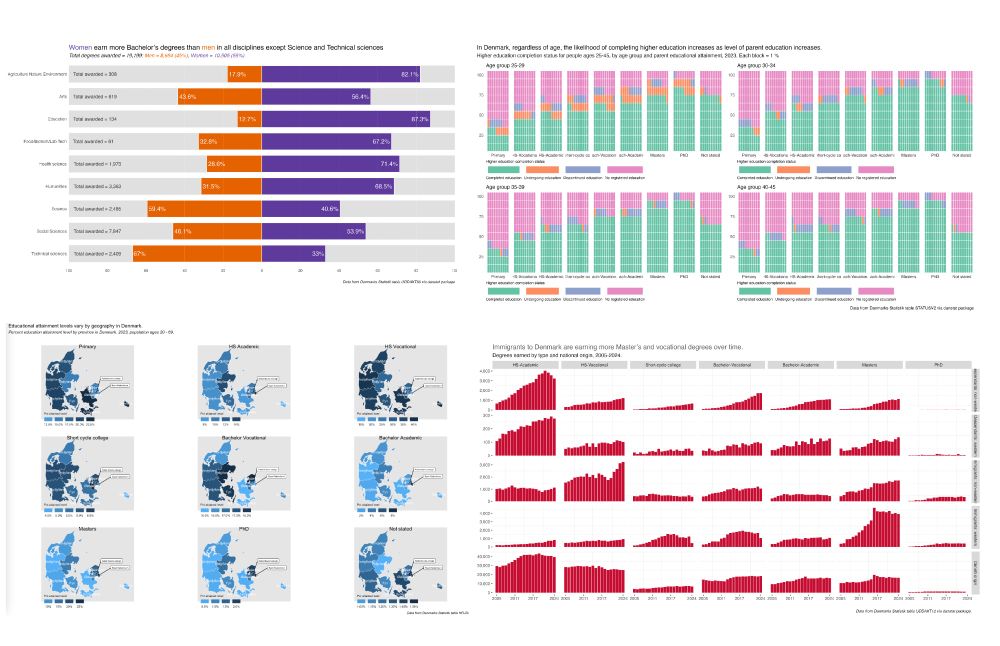
What is educ attainment by province in 🇩🇰? See this (late) post for #30DayChartChallenge prompt 18 El Pais *
#dataviz is maps plotting % by province **. I reused code from a 2024 post, w/ interactivity via g🦒 📦
#rstats data -> 🇩🇰s Statistik via danstat 📦
Full post www.gregdubrow.io/posts/30-day...
#dataviz is maps plotting % by province **. I reused code from a 2024 post, w/ interactivity via g🦒 📦
#rstats data -> 🇩🇰s Statistik via danstat 📦
Full post www.gregdubrow.io/posts/30-day...

April 27, 2025 at 10:23 AM
What is educ attainment by province in 🇩🇰? See this (late) post for #30DayChartChallenge prompt 18 El Pais *
#dataviz is maps plotting % by province **. I reused code from a 2024 post, w/ interactivity via g🦒 📦
#rstats data -> 🇩🇰s Statistik via danstat 📦
Full post www.gregdubrow.io/posts/30-day...
#dataviz is maps plotting % by province **. I reused code from a 2024 post, w/ interactivity via g🦒 📦
#rstats data -> 🇩🇰s Statistik via danstat 📦
Full post www.gregdubrow.io/posts/30-day...
The #30DayChartChallenge prompts 24 & 25, @who.int & risk
For no particular reason, looking at measles vax rates worldwide. #dataviz in #rstats using rgho 📦
More details in post, but messy data in early 2000s & not sold on design choice for Euro subregion plot
www.gregdubrow.io/posts/30-day...
For no particular reason, looking at measles vax rates worldwide. #dataviz in #rstats using rgho 📦
More details in post, but messy data in early 2000s & not sold on design choice for Euro subregion plot
www.gregdubrow.io/posts/30-day...

April 26, 2025 at 9:26 AM
The #30DayChartChallenge prompts 24 & 25, @who.int & risk
For no particular reason, looking at measles vax rates worldwide. #dataviz in #rstats using rgho 📦
More details in post, but messy data in early 2000s & not sold on design choice for Euro subregion plot
www.gregdubrow.io/posts/30-day...
For no particular reason, looking at measles vax rates worldwide. #dataviz in #rstats using rgho 📦
More details in post, but messy data in early 2000s & not sold on design choice for Euro subregion plot
www.gregdubrow.io/posts/30-day...
A #30DayChartChallenge prompt 23 log scales post turns into a post about gender pay gap in 🇩🇰
#dataviz #rstats via danstat 📦
Sadly pay gaps is common, even in countries like 🇩🇰 w/ wage equality laws & good unions.
Digging deeper by deg type, still a gap. More at:
www.gregdubrow.io/posts/30-day...
#dataviz #rstats via danstat 📦
Sadly pay gaps is common, even in countries like 🇩🇰 w/ wage equality laws & good unions.
Digging deeper by deg type, still a gap. More at:
www.gregdubrow.io/posts/30-day...

April 25, 2025 at 10:33 AM
A #30DayChartChallenge prompt 23 log scales post turns into a post about gender pay gap in 🇩🇰
#dataviz #rstats via danstat 📦
Sadly pay gaps is common, even in countries like 🇩🇰 w/ wage equality laws & good unions.
Digging deeper by deg type, still a gap. More at:
www.gregdubrow.io/posts/30-day...
#dataviz #rstats via danstat 📦
Sadly pay gaps is common, even in countries like 🇩🇰 w/ wage equality laws & good unions.
Digging deeper by deg type, still a gap. More at:
www.gregdubrow.io/posts/30-day...
Reposted by Gregers Kristian Kjerulf

📊 #30DayChartChallenge: Steven Ponce’s Contributions
Looking for inspiration? This repo is packed with creative, reproducible R visualizations across themes. A great place to spark your next #dataviz idea!
🔗 buff.ly/FzjGzmm
More R resources 👉 buff.ly/MSQa1kh
#RStats
Looking for inspiration? This repo is packed with creative, reproducible R visualizations across themes. A great place to spark your next #dataviz idea!
🔗 buff.ly/FzjGzmm
More R resources 👉 buff.ly/MSQa1kh
#RStats

GitHub - poncest/30DayChartChallenge: My contributions to the #30DayChartChllenge, #rstats edition
My contributions to the #30DayChartChllenge, #rstats edition - poncest/30DayChartChallenge
buff.ly
April 23, 2025 at 4:06 PM
📊 #30DayChartChallenge: Steven Ponce’s Contributions
Looking for inspiration? This repo is packed with creative, reproducible R visualizations across themes. A great place to spark your next #dataviz idea!
🔗 buff.ly/FzjGzmm
More R resources 👉 buff.ly/MSQa1kh
#RStats
Looking for inspiration? This repo is packed with creative, reproducible R visualizations across themes. A great place to spark your next #dataviz idea!
🔗 buff.ly/FzjGzmm
More R resources 👉 buff.ly/MSQa1kh
#RStats
Prompt 19 | #30DayChartChallenge | smooth
(yes, I did 20 yesterday & today should be prompt 23 🤷♂️)
It's time series #dataviz of bachelor degs in 🇩🇰, overall & by sex. #rstats using danstat 📦
Most interesting thing for me was tech science degs. Read more in the post:
www.gregdubrow.io/posts/30-day...
(yes, I did 20 yesterday & today should be prompt 23 🤷♂️)
It's time series #dataviz of bachelor degs in 🇩🇰, overall & by sex. #rstats using danstat 📦
Most interesting thing for me was tech science degs. Read more in the post:
www.gregdubrow.io/posts/30-day...

April 23, 2025 at 12:03 PM
Prompt 19 | #30DayChartChallenge | smooth
(yes, I did 20 yesterday & today should be prompt 23 🤷♂️)
It's time series #dataviz of bachelor degs in 🇩🇰, overall & by sex. #rstats using danstat 📦
Most interesting thing for me was tech science degs. Read more in the post:
www.gregdubrow.io/posts/30-day...
(yes, I did 20 yesterday & today should be prompt 23 🤷♂️)
It's time series #dataviz of bachelor degs in 🇩🇰, overall & by sex. #rstats using danstat 📦
Most interesting thing for me was tech science degs. Read more in the post:
www.gregdubrow.io/posts/30-day...
Prompt 20 | #30DayChartChallenge | urbanization
I wanted to see if more people were moving to larger urban areas & if they were more educated
The answers are yes & yes. More detail & #dataviz thoughts in the post
Data from 🇩🇰 Statistik via danstat 📦 for #rstats
www.gregdubrow.io/posts/30-day...
I wanted to see if more people were moving to larger urban areas & if they were more educated
The answers are yes & yes. More detail & #dataviz thoughts in the post
Data from 🇩🇰 Statistik via danstat 📦 for #rstats
www.gregdubrow.io/posts/30-day...

April 22, 2025 at 1:25 PM
Prompt 20 | #30DayChartChallenge | urbanization
I wanted to see if more people were moving to larger urban areas & if they were more educated
The answers are yes & yes. More detail & #dataviz thoughts in the post
Data from 🇩🇰 Statistik via danstat 📦 for #rstats
www.gregdubrow.io/posts/30-day...
I wanted to see if more people were moving to larger urban areas & if they were more educated
The answers are yes & yes. More detail & #dataviz thoughts in the post
Data from 🇩🇰 Statistik via danstat 📦 for #rstats
www.gregdubrow.io/posts/30-day...
If you like doing #rstats & #dataviz on social science data, come to my presentation at the May 14 CopenhagenR meetup.
I'll talk about APIs & 📦s & show examples from Danmarks Statistik StatBank.
Location is PROSA offices, Vester Farimagsgade 37A in København
RSVP at www.meetup.com/copenhagenr-...
I'll talk about APIs & 📦s & show examples from Danmarks Statistik StatBank.
Location is PROSA offices, Vester Farimagsgade 37A in København
RSVP at www.meetup.com/copenhagenr-...

Easy Social Science Data Analysis in R, Wed, May 14, 2025, 6:00 PM | Meetup
*"Easy Social Science Data Analysis in R" presented by [Gregers Kjerulf Dubrow](https://www.linkedin.com/in/dubrowg/)*
**When?**
14th of May, 2025, Wednesday.
\* 17:30 - D
www.meetup.com
April 21, 2025 at 6:24 PM
If you like doing #rstats & #dataviz on social science data, come to my presentation at the May 14 CopenhagenR meetup.
I'll talk about APIs & 📦s & show examples from Danmarks Statistik StatBank.
Location is PROSA offices, Vester Farimagsgade 37A in København
RSVP at www.meetup.com/copenhagenr-...
I'll talk about APIs & 📦s & show examples from Danmarks Statistik StatBank.
Location is PROSA offices, Vester Farimagsgade 37A in København
RSVP at www.meetup.com/copenhagenr-...
My #30DayChartChallenge posts are no longer in order - here's prompt 13, clusters. It's R&D expenses by sector & field in 🇩🇰. The fun here was using the g🦒 #rstats 📦 to add tooltips to the #dataviz
Full post: www.gregdubrow.io/posts/30-day...
I likely won't get back on prompt schedule, but onward
Full post: www.gregdubrow.io/posts/30-day...
I likely won't get back on prompt schedule, but onward

April 21, 2025 at 10:59 AM
My #30DayChartChallenge posts are no longer in order - here's prompt 13, clusters. It's R&D expenses by sector & field in 🇩🇰. The fun here was using the g🦒 #rstats 📦 to add tooltips to the #dataviz
Full post: www.gregdubrow.io/posts/30-day...
I likely won't get back on prompt schedule, but onward
Full post: www.gregdubrow.io/posts/30-day...
I likely won't get back on prompt schedule, but onward
For #30DayChartChallenge prompt 15, complicated, I expanded on 14 to look at higher ed completion by age & parent ed levels in 🇩🇰. Age didn't matter... ↗️ education your parents have, more likely you are to finish college
🧇 charts #dataviz in #rstats
Full post at:
www.gregdubrow.io/posts/30-day...
🧇 charts #dataviz in #rstats
Full post at:
www.gregdubrow.io/posts/30-day...

April 20, 2025 at 11:19 AM
For #30DayChartChallenge prompt 15, complicated, I expanded on 14 to look at higher ed completion by age & parent ed levels in 🇩🇰. Age didn't matter... ↗️ education your parents have, more likely you are to finish college
🧇 charts #dataviz in #rstats
Full post at:
www.gregdubrow.io/posts/30-day...
🧇 charts #dataviz in #rstats
Full post at:
www.gregdubrow.io/posts/30-day...


Reposted by Gregers Kristian Kjerulf

📊 2025 #30DayChartChallenge | day 15 | relationships | complicated
.
🔗: stevenponce.netlify.app/data_visuali...
.
#rstats | #r4ds | #dataviz | #ggplot2
.
🔗: stevenponce.netlify.app/data_visuali...
.
#rstats | #r4ds | #dataviz | #ggplot2

April 15, 2025 at 8:54 AM
📊 2025 #30DayChartChallenge | day 15 | relationships | complicated
.
🔗: stevenponce.netlify.app/data_visuali...
.
#rstats | #r4ds | #dataviz | #ggplot2
.
🔗: stevenponce.netlify.app/data_visuali...
.
#rstats | #r4ds | #dataviz | #ggplot2
Reposted by Gregers Kristian Kjerulf

My entry for day 13 of #30DayChartChallenge: Clusters.
Not super insightful, but a nice way to brush up my statistical analysis skills.
Data: www.kaggle.com/datasets/sky...
Tools: R(base and ggplot), edited in Affinity Designer, and some help on the way from ChatGPT.
Not super insightful, but a nice way to brush up my statistical analysis skills.
Data: www.kaggle.com/datasets/sky...
Tools: R(base and ggplot), edited in Affinity Designer, and some help on the way from ChatGPT.

April 14, 2025 at 3:52 PM
My entry for day 13 of #30DayChartChallenge: Clusters.
Not super insightful, but a nice way to brush up my statistical analysis skills.
Data: www.kaggle.com/datasets/sky...
Tools: R(base and ggplot), edited in Affinity Designer, and some help on the way from ChatGPT.
Not super insightful, but a nice way to brush up my statistical analysis skills.
Data: www.kaggle.com/datasets/sky...
Tools: R(base and ggplot), edited in Affinity Designer, and some help on the way from ChatGPT.
Reposted by Gregers Kristian Kjerulf

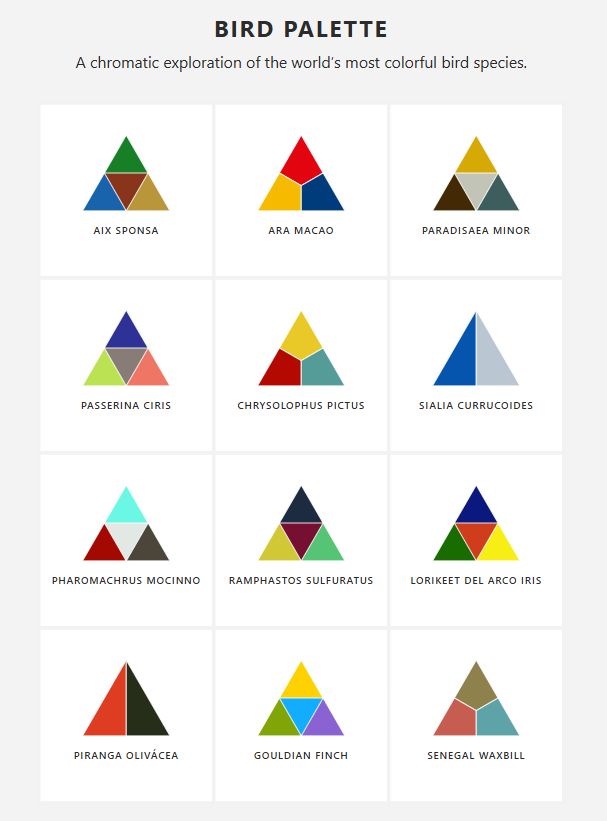
Day 17 of the #30DayChartChallenge! 📊
Today's theme: Birds 🐦✨
I turned plumage into palette 🎨 —
each triangle a feather, each square a species.
Nature’s own design system.
#DataViz #Charts #Graphane #Colors
See it here:
playground.graphane.dev/editor/gboz9...
Today's theme: Birds 🐦✨
I turned plumage into palette 🎨 —
each triangle a feather, each square a species.
Nature’s own design system.
#DataViz #Charts #Graphane #Colors
See it here:
playground.graphane.dev/editor/gboz9...
April 17, 2025 at 7:41 AM
Day 17 of the #30DayChartChallenge! 📊
Today's theme: Birds 🐦✨
I turned plumage into palette 🎨 —
each triangle a feather, each square a species.
Nature’s own design system.
#DataViz #Charts #Graphane #Colors
See it here:
playground.graphane.dev/editor/gboz9...
Today's theme: Birds 🐦✨
I turned plumage into palette 🎨 —
each triangle a feather, each square a species.
Nature’s own design system.
#DataViz #Charts #Graphane #Colors
See it here:
playground.graphane.dev/editor/gboz9...
Reposted by Gregers Kristian Kjerulf

Extremely loosely connected to the theme of #30DayChartChallenge #Day17-Birds, but the bird flu and its resulting egg prices made a more creative Easter hunt necessary, and if tariffs go up might deem the whole tradition basically kaboshed. 💥🥚💥
#dataviz #msjonesnyc
#dataviz #msjonesnyc

April 17, 2025 at 12:15 PM
Extremely loosely connected to the theme of #30DayChartChallenge #Day17-Birds, but the bird flu and its resulting egg prices made a more creative Easter hunt necessary, and if tariffs go up might deem the whole tradition basically kaboshed. 💥🥚💥
#dataviz #msjonesnyc
#dataviz #msjonesnyc
Was interrupted a bit, but back w/ a (late) #30DayChartChallenge post for Day 14: Kinship. For this #dataviz I did a #snakey plot to look at higher ed outcomes for people 25-45 depending on parent ed. As always in #rstats & data from Danmarks Statistik
Full post at www.gregdubrow.io/posts/30-day...
Full post at www.gregdubrow.io/posts/30-day...

April 18, 2025 at 1:01 PM
Was interrupted a bit, but back w/ a (late) #30DayChartChallenge post for Day 14: Kinship. For this #dataviz I did a #snakey plot to look at higher ed outcomes for people 25-45 depending on parent ed. As always in #rstats & data from Danmarks Statistik
Full post at www.gregdubrow.io/posts/30-day...
Full post at www.gregdubrow.io/posts/30-day...