

GC Data Analysis and Visualization
@gcdatavis.bsky.social
The M.S. Program in Data Analysis and Visualization @The Graduate Center, CUNY | Data Analysis | Data Study | Data Visualization | Data Ethics
Reposted by GC Data Analysis and Visualization

Congratulations to @gcdatavis.bsky.social master’s student Hyojin Yoo, who was named an elections data visualization developer at The Associated Press! www.ap.org/the-definiti...

Additions to AP Elections | The Associated Press
AP Elections announced several new additions to the team as The Associated Press continues to strengthen and grow one of its core services. With a history
www.ap.org
November 5, 2025 at 4:23 PM
Congratulations to @gcdatavis.bsky.social master’s student Hyojin Yoo, who was named an elections data visualization developer at The Associated Press! www.ap.org/the-definiti...
📣Just a reminder! Applications to join our M.S. Program in Data Analysis and Visualization for Spring 2026 enrollment are due tomorrow, Saturday, November 1st.

October 31, 2025 at 6:09 PM
📣Just a reminder! Applications to join our M.S. Program in Data Analysis and Visualization for Spring 2026 enrollment are due tomorrow, Saturday, November 1st.
Happening today!! See you all soon ☺️
#dataanalysis #datavisualization #gradschool #openhouse
The M.S. in Data Analysis and Visualization Program Open House is only a week away!
Prospective students interested in our program are welcome to join us via Zoom on Monday, October 6th from 6-7 PM.
The M.S. in Data Analysis and Visualization Program Open House is only a week away!
Prospective students interested in our program are welcome to join us via Zoom on Monday, October 6th from 6-7 PM.

October 6, 2025 at 1:46 PM
Happening today!! See you all soon ☺️
#dataanalysis #datavisualization #gradschool #openhouse
The M.S. in Data Analysis and Visualization Program Open House is only a week away!
Prospective students interested in our program are welcome to join us via Zoom on Monday, October 6th from 6-7 PM.
The M.S. in Data Analysis and Visualization Program Open House is only a week away!
Prospective students interested in our program are welcome to join us via Zoom on Monday, October 6th from 6-7 PM.
September 29, 2025 at 8:34 PM
#dataanalysis #datavisualization #gradschool #openhouse
The M.S. in Data Analysis and Visualization Program Open House is only a week away!
Prospective students interested in our program are welcome to join us via Zoom on Monday, October 6th from 6-7 PM.
The M.S. in Data Analysis and Visualization Program Open House is only a week away!
Prospective students interested in our program are welcome to join us via Zoom on Monday, October 6th from 6-7 PM.
Reposted by GC Data Analysis and Visualization

🚀 Book in progress: Spatial Data Visualization with tmap
A guide to creating thematic maps in R with the tmap package.
Covers everything from loading data to interactive and animated maps, with reproducible code.
Read online: tmap.geocompx.org
#rstats #rspatial #geocompx #gischat #maps
A guide to creating thematic maps in R with the tmap package.
Covers everything from loading data to interactive and animated maps, with reproducible code.
Read online: tmap.geocompx.org
#rstats #rspatial #geocompx #gischat #maps


September 14, 2025 at 1:01 PM
Reposted by GC Data Analysis and Visualization

A few days ago, amidst everything else, I pressed send on the book I've been working on (and off) for over a decade. It's still a long way from finished, but the final phase has begun. Watch for DATA BY DESIGN: FROM THE HISTORY OF VISUALIZATION TO THE FUTURE WE NEED in print and online in Fall 2026!

September 15, 2025 at 1:43 PM
A few days ago, amidst everything else, I pressed send on the book I've been working on (and off) for over a decade. It's still a long way from finished, but the final phase has begun. Watch for DATA BY DESIGN: FROM THE HISTORY OF VISUALIZATION TO THE FUTURE WE NEED in print and online in Fall 2026!
Reposted by GC Data Analysis and Visualization

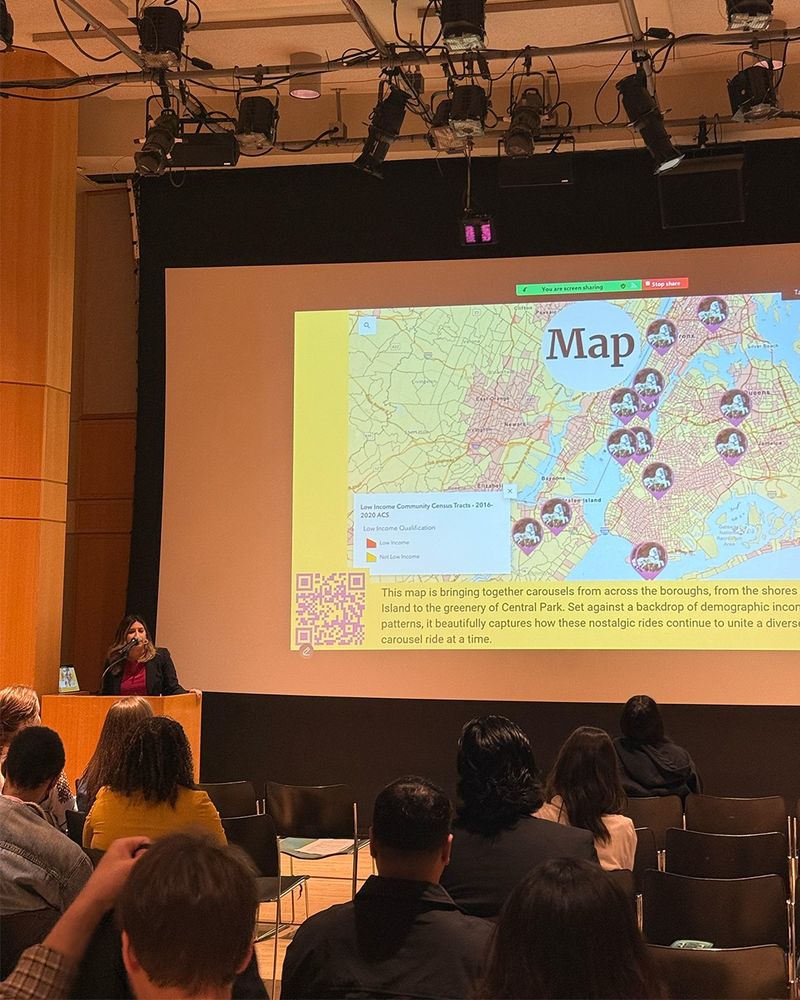
This interactive digital exhibit visualizes carousel locations throughout New York City and features practical information such as fee structures, neighborhood demographics, and more. Check out this wonderful project here: www.carouselsofnyc.com and find out more about the story of carousels in NYC.
Carousels of New York City
www.carouselsofnyc.com
August 20, 2025 at 9:35 PM
This interactive digital exhibit visualizes carousel locations throughout New York City and features practical information such as fee structures, neighborhood demographics, and more. Check out this wonderful project here: www.carouselsofnyc.com and find out more about the story of carousels in NYC.
Reposted by GC Data Analysis and Visualization
Last semester, Kelly Karst, Julissa Russo, Carla Ordonez, and Leonard Santos worked with Professor Bret Maney from our class Digital Humanities: Methods and Practices to develop this wonderful project, and successfully presented it at the CUNY Graduate Center Digital Showcase.
August 20, 2025 at 9:35 PM
Last semester, Kelly Karst, Julissa Russo, Carla Ordonez, and Leonard Santos worked with Professor Bret Maney from our class Digital Humanities: Methods and Practices to develop this wonderful project, and successfully presented it at the CUNY Graduate Center Digital Showcase.
Reposted by GC Data Analysis and Visualization
#digitalproject#digitalhumanities#datavisualization
Carousels of NYC🎠
What’s your first memory of carousels?
Carousels evoke joy and nostalgia, drawing people across diverse backgrounds, yet their placement is often restricted to wealthier neighborhoods, limiting accessibility for many communities.
Carousels of NYC🎠
What’s your first memory of carousels?
Carousels evoke joy and nostalgia, drawing people across diverse backgrounds, yet their placement is often restricted to wealthier neighborhoods, limiting accessibility for many communities.


August 20, 2025 at 9:35 PM
#digitalproject#digitalhumanities#datavisualization
Carousels of NYC🎠
What’s your first memory of carousels?
Carousels evoke joy and nostalgia, drawing people across diverse backgrounds, yet their placement is often restricted to wealthier neighborhoods, limiting accessibility for many communities.
Carousels of NYC🎠
What’s your first memory of carousels?
Carousels evoke joy and nostalgia, drawing people across diverse backgrounds, yet their placement is often restricted to wealthier neighborhoods, limiting accessibility for many communities.
Reposted by GC Data Analysis and Visualization

100 years of July temperature anomalies over land areas through 2025...
Data from NOAAGlobalTemp v6.0.0: www.ncei.noaa.gov/products/lan...
Data from NOAAGlobalTemp v6.0.0: www.ncei.noaa.gov/products/lan...
August 17, 2025 at 12:48 PM
100 years of July temperature anomalies over land areas through 2025...
Data from NOAAGlobalTemp v6.0.0: www.ncei.noaa.gov/products/lan...
Data from NOAAGlobalTemp v6.0.0: www.ncei.noaa.gov/products/lan...
Reposted by GC Data Analysis and Visualization
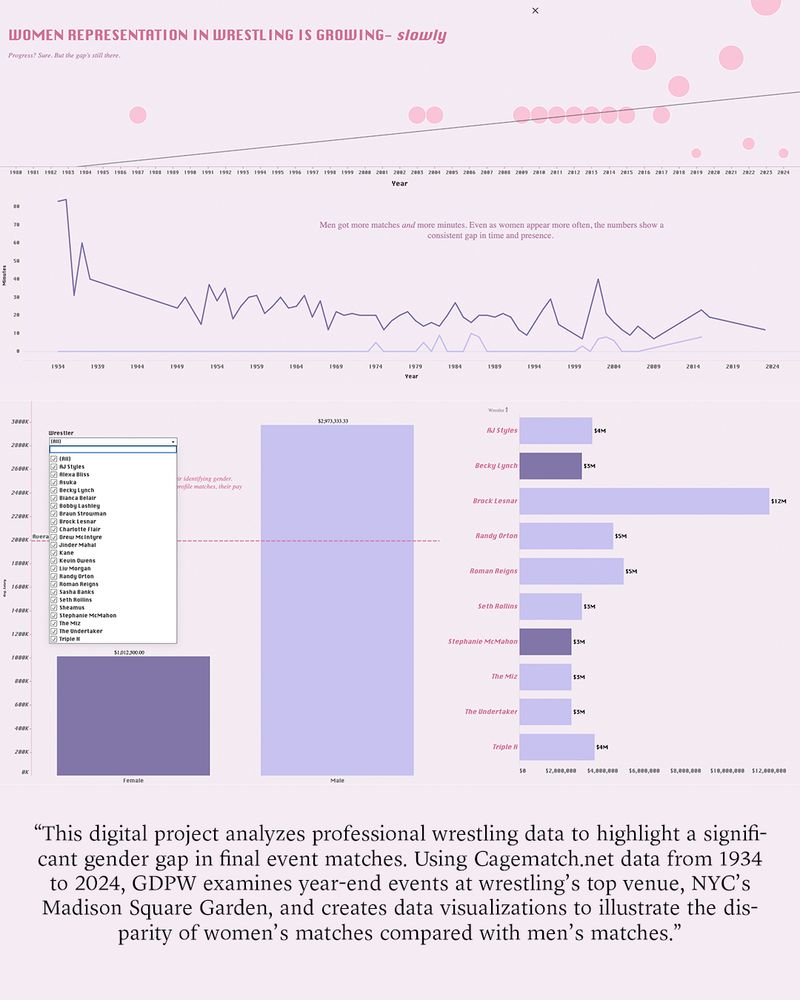
created data visualizations to illustrate the disparity of women’s matches compared with men’s matches. Check out this wonderful project here: gdprowres.com and see how rare women’s matches still are!
Gender Disparity In Professional – The numbers don't lie
gdprowres.com
August 13, 2025 at 9:03 PM
created data visualizations to illustrate the disparity of women’s matches compared with men’s matches. Check out this wonderful project here: gdprowres.com and see how rare women’s matches still are!
Reposted by GC Data Analysis and Visualization
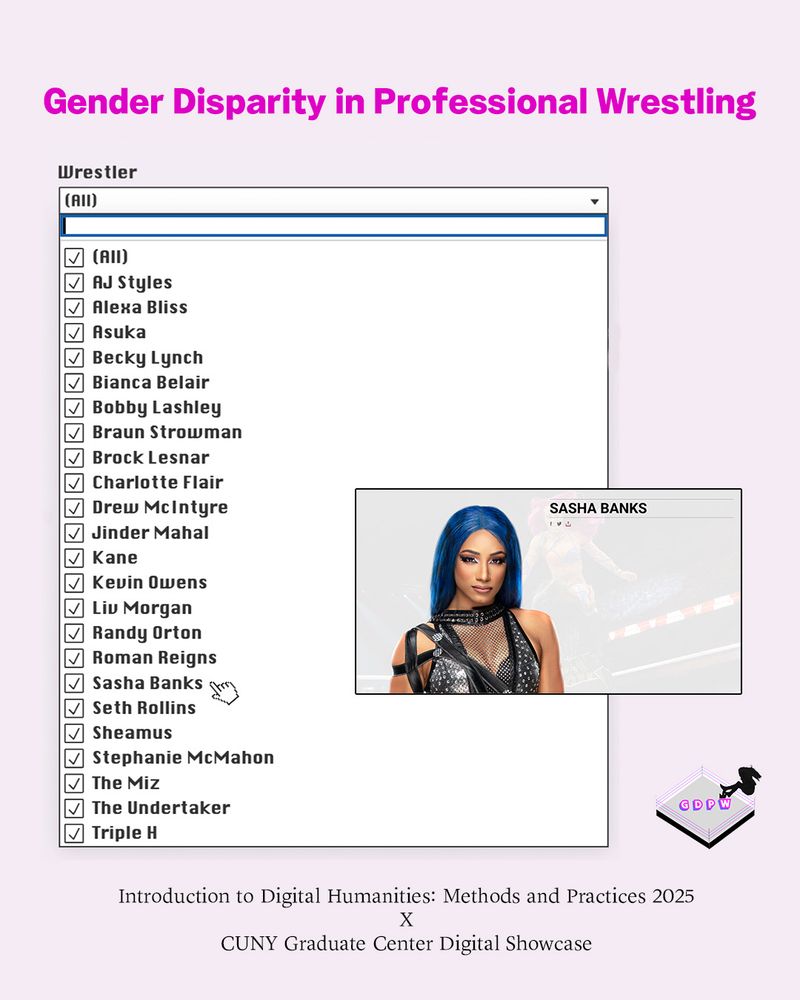
Women’s matches have been held since wrestling’s earliest days, but they have been and still are significantly underrepresented. Last semester, Martin Bueno, Cathy Melamed, Madison Watkins, and Elijah Nunez, working with Professor Bret Maney from our class Digital Humanities: Methods and Practices,
Gender Disparity In Professional – The numbers don't lie
gdprowres.com
August 13, 2025 at 9:03 PM
Women’s matches have been held since wrestling’s earliest days, but they have been and still are significantly underrepresented. Last semester, Martin Bueno, Cathy Melamed, Madison Watkins, and Elijah Nunez, working with Professor Bret Maney from our class Digital Humanities: Methods and Practices,
Reposted by GC Data Analysis and Visualization
#digitalproject#digitalhumanities
Gender Disparity in Professional Wrestling (GDPW) 🤼♀️
What are some of the greatest women's professional wrestling matches you've ever seen?
Professional wrestling has thrilled audiences for over a century, evolving from radio broadcasts to TV and digital streaming.
Gender Disparity in Professional Wrestling (GDPW) 🤼♀️
What are some of the greatest women's professional wrestling matches you've ever seen?
Professional wrestling has thrilled audiences for over a century, evolving from radio broadcasts to TV and digital streaming.
August 13, 2025 at 9:03 PM
#digitalproject#digitalhumanities
Gender Disparity in Professional Wrestling (GDPW) 🤼♀️
What are some of the greatest women's professional wrestling matches you've ever seen?
Professional wrestling has thrilled audiences for over a century, evolving from radio broadcasts to TV and digital streaming.
Gender Disparity in Professional Wrestling (GDPW) 🤼♀️
What are some of the greatest women's professional wrestling matches you've ever seen?
Professional wrestling has thrilled audiences for over a century, evolving from radio broadcasts to TV and digital streaming.
Reposted by GC Data Analysis and Visualization
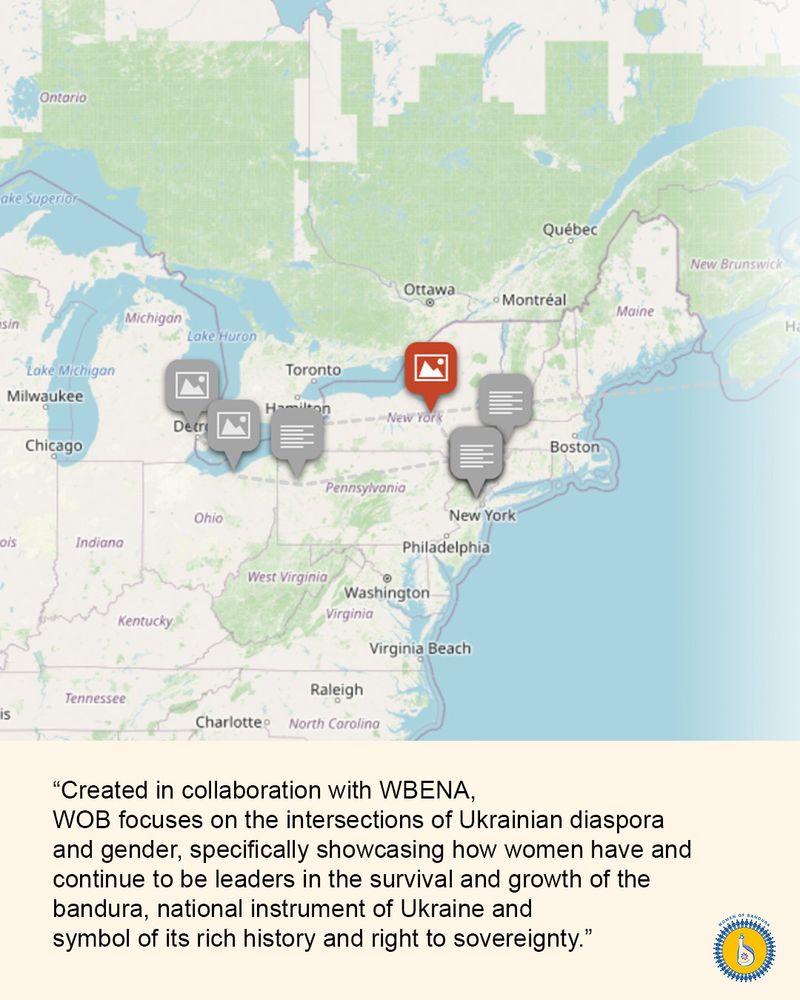
Check out this wonderful project here: womenofbandura.github.io/women-of-ban... and see how the WOB is educating new generations of bandura players in the U.S.!
Women of Bandura - North America | Women of Bandura - North America
womenofbandura.github.io
August 6, 2025 at 9:19 PM
Check out this wonderful project here: womenofbandura.github.io/women-of-ban... and see how the WOB is educating new generations of bandura players in the U.S.!
Reposted by GC Data Analysis and Visualization
Last semester, @womenofbandura.bsky.social team from our class Digital Humanities: Methods and Practices developed this digital archive project. Created in collaboration with WBENA, the project highlights the contribution of women, who were traditionally excluded from playing the bandura.
August 6, 2025 at 9:19 PM
Last semester, @womenofbandura.bsky.social team from our class Digital Humanities: Methods and Practices developed this digital archive project. Created in collaboration with WBENA, the project highlights the contribution of women, who were traditionally excluded from playing the bandura.
Reposted by GC Data Analysis and Visualization
Women of Bandura🎵
What is the name of the instrument that has been synonymous with Ukrainian identity? Hints are in the image!
Women have and continue to play a vital role in advancing the rich history represented by the instrument that has been synonymous with Ukrainian identity.
What is the name of the instrument that has been synonymous with Ukrainian identity? Hints are in the image!
Women have and continue to play a vital role in advancing the rich history represented by the instrument that has been synonymous with Ukrainian identity.

August 6, 2025 at 9:19 PM
Women of Bandura🎵
What is the name of the instrument that has been synonymous with Ukrainian identity? Hints are in the image!
Women have and continue to play a vital role in advancing the rich history represented by the instrument that has been synonymous with Ukrainian identity.
What is the name of the instrument that has been synonymous with Ukrainian identity? Hints are in the image!
Women have and continue to play a vital role in advancing the rich history represented by the instrument that has been synonymous with Ukrainian identity.
Reposted by GC Data Analysis and Visualization

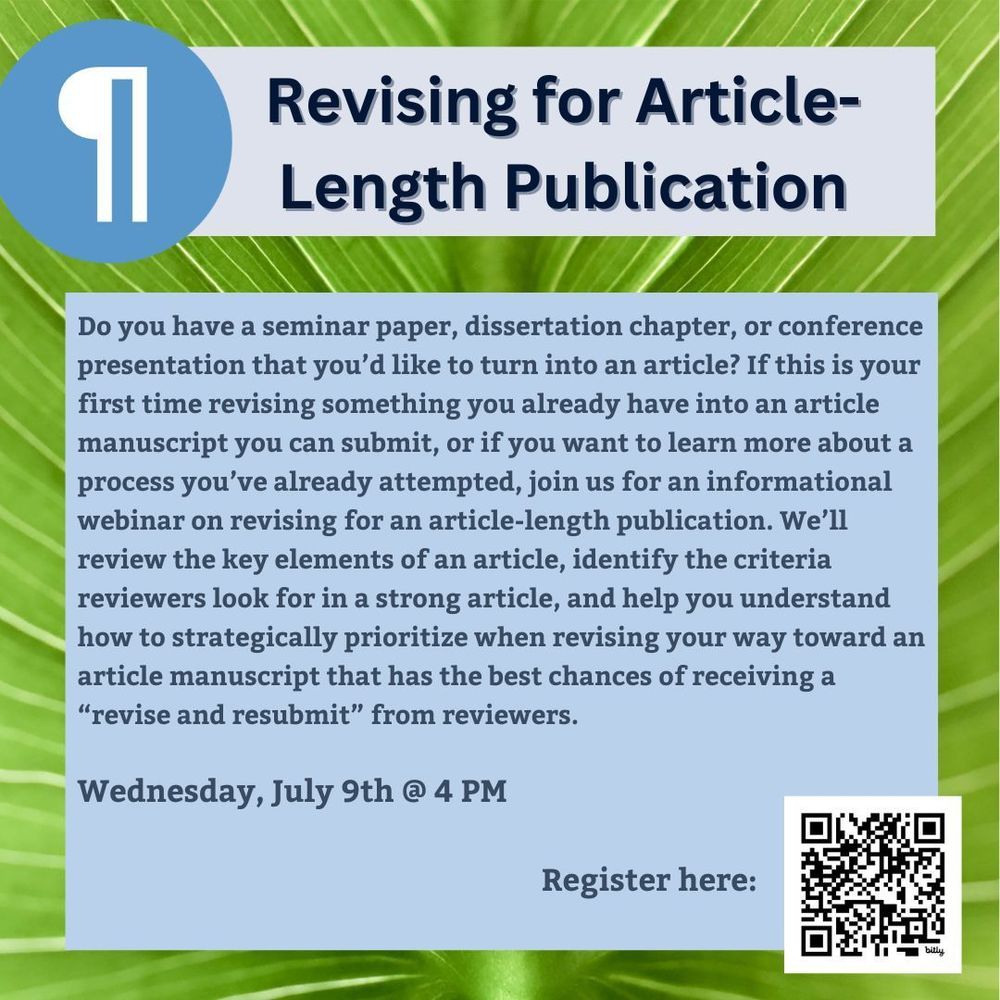
Academic writers often revise existing work to produce articles, a task that means asking challenging questions about structure and content. Join us next week for a workshop @thegraduatecenter.bsky.social that will help get you started! Use the QR code below or go to our website: buff.ly/AU3u8Re
July 2, 2025 at 1:10 PM
Academic writers often revise existing work to produce articles, a task that means asking challenging questions about structure and content. Join us next week for a workshop @thegraduatecenter.bsky.social that will help get you started! Use the QR code below or go to our website: buff.ly/AU3u8Re
Reposted by GC Data Analysis and Visualization
🚀 Encounters in the Milky Way is based on authentic data from the European Space Agency’s Gaia mission, which mapped ~2 billion stars in our galaxy. Book your tickets to explore the cosmos today: bit.ly/44KMGrc

Encounters in the Milky Way: Planetarium Space Show | AMNH
New Space Show Encounters in the Milky Way opens June 9, 2025.
bit.ly
June 9, 2025 at 3:37 PM
🚀 Encounters in the Milky Way is based on authentic data from the European Space Agency’s Gaia mission, which mapped ~2 billion stars in our galaxy. Book your tickets to explore the cosmos today: bit.ly/44KMGrc
Reposted by GC Data Analysis and Visualization

I wrote a piece on data visualization specifically with Observable JavaScript if of interest www.infoworld.com/article/2336...

Data visualization with Observable JavaScript
Learn how to make the most of Observable JavaScript and the Observable Plot library, including a step-by-step guide to eight basic data visualization tasks in Plot.
www.infoworld.com
June 30, 2025 at 2:03 AM
I wrote a piece on data visualization specifically with Observable JavaScript if of interest www.infoworld.com/article/2336...
Reposted by GC Data Analysis and Visualization
In the Data Analysis and Visualization master’s program, Sheryl Williams learned how to present complex data in an accessible, visually compelling manner, boosting her career. See what a master’s degree in Data Analysis and Visualization can do for you www.gc.cuny.edu/data-analysi...

May 25, 2025 at 12:12 PM
In the Data Analysis and Visualization master’s program, Sheryl Williams learned how to present complex data in an accessible, visually compelling manner, boosting her career. See what a master’s degree in Data Analysis and Visualization can do for you www.gc.cuny.edu/data-analysi...
Reposted by GC Data Analysis and Visualization
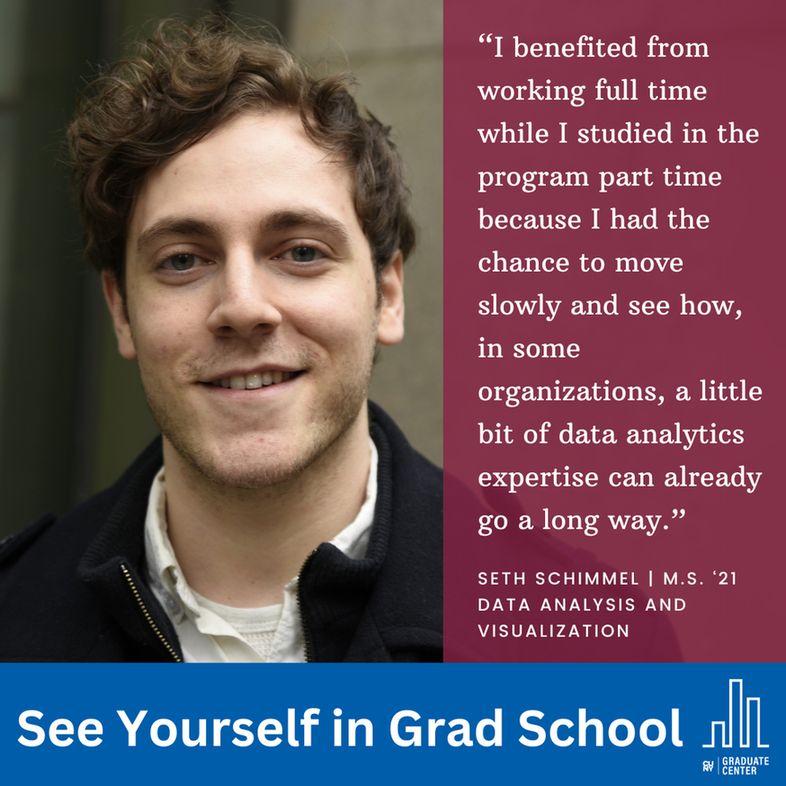
As a student in the Data Analysis and Visualization master’s program, Seth Schimmel learned how to communicate effectively with data. This helped him get hired as a data support associate. See what a master’s degree in Data Analysis and Visualization can do for you www.gc.cuny.edu/data-analysi...
May 18, 2025 at 12:02 PM
As a student in the Data Analysis and Visualization master’s program, Seth Schimmel learned how to communicate effectively with data. This helped him get hired as a data support associate. See what a master’s degree in Data Analysis and Visualization can do for you www.gc.cuny.edu/data-analysi...
Reposted by GC Data Analysis and Visualization

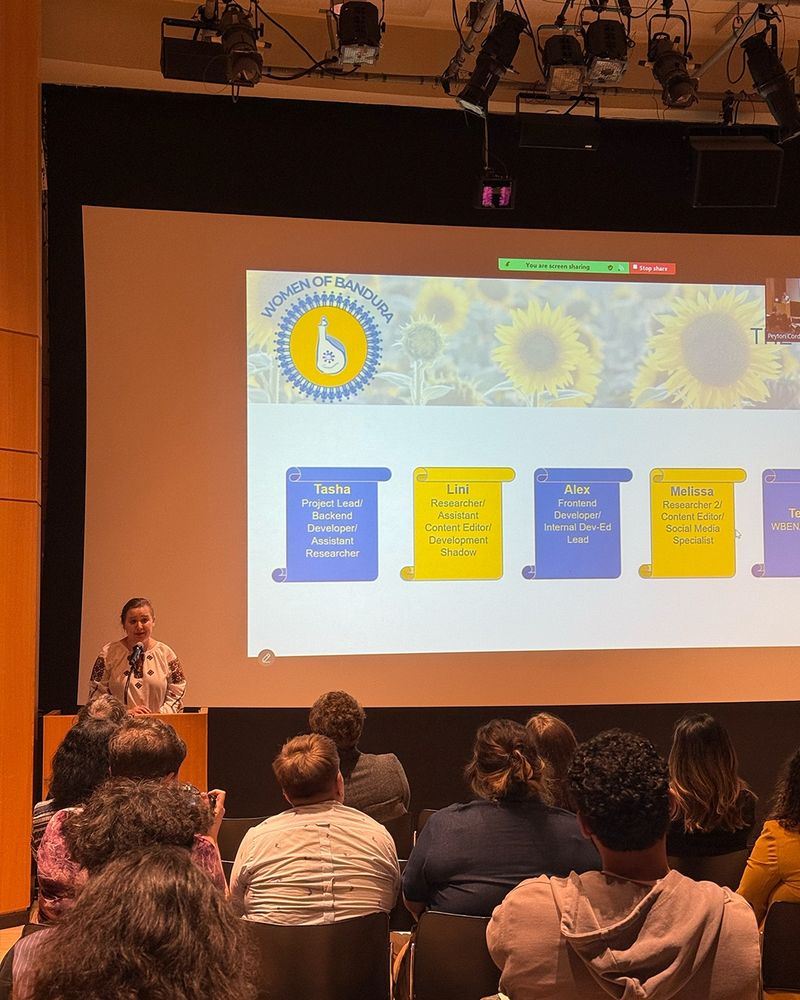
Earlier this week the team presented the first iteration of Women of Bandura at the CUNY GC Digital Showcase @gc-dh.bsky.social. Please check out the site and stay tuned for future updates! womenofbandura.github.io/women-of-ban...

May 16, 2025 at 1:37 AM
Earlier this week the team presented the first iteration of Women of Bandura at the CUNY GC Digital Showcase @gc-dh.bsky.social. Please check out the site and stay tuned for future updates! womenofbandura.github.io/women-of-ban...
Reposted by GC Data Analysis and Visualization
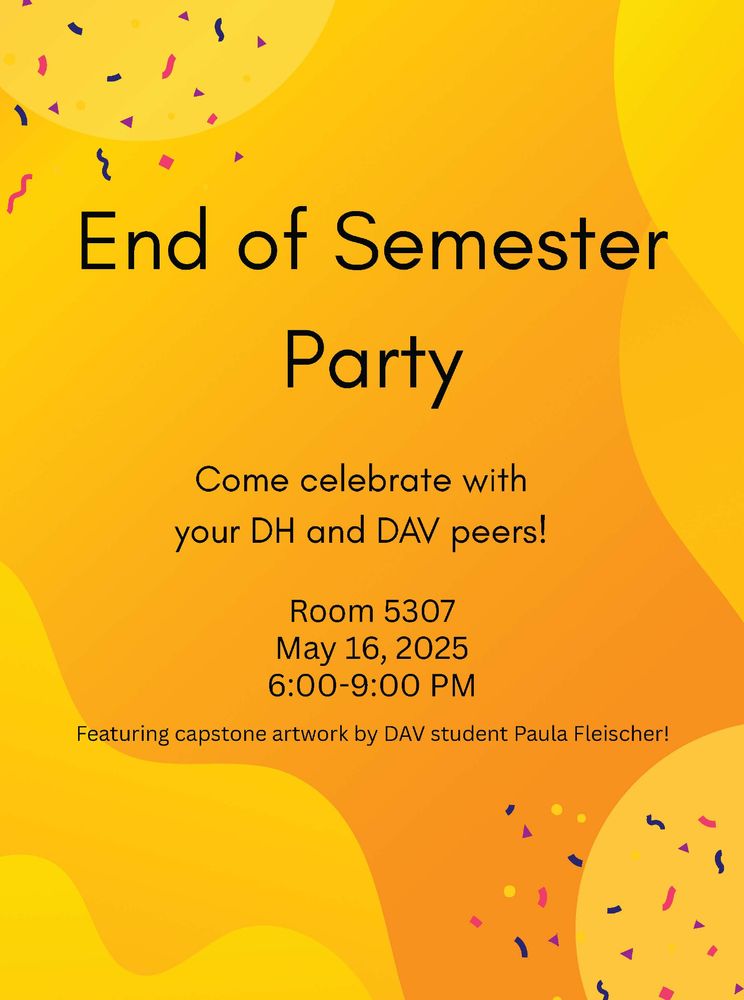
📊💽✏️We will gather to celebrate the scholarly and creative energy we have been full of this semester! Thank you to our community of students, faculty, alumni, and friends for making this semester amazing. Can't wait to see you all at 6:00PM-9:00PM in Room 5307 tomorrow🥳 @gcdatavis.bsky.social
May 16, 2025 at 1:20 AM
📊💽✏️We will gather to celebrate the scholarly and creative energy we have been full of this semester! Thank you to our community of students, faculty, alumni, and friends for making this semester amazing. Can't wait to see you all at 6:00PM-9:00PM in Room 5307 tomorrow🥳 @gcdatavis.bsky.social
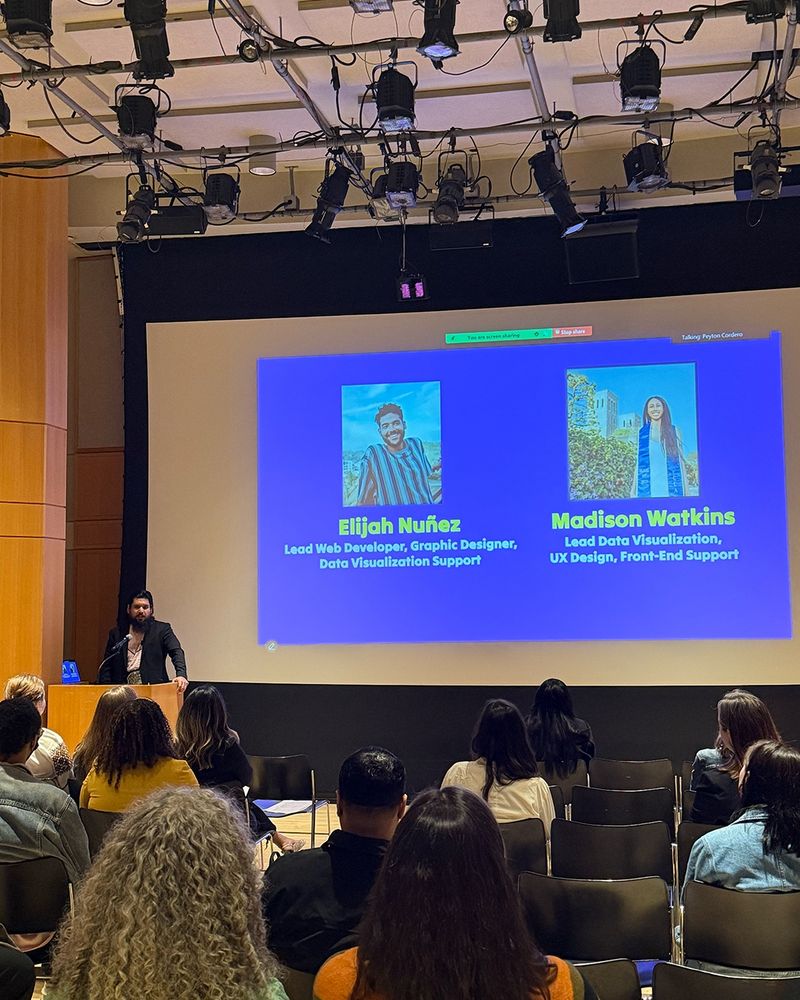
Three amazing teams from our M.A. in Digital Humanities Program @gc-dh.bsky.social and M.S. in Data Analysis and Visualization Program successfully presented at the GC Digital Showcase at Martin E. Segal Theatre Center!


May 15, 2025 at 3:31 PM
Three amazing teams from our M.A. in Digital Humanities Program @gc-dh.bsky.social and M.S. in Data Analysis and Visualization Program successfully presented at the GC Digital Showcase at Martin E. Segal Theatre Center!
Reposted by GC Data Analysis and Visualization
Kavya Beheraj joined the Data Analysis and Visualization program as a part-time student. That experience helped her land a job as a Visual Journalist at Axios. See what a master’s degree in Data Analysis and Visualization can do for you www.gc.cuny.edu/data-analysi...

May 11, 2025 at 12:41 PM
Kavya Beheraj joined the Data Analysis and Visualization program as a part-time student. That experience helped her land a job as a Visual Journalist at Axios. See what a master’s degree in Data Analysis and Visualization can do for you www.gc.cuny.edu/data-analysi...