


Fil
@fil.rezo.net
maps | data | code | journalism
#D3 & #Observable
👁️🗨️ https://observablehq.com/@fil
🌍 https://visionscarto.net/
#D3 & #Observable
👁️🗨️ https://observablehq.com/@fil
🌍 https://visionscarto.net/
I tried out A5 and I liked it
observablehq.com/@fil/a5-dggs
observablehq.com/@fil/a5-dggs

April 20, 2025 at 3:10 PM
I tried out A5 and I liked it
observablehq.com/@fil/a5-dggs
observablehq.com/@fil/a5-dggs
In the chart published today by the New York Times (Stocks Tumble as Investors Balk at Tariff Plan), “the orange bars indicate weekly losses from end of previous week”. How to do this with Plot?
observablehq.com/@recifs/week...
observablehq.com/@recifs/week...

April 5, 2025 at 7:35 AM
In the chart published today by the New York Times (Stocks Tumble as Investors Balk at Tariff Plan), “the orange bars indicate weekly losses from end of previous week”. How to do this with Plot?
observablehq.com/@recifs/week...
observablehq.com/@recifs/week...
Chew (from Atlanta) was playing in our village tonight. *Incredible* energy.
3dchew.com
3dchew.com

March 14, 2025 at 9:53 PM
Chew (from Atlanta) was playing in our village tonight. *Incredible* energy.
3dchew.com
3dchew.com
Added two inputs to the ternary plot utility
observablehq.com/@fil/linked-...
observablehq.com/@fil/linked-...

February 28, 2025 at 7:40 AM
Added two inputs to the ternary plot utility
observablehq.com/@fil/linked-...
observablehq.com/@fil/linked-...

the shape becomes quite slanted when you show it over Paris

January 14, 2025 at 8:09 PM
the shape becomes quite slanted when you show it over Paris

January 8, 2025 at 9:23 PM


@reka.visionscarto.net and I have used the Imago projection, designed by Justin Kunimune, for a map of early human migrations in @soniashah.bsky.social’s book “The Next Great Migration” (2020)
www.visionscarto.net/peopling-the...
www.visionscarto.net/peopling-the...

November 26, 2024 at 1:56 PM
@reka.visionscarto.net and I have used the Imago projection, designed by Justin Kunimune, for a map of early human migrations in @soniashah.bsky.social’s book “The Next Great Migration” (2020)
www.visionscarto.net/peopling-the...
www.visionscarto.net/peopling-the...
#30DayMapChallenge today is map projections!
You could try one of these with #D3.js
d3.observablehq.cloud/d3-geo-polyg...
You could try one of these with #D3.js
d3.observablehq.cloud/d3-geo-polyg...

November 26, 2024 at 1:56 PM
#30DayMapChallenge today is map projections!
You could try one of these with #D3.js
d3.observablehq.cloud/d3-geo-polyg...
You could try one of these with #D3.js
d3.observablehq.cloud/d3-geo-polyg...
love this difference chart

November 25, 2024 at 11:39 AM
love this difference chart
would it help to add axes? the shape is quite off-center

November 13, 2024 at 10:18 AM
would it help to add axes? the shape is quite off-center
I just released v2.0.0 of d3-geo-polygon — just in time for the #30DayMapChallenge
New projections, new documentation & lots of other changes, see details here:
github.com/d3/d3-geo-po...
New projections, new documentation & lots of other changes, see details here:
github.com/d3/d3-geo-po...


November 2, 2024 at 2:53 PM
I just released v2.0.0 of d3-geo-polygon — just in time for the #30DayMapChallenge
New projections, new documentation & lots of other changes, see details here:
github.com/d3/d3-geo-po...
New projections, new documentation & lots of other changes, see details here:
github.com/d3/d3-geo-po...
I was ★★ by this very simple and yet powerful interaction pattern that the NYT made on their election polls page; I knew I had to reproduce it. Lots of small details to figure out… now it's available as a reusable options transform for Observable Plot.
observablehq.com/@observableh...
observablehq.com/@observableh...
September 24, 2024 at 3:22 PM
I was ★★ by this very simple and yet powerful interaction pattern that the NYT made on their election polls page; I knew I had to reproduce it. Lots of small details to figure out… now it's available as a reusable options transform for Observable Plot.
observablehq.com/@observableh...
observablehq.com/@observableh...
I started using #D3js because as an aspiring cartographer I wanted to use the Bertin projection, and it didn't exist. I thought it would be a week-end project. Ten years later, still working on it.

September 12, 2024 at 5:39 PM
I started using #D3js because as an aspiring cartographer I wanted to use the Bertin projection, and it didn't exist. I thought it would be a week-end project. Ten years later, still working on it.
Hello #dataviz friends! What do you think of little explainers like this one?
observablehq.com/@fil/benchma...
yay? nay? boring?
observablehq.com/@fil/benchma...
yay? nay? boring?

September 10, 2024 at 9:44 AM
Hello #dataviz friends! What do you think of little explainers like this one?
observablehq.com/@fil/benchma...
yay? nay? boring?
observablehq.com/@fil/benchma...
yay? nay? boring?
Fixed a nasty bug in observablehq.com/@visionscart...
thanks to @harrystevens.bsky.social for spotting it and pairing !
thanks to @harrystevens.bsky.social for spotting it and pairing !

February 11, 2024 at 5:57 PM
Fixed a nasty bug in observablehq.com/@visionscart...
thanks to @harrystevens.bsky.social for spotting it and pairing !
thanks to @harrystevens.bsky.social for spotting it and pairing !
ESA’s climate office is launching “Little pictures” — a data visualization competition for simple images that tell a lot. Here's how to recreate one of their examples with Observable Plot
observablehq.com/@visionscart...
observablehq.com/@visionscart...

September 20, 2023 at 7:44 AM
ESA’s climate office is launching “Little pictures” — a data visualization competition for simple images that tell a lot. Here's how to recreate one of their examples with Observable Plot
observablehq.com/@visionscart...
observablehq.com/@visionscart...
Ever needed to make a ternary plot?
observablehq.com/@fil/ternary...
observablehq.com/@fil/ternary...

September 15, 2023 at 7:32 AM
Ever needed to make a ternary plot?
observablehq.com/@fil/ternary...
observablehq.com/@fil/ternary...
This val (#valtown) creates a #D3 chart — server-side — by using linkedom
www.val.town/v/fil.d3Chor...
www.val.town/v/fil.d3Chor...

September 14, 2023 at 5:21 PM
This val (#valtown) creates a #D3 chart — server-side — by using linkedom
www.val.town/v/fil.d3Chor...
www.val.town/v/fil.d3Chor...
This val uses Observable Plot to generate a map of earthquakes, server-side, from live data. The map is saved and updated on a daily basis, then served as a web page.
Code & details:
www.val.town/v/fil.earthq...
#valtown #observable #cartography
Code & details:
www.val.town/v/fil.earthq...
#valtown #observable #cartography

August 26, 2023 at 1:14 PM
This val uses Observable Plot to generate a map of earthquakes, server-side, from live data. The map is saved and updated on a daily basis, then served as a web page.
Code & details:
www.val.town/v/fil.earthq...
#valtown #observable #cartography
Code & details:
www.val.town/v/fil.earthq...
#valtown #observable #cartography
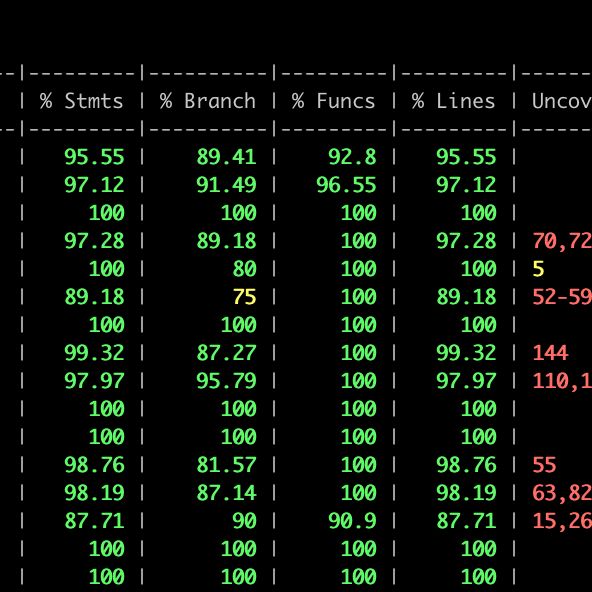
Observable Plot now has code coverage reports, and that makes me stupidly happy.
observablehq.com/plot/
observablehq.com/plot/
August 21, 2023 at 9:10 PM
Observable Plot now has code coverage reports, and that makes me stupidly happy.
observablehq.com/plot/
observablehq.com/plot/
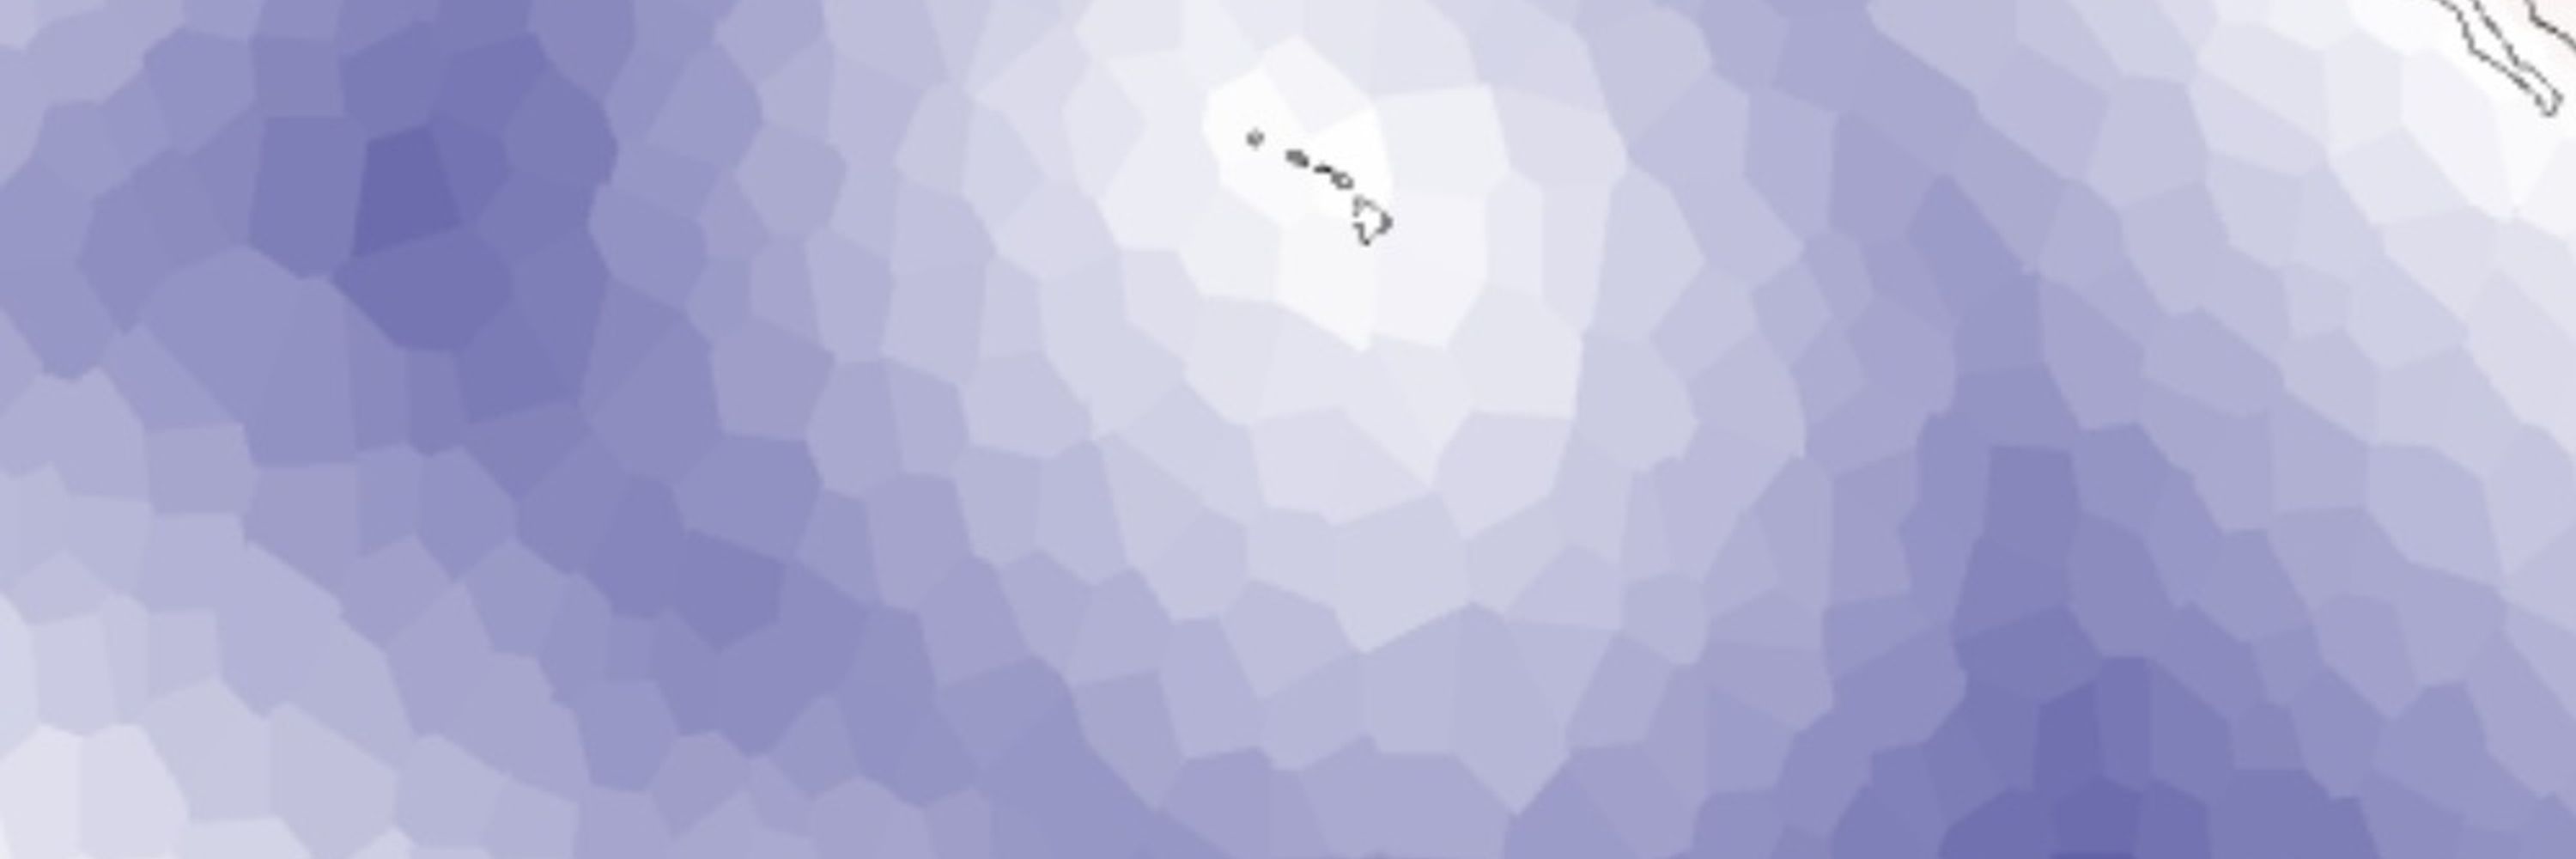
If you drift randomly from the north pole, where do you touch land?
#cartography #geo #spatial #interpolation #wos
https://observablehq.com/@visionscarto/spherical-wos
#cartography #geo #spatial #interpolation #wos
https://observablehq.com/@visionscarto/spherical-wos

August 20, 2023 at 10:14 AM
If you drift randomly from the north pole, where do you touch land?
#cartography #geo #spatial #interpolation #wos
https://observablehq.com/@visionscarto/spherical-wos
#cartography #geo #spatial #interpolation #wos
https://observablehq.com/@visionscarto/spherical-wos