


Enrico Bertini (FILWD)
@ebertini.bsky.social
FILWD on Substack: https://filwd.substack.com/. Weekly post on data visualization and beyond (quite some AI lately).
Data visualizer (teaching, researching, divulging, etc.) Faculty at Northeastern University. Italian. Father of 3.
Data visualizer (teaching, researching, divulging, etc.) Faculty at Northeastern University. Italian. Father of 3.
I wrote a post with my presentation/paper highlights from the fabulous IEEE VIS 2025 conference I attended two weeks ago in Vienna. This list is based exclusively on presentations I was able to attend. There are many more great papers! Let me know if there's anything you really like.

Presentation/Paper Highlights from IEEE VIS 2025
Presentations of papers that caught my eye last week in Vienna
arxiv.org
November 17, 2025 at 4:32 PM
I wrote a post with my presentation/paper highlights from the fabulous IEEE VIS 2025 conference I attended two weeks ago in Vienna. This list is based exclusively on presentations I was able to attend. There are many more great papers! Let me know if there's anything you really like.
I’ve compiled a list of papers in my newsletter to get up to speed with the latest research on generative AI for data visualization. I hope you'll find it useful! filwd.substack.com/p/a-reading-...

A Reading List on GenAI for Data Visualization
Enjoy the reading!
filwd.substack.com
September 8, 2025 at 7:40 PM
I’ve compiled a list of papers in my newsletter to get up to speed with the latest research on generative AI for data visualization. I hope you'll find it useful! filwd.substack.com/p/a-reading-...
I had a great chat with Richard Brath on the use of AI tools to visualize text data. Have you ever seen his experiments? Really fascinating! You can watch our chat on my Substack: filwd.substack.com/p/visualizin.... Make sure to check his fabulous blog posts too! richardbrath.wordpress.com.

Visualizing Text Data Using AI w/ Richard Brath
Exploring Richard's experiments on visualizing data with Claude AI
filwd.substack.com
May 12, 2025 at 9:01 AM
I had a great chat with Richard Brath on the use of AI tools to visualize text data. Have you ever seen his experiments? Really fascinating! You can watch our chat on my Substack: filwd.substack.com/p/visualizin.... Make sure to check his fabulous blog posts too! richardbrath.wordpress.com.
The slides for my free webinar on "Misleading Data Visualization" are ready! Join me this Monday, May 12, at 12 p.m. ET, to learn my framework for detecting misleading visualizations. (Find directions on how to enroll in the thread.)
May 7, 2025 at 9:15 PM
The slides for my free webinar on "Misleading Data Visualization" are ready! Join me this Monday, May 12, at 12 p.m. ET, to learn my framework for detecting misleading visualizations. (Find directions on how to enroll in the thread.)
Question: What process do you follow to add icons to your data visualizations, diagrams, tables, or infographics to convey a concept? I think icons can be very powerful to quickly orient people to the right information, but also incredibly hard to get right. What strategies and tools do you use?

April 2, 2025 at 4:42 PM
Question: What process do you follow to add icons to your data visualizations, diagrams, tables, or infographics to convey a concept? I think icons can be very powerful to quickly orient people to the right information, but also incredibly hard to get right. What strategies and tools do you use?
New experiment to see if ChatGPT can spot data interpretation errors in charts. I tried with four classic misleaders. It got two out of four right. See the details in my newsletter post.
What do you think? What else should I try?
What do you think? What else should I try?
Can LLMs Detect Reasoning Errors with Charts?
Yes and no.
open.substack.com
April 1, 2025 at 1:02 PM
New experiment to see if ChatGPT can spot data interpretation errors in charts. I tried with four classic misleaders. It got two out of four right. See the details in my newsletter post.
What do you think? What else should I try?
What do you think? What else should I try?
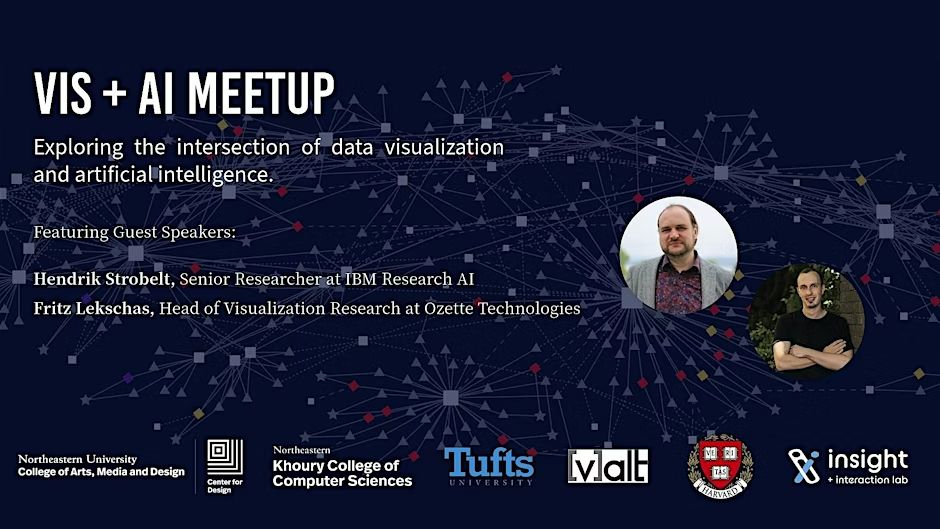
We are organizing a Vis+AI meetup at Northeastern University on April 3rd. Join us if you are in the area! P.s. We are trying to see if we can also stream the event online. www.eventbrite.com/e/visai-meet...
March 25, 2025 at 11:14 PM
We are organizing a Vis+AI meetup at Northeastern University on April 3rd. Join us if you are in the area! P.s. We are trying to see if we can also stream the event online. www.eventbrite.com/e/visai-meet...
What tool do you use to polish a visualization exported from a data visualization tool like Tableau, ggplot, etc. (say using SVG)? Is Illustrator the best solution, or is it something else?
February 21, 2025 at 12:26 AM
What tool do you use to polish a visualization exported from a data visualization tool like Tableau, ggplot, etc. (say using SVG)? Is Illustrator the best solution, or is it something else?
I started using Grok for the first time yesterday. Wow!!! Has anyone tried it? It feels like a completely different kind of dialogue. It's hard to put my finger on what it is exactly, but I am really impressed.
February 20, 2025 at 5:12 PM
I started using Grok for the first time yesterday. Wow!!! Has anyone tried it? It feels like a completely different kind of dialogue. It's hard to put my finger on what it is exactly, but I am really impressed.
I need your help: do you have examples of visualizations with before and after clutter reduction interventions? I remember seeing a few ones (some animated), but I can't recall where I saw them. Can you send me examples if you have any? Thanks!!! 🙏
February 17, 2025 at 10:04 PM
I need your help: do you have examples of visualizations with before and after clutter reduction interventions? I remember seeing a few ones (some animated), but I can't recall where I saw them. Can you send me examples if you have any? Thanks!!! 🙏
Are you a "data fiber artist" (representing data through knitting, crocheting, embroidery, sewing, weaving, etc.)? Please help my PhD student Sydney collect information about this fascinating practice for her thesis with this survey: skpurdue.github.io/DataFiberArts/.
Please repost! Thx!
Please repost! Thx!

January 28, 2025 at 8:17 PM
Are you a "data fiber artist" (representing data through knitting, crocheting, embroidery, sewing, weaving, etc.)? Please help my PhD student Sydney collect information about this fascinating practice for her thesis with this survey: skpurdue.github.io/DataFiberArts/.
Please repost! Thx!
Please repost! Thx!
Being invited to be part of an "important" committee.

replacing a laptop and losing the login names and password to all the university systems
January 15, 2025 at 1:58 AM
Being invited to be part of an "important" committee.
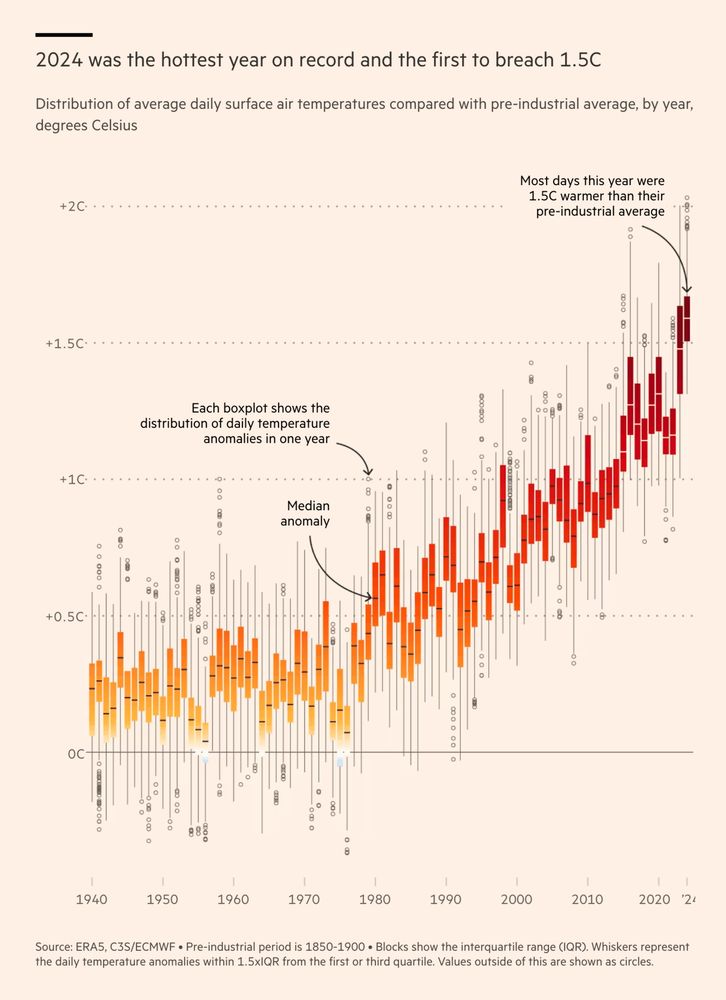
This plot is masterful. FT has become the best in news graphics, hands down.
Remarkable chart by @data.ft.com
Many readers won't fully understand boxplots. At a quick glance, they don't add much information here. But then, look at the lower end of the 2024 whisker (or 2015 for the previous El Niño)!
Also: I just love the aesthetic 🤩 #dataviz
www.ft.com/content/fd91...
Many readers won't fully understand boxplots. At a quick glance, they don't add much information here. But then, look at the lower end of the 2024 whisker (or 2015 for the previous El Niño)!
Also: I just love the aesthetic 🤩 #dataviz
www.ft.com/content/fd91...
January 15, 2025 at 1:56 AM
This plot is masterful. FT has become the best in news graphics, hands down.
Idea for a new focus app: you can unblock websites/apps only after conversing with a chatbot. If you manage to have a persuasive enough argument, you are granted access.
January 12, 2025 at 9:16 PM
Idea for a new focus app: you can unblock websites/apps only after conversing with a chatbot. If you manage to have a persuasive enough argument, you are granted access.
“… many of us become scientists to carve our own path, not become ruled by external demands.” Exactly👌

Trying to regulate the way science is done has always seemed wrongheaded to me for two reasons: (arrogance) reformers seem to think they know better how to do research than anyone else; (authoritarianism) many of us become scientists to carve our own path, not become ruled by external demands.
December 20, 2024 at 2:11 AM
“… many of us become scientists to carve our own path, not become ruled by external demands.” Exactly👌
Misinformation or misinterpretation? 10 contrasting assertions:

Misinformation Vs. Misinterpretation
In 10 contrasting assertions
buff.ly
December 17, 2024 at 9:30 AM
Misinformation or misinterpretation? 10 contrasting assertions:
Has anyone ever documented and tracked the evolution of a whole research project l, from ideation to publication and beyond? It would be cool to do it more systematically and really see how projects unfold over time. I am thinking of implementing this idea starting next year.
December 14, 2024 at 11:52 PM
Has anyone ever documented and tracked the evolution of a whole research project l, from ideation to publication and beyond? It would be cool to do it more systematically and really see how projects unfold over time. I am thinking of implementing this idea starting next year.
I wrote an initial post describing my growing discomfort with an excessive focus on publications in academia. Curious to hear your thoughts! https://buff.ly/4g47VXP

What If Papers Are Holding Us Back?
A popular LinkedIn post and my sense of discomfort with the state of academia.
buff.ly
December 10, 2024 at 11:00 AM
I wrote an initial post describing my growing discomfort with an excessive focus on publications in academia. Curious to hear your thoughts! https://buff.ly/4g47VXP
Second post on the use of titles in data visualization: https://buff.ly/3VizWmg. I propose a simple taxonomy to categorize different types of titles. It has already helped me and my students a lot. There is way more to do, but it's a good start. Happy to hear your feedback: any changes/additions?

Data Visualization Titles: A Taxonomy
An initial taxonomy on the type of titles you can use
buff.ly
December 2, 2024 at 2:55 PM
Second post on the use of titles in data visualization: https://buff.ly/3VizWmg. I propose a simple taxonomy to categorize different types of titles. It has already helped me and my students a lot. There is way more to do, but it's a good start. Happy to hear your feedback: any changes/additions?
How do you feel about the contrast between the certainty of the title and the uncertainty of the data (coming from a (single) simulation)? I have been thinking about titles and the ethics of uncertainty quite a bit lately. I am curious to hear what others think. 🤔

The global COVID-19 vaccination effort is estimated to have saved around 20 million lives — in just its first year.

November 29, 2024 at 10:25 PM
How do you feel about the contrast between the certainty of the title and the uncertainty of the data (coming from a (single) simulation)? I have been thinking about titles and the ethics of uncertainty quite a bit lately. I am curious to hear what others think. 🤔
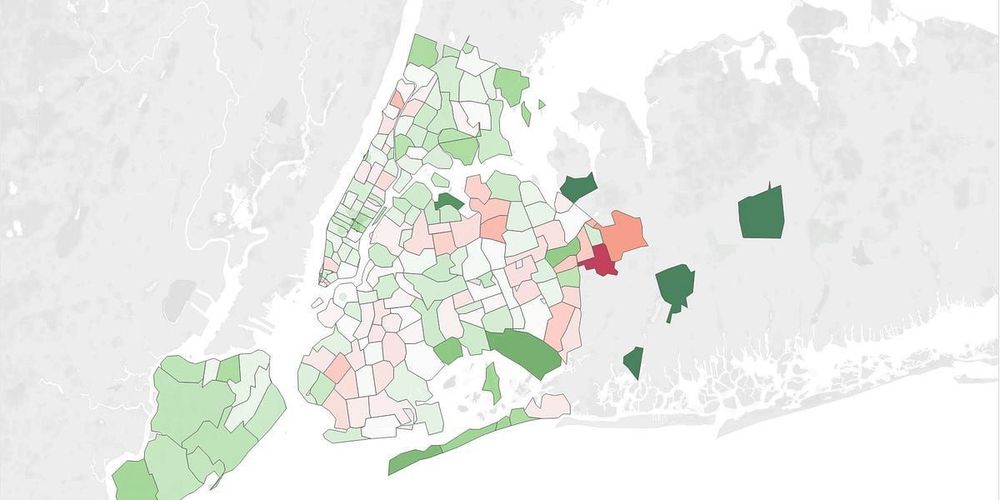
This is so well done and relevant! We don't talk so much about mobile vis, surprisingly.

Thread on charts for mobile phones 🤳 📊
I'm sharing a few tips from a recent project where we adapted our own charts, initially designed for a US letter sized report.
This is the cover page of the PDF report (the title was our suggestion 🖋️).
1/🧵
I'm sharing a few tips from a recent project where we adapted our own charts, initially designed for a US letter sized report.
This is the cover page of the PDF report (the title was our suggestion 🖋️).
1/🧵

November 28, 2024 at 1:53 PM
This is so well done and relevant! We don't talk so much about mobile vis, surprisingly.
I agree with Steve here. It's stark in its simplicity. It's so freaking easy. I made a mistake, sorry.

This is so simple but so important. If you make an error, fix it!
#SciComment
#SciComment
Those correction notices, in full. (Yes, it’s possible to directly admit and learn from error.)
statmodeling.stat.columbia.edu/2024/11/24/t...
statmodeling.stat.columbia.edu/2024/11/24/t...
November 24, 2024 at 5:43 PM
I agree with Steve here. It's stark in its simplicity. It's so freaking easy. I made a mistake, sorry.
Are we going to party again like 2010s? 🕺

Another must-follow in #dataViz

Hello @albertocairo.bsky.social here I am.
November 22, 2024 at 12:14 PM
Are we going to party again like 2010s? 🕺
I started a new series on using titles in visualization in my newsletter. The first post is on the empirical evidence. I review two papers that shed light on how titles shape interpretation and memory. filwd.substack.com/p/titles-in-...

Titles in Data Visualization: Empirical Evidence
Two studies that shed a light on the key role of titles in visualization
filwd.substack.com
November 22, 2024 at 12:12 PM
I started a new series on using titles in visualization in my newsletter. The first post is on the empirical evidence. I review two papers that shed light on how titles shape interpretation and memory. filwd.substack.com/p/titles-in-...
Being on X and Bluesky at the same time is an interesting (dissonant) experience. The cultural divide is, sadly, so stark.
November 21, 2024 at 1:42 PM
Being on X and Bluesky at the same time is an interesting (dissonant) experience. The cultural divide is, sadly, so stark.