


Donald Szlosek
@dszlosek.bsky.social
Biostatistician @IDEXX formerly at harvardmed, @BIDMChealth, @nasa. Big data, clinical trials, and medical diagnostics. Mainer. Opinions are my own. he/him
I have wondered about this exact thought! Superb. Also love the Genstat output
November 11, 2025 at 1:43 PM
I have wondered about this exact thought! Superb. Also love the Genstat output
It's a shame I didn't find this before Oct. 31st. And also a shame the term "Ghost-time bias" never caught on.

November 7, 2025 at 6:16 PM
It's a shame I didn't find this before Oct. 31st. And also a shame the term "Ghost-time bias" never caught on.
Probably the papers I share the most often are @f2harrell.bsky.social 1996 on how to effectively develop multivariate models and @benvancalster.bsky.social 2019 paper on Calibration. Both extremely well written and informative. What are you most shared stats paper? #statistics #statssky #academicsky

November 7, 2025 at 12:12 PM
Probably the papers I share the most often are @f2harrell.bsky.social 1996 on how to effectively develop multivariate models and @benvancalster.bsky.social 2019 paper on Calibration. Both extremely well written and informative. What are you most shared stats paper? #statistics #statssky #academicsky
This reminds me of a Penn & Teller quote related to the Gilbert-Shannon-Reeds model, where in 1955, they showed 7 "riffles" were needed to fully randomize a deck of cards. Below is a fascinating extension by Rick Wicklin showing how my riffles are required to restore a deck to its initial order

October 26, 2025 at 12:56 AM
This reminds me of a Penn & Teller quote related to the Gilbert-Shannon-Reeds model, where in 1955, they showed 7 "riffles" were needed to fully randomize a deck of cards. Below is a fascinating extension by Rick Wicklin showing how my riffles are required to restore a deck to its initial order
Robert Frost was certainly more familiar with iambic pentameter
than he was with estimated parameters, but in 1942 he wrote a couplet that sounds very much like a poet's perception of a confidence interval: #statistics #statssky #academicsky
than he was with estimated parameters, but in 1942 he wrote a couplet that sounds very much like a poet's perception of a confidence interval: #statistics #statssky #academicsky

October 24, 2025 at 4:11 PM
Robert Frost was certainly more familiar with iambic pentameter
than he was with estimated parameters, but in 1942 he wrote a couplet that sounds very much like a poet's perception of a confidence interval: #statistics #statssky #academicsky
than he was with estimated parameters, but in 1942 he wrote a couplet that sounds very much like a poet's perception of a confidence interval: #statistics #statssky #academicsky
@mansthulin.bsky.social This was the part of the puzzle I was missing, excellent - thank you! I made a table for it as well:

October 24, 2025 at 1:29 PM
@mansthulin.bsky.social This was the part of the puzzle I was missing, excellent - thank you! I made a table for it as well:
Since efficiency is defined in terms of variance (the second moment) and typically used to assess the performance of estimators for the mean, would estimators of higher-order moments such as skewness or kurtosis require an efficiency criterion based on correspondingly higher moments? Are these used?

October 24, 2025 at 4:03 AM
Since efficiency is defined in terms of variance (the second moment) and typically used to assess the performance of estimators for the mean, would estimators of higher-order moments such as skewness or kurtosis require an efficiency criterion based on correspondingly higher moments? Are these used?
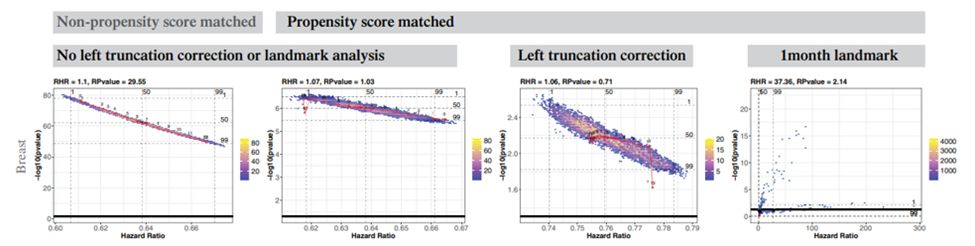
One limitation of the visualizations is the lack of standardized x- and y-axis scaling across figures, which makes it difficult to compare results across analytic methods. In addition, the extremely narrow x-axis range also overstates the apparent variability in hazard ratios.

October 22, 2025 at 3:01 PM
One limitation of the visualizations is the lack of standardized x- and y-axis scaling across figures, which makes it difficult to compare results across analytic methods. In addition, the extremely narrow x-axis range also overstates the apparent variability in hazard ratios.
Breast cancer, which accounted for roughly 14% of the analyses, showed the most extreme variability. Under the 1-month landmark approach, hazard ratios varied by more than 100-fold, whereas the other three methods showed only minor shifts in point estimates (around 0.05).
October 22, 2025 at 3:01 PM
Breast cancer, which accounted for roughly 14% of the analyses, showed the most extreme variability. Under the 1-month landmark approach, hazard ratios varied by more than 100-fold, whereas the other three methods showed only minor shifts in point estimates (around 0.05).
The authors didn’t emphasize that lung cancer, which accounted for nearly 70% of all the data, was relatively robust to analytic choices, showing minimal changes in hazard ratios with either left truncation or PSM.

October 22, 2025 at 3:01 PM
The authors didn’t emphasize that lung cancer, which accounted for nearly 70% of all the data, was relatively robust to analytic choices, showing minimal changes in hazard ratios with either left truncation or PSM.
For prostate cancer, the signs are clear: when using PSM or a 1-month landmark, the results show a Janus effect, contradictory findings depending on covariate selection. When no bias-correction methods are applied, there are no significant results.

October 22, 2025 at 3:00 PM
For prostate cancer, the signs are clear: when using PSM or a 1-month landmark, the results show a Janus effect, contradictory findings depending on covariate selection. When no bias-correction methods are applied, there are no significant results.
They applied a “vibration of effects” approach, running all model combinations across covariates and analytic methods, and displayed the results with volcano plots. When both positive and negative associations emerged, they termed it the Janus effect, after the two-faced Roman god.

October 22, 2025 at 2:59 PM
They applied a “vibration of effects” approach, running all model combinations across covariates and analytic methods, and displayed the results with volcano plots. When both positive and negative associations emerged, they termed it the Janus effect, after the two-faced Roman god.
This paper’s been popping as “evidence” that you can’t do real #causalinference w/ obs data. To me it shows you need rigorous pre-specified design (in addition to the willingness to fold when your hypothesis is not possible to answer with the data at hand). #EpiSky, #CausalSky, #AcademicSky

October 22, 2025 at 2:59 PM
This paper’s been popping as “evidence” that you can’t do real #causalinference w/ obs data. To me it shows you need rigorous pre-specified design (in addition to the willingness to fold when your hypothesis is not possible to answer with the data at hand). #EpiSky, #CausalSky, #AcademicSky
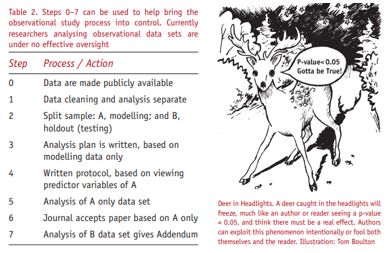
Would be curious is anyone has follow through with this suggestion from this excellent @significancemag.bsky.social article from August 2011 by Alan Karr and S Stanley Young rss.onlinelibrary.wiley.com/doi/full/10....
October 20, 2025 at 4:59 PM
Would be curious is anyone has follow through with this suggestion from this excellent @significancemag.bsky.social article from August 2011 by Alan Karr and S Stanley Young rss.onlinelibrary.wiley.com/doi/full/10....
For anyone who has not read Stigler's wonderful paper on the Epic Story of Maximum Likelihood, I cannot recommend it enough. You will laugh, you might cry, and you will certainly walk away learning something new. #statssky #statistics www.mit.edu/~18.655/pape...

October 17, 2025 at 1:56 AM
For anyone who has not read Stigler's wonderful paper on the Epic Story of Maximum Likelihood, I cannot recommend it enough. You will laugh, you might cry, and you will certainly walk away learning something new. #statssky #statistics www.mit.edu/~18.655/pape...
Still one of my favorite blog posts: simplystatistics.org/posts/2019-0...
#datascience #StatsSky #statistics #Academics
#datascience #StatsSky #statistics #Academics

October 15, 2025 at 4:45 PM
Still one of my favorite blog posts: simplystatistics.org/posts/2019-0...
#datascience #StatsSky #statistics #Academics
#datascience #StatsSky #statistics #Academics
Thinking about joint probability regions
(like 0<y<x−1) and how we compute their probabilities via double integrals.
In principle, Green’s theorem could turn that into a line integral around the boundary — so why don’t we ever do that? Loss of probabilistic meaning, or just unnecessary machinery?
(like 0<y<x−1) and how we compute their probabilities via double integrals.
In principle, Green’s theorem could turn that into a line integral around the boundary — so why don’t we ever do that? Loss of probabilistic meaning, or just unnecessary machinery?

October 13, 2025 at 2:12 AM
Thinking about joint probability regions
(like 0<y<x−1) and how we compute their probabilities via double integrals.
In principle, Green’s theorem could turn that into a line integral around the boundary — so why don’t we ever do that? Loss of probabilistic meaning, or just unnecessary machinery?
(like 0<y<x−1) and how we compute their probabilities via double integrals.
In principle, Green’s theorem could turn that into a line integral around the boundary — so why don’t we ever do that? Loss of probabilistic meaning, or just unnecessary machinery?
Excellent piece by Miryam Naddaf discussing a surge in papers that likely use LLMs on open data. This is concerning since I work on one of those with some of these datasets (NHANES, CDC WONDERS, BRFSS). www.nature.com/articles/d41...

October 11, 2025 at 3:09 AM
Excellent piece by Miryam Naddaf discussing a surge in papers that likely use LLMs on open data. This is concerning since I work on one of those with some of these datasets (NHANES, CDC WONDERS, BRFSS). www.nature.com/articles/d41...
Excellent advice on paper review:
1. Peer reviewers are volunteers.
2. Map all comments to actions.
3. Address all comments.
4. Focus on improving your paper, instead of arguing.
5. Rarely, and only with strong defense, say no.
6. Don’t take things personally.
7. Avoid recreational revisions.
1. Peer reviewers are volunteers.
2. Map all comments to actions.
3. Address all comments.
4. Focus on improving your paper, instead of arguing.
5. Rarely, and only with strong defense, say no.
6. Don’t take things personally.
7. Avoid recreational revisions.

October 10, 2025 at 5:46 PM
Excellent advice on paper review:
1. Peer reviewers are volunteers.
2. Map all comments to actions.
3. Address all comments.
4. Focus on improving your paper, instead of arguing.
5. Rarely, and only with strong defense, say no.
6. Don’t take things personally.
7. Avoid recreational revisions.
1. Peer reviewers are volunteers.
2. Map all comments to actions.
3. Address all comments.
4. Focus on improving your paper, instead of arguing.
5. Rarely, and only with strong defense, say no.
6. Don’t take things personally.
7. Avoid recreational revisions.
S-Values are much more interpretable than P-values, yet adoption seems near impossible. I wonder what it would take to make the leap? #statssky #episky #rstats #statistics

October 10, 2025 at 3:50 PM
S-Values are much more interpretable than P-values, yet adoption seems near impossible. I wonder what it would take to make the leap? #statssky #episky #rstats #statistics

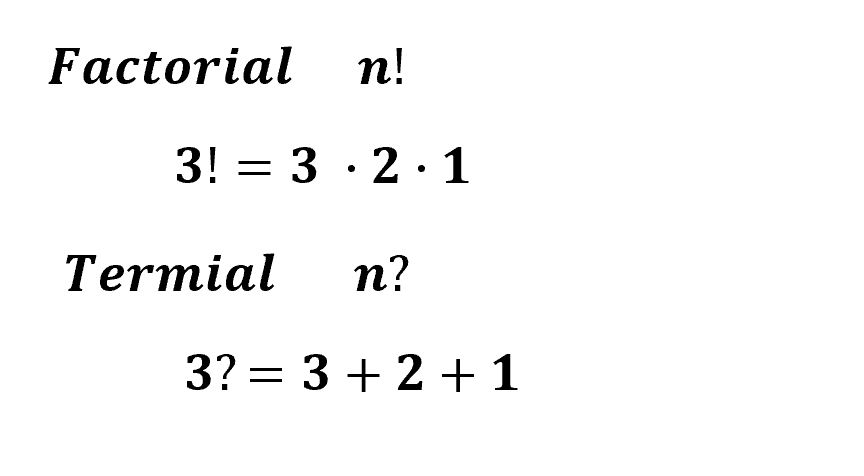
I always wondered if there was a shorthand for summation similar to factorials #math #mathsky #statssky #statistics
October 6, 2025 at 3:13 PM
I always wondered if there was a shorthand for summation similar to factorials #math #mathsky #statssky #statistics
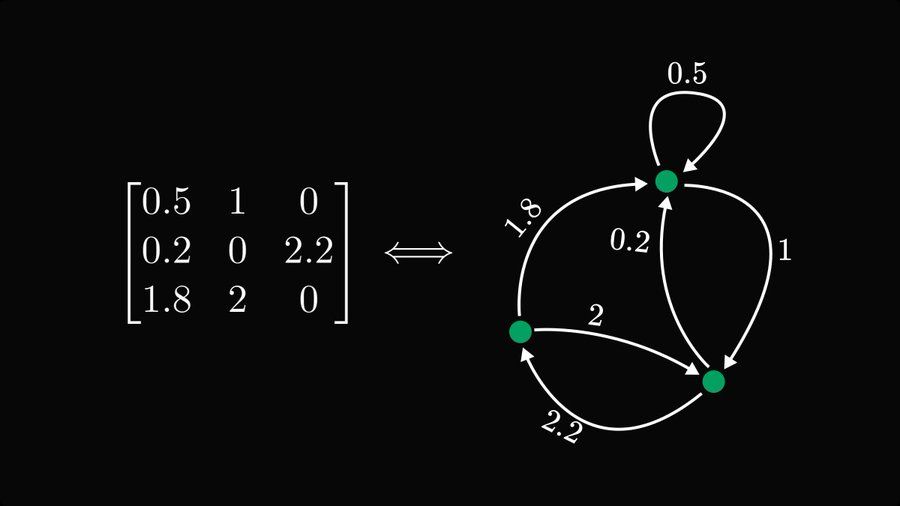
The single most undervalued fact of linear algebra: matrices are graphs, and graphs are matrices.
Encoding matrices as graphs is a cheat code, making complex behavior simple to study. #Statistics #Mathemathis #Math
Excellent example from @tivadardanka.bsky.social
Encoding matrices as graphs is a cheat code, making complex behavior simple to study. #Statistics #Mathemathis #Math
Excellent example from @tivadardanka.bsky.social
September 26, 2025 at 4:36 PM
The single most undervalued fact of linear algebra: matrices are graphs, and graphs are matrices.
Encoding matrices as graphs is a cheat code, making complex behavior simple to study. #Statistics #Mathemathis #Math
Excellent example from @tivadardanka.bsky.social
Encoding matrices as graphs is a cheat code, making complex behavior simple to study. #Statistics #Mathemathis #Math
Excellent example from @tivadardanka.bsky.social
R+AI - Join us at R+AI 2025, our inaugural conference dedicated to the open-source R community and every facet of artificial intelligence - 100% online

September 26, 2025 at 3:06 PM
R+AI - Join us at R+AI 2025, our inaugural conference dedicated to the open-source R community and every facet of artificial intelligence - 100% online
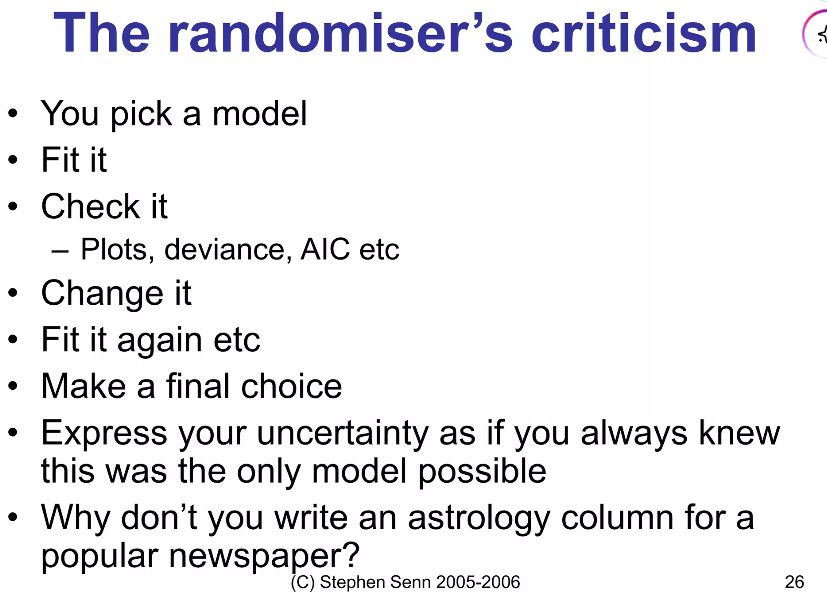
Anyone else ever feel like this? #StatsSky #Statistics

September 23, 2025 at 7:45 PM
Anyone else ever feel like this? #StatsSky #Statistics