


Deepali Kank
@deepalikank.in
Freelance Data Visualization Specialist and Data Analyst. 📊 Book nerd📚. Always seeking new insights and knowledge💡Available for Projects.
https://deepalikank.in/
https://deepalikank.in/
My Culinary Collection Dashboard received the Best Reactable Table prize at the @posit.co Table Contest 2025.
Thank you to the Posit team and community for the recognition and inspiration.
Congrats to all the winners and participants..
More Info: deepalikank.in
#DataViz #rstats
Thank you to the Posit team and community for the recognition and inspiration.
Congrats to all the winners and participants..
More Info: deepalikank.in
#DataViz #rstats

November 12, 2025 at 3:40 AM
My Culinary Collection Dashboard received the Best Reactable Table prize at the @posit.co Table Contest 2025.
Thank you to the Posit team and community for the recognition and inspiration.
Congrats to all the winners and participants..
More Info: deepalikank.in
#DataViz #rstats
Thank you to the Posit team and community for the recognition and inspiration.
Congrats to all the winners and participants..
More Info: deepalikank.in
#DataViz #rstats
Catching up with hashtag#TidyTuesday.
week 39 - Crane Observations at Lake Hornborgasjön, Sweden (1994–2024)
week 43 - Selected British Literary Prizes (1990-2022)
Both charts created in Observable
Notebooks: observablehq.com/user/@deepal...
#DataViz #JavaScript #Figma
week 39 - Crane Observations at Lake Hornborgasjön, Sweden (1994–2024)
week 43 - Selected British Literary Prizes (1990-2022)
Both charts created in Observable
Notebooks: observablehq.com/user/@deepal...
#DataViz #JavaScript #Figma


October 25, 2025 at 6:05 AM
Catching up with hashtag#TidyTuesday.
week 39 - Crane Observations at Lake Hornborgasjön, Sweden (1994–2024)
week 43 - Selected British Literary Prizes (1990-2022)
Both charts created in Observable
Notebooks: observablehq.com/user/@deepal...
#DataViz #JavaScript #Figma
week 39 - Crane Observations at Lake Hornborgasjön, Sweden (1994–2024)
week 43 - Selected British Literary Prizes (1990-2022)
Both charts created in Observable
Notebooks: observablehq.com/user/@deepal...
#DataViz #JavaScript #Figma
#TidyTuesday week 42 - Historic UK Meteorological & Climate Data
Created an interactive radial rainfall explorer for 37 UK Meteorological Stations with #D3js
Observable Notebook: observablehq.com/d/288e88c4ca...
#DataViz
Created an interactive radial rainfall explorer for 37 UK Meteorological Stations with #D3js
Observable Notebook: observablehq.com/d/288e88c4ca...
#DataViz


October 22, 2025 at 4:04 AM
#TidyTuesday week 42 - Historic UK Meteorological & Climate Data
Created an interactive radial rainfall explorer for 37 UK Meteorological Stations with #D3js
Observable Notebook: observablehq.com/d/288e88c4ca...
#DataViz
Created an interactive radial rainfall explorer for 37 UK Meteorological Stations with #D3js
Observable Notebook: observablehq.com/d/288e88c4ca...
#DataViz

October 20, 2025 at 3:34 AM

October 7, 2025 at 6:07 AM
I created these Truchet tiles in plotnine. Triangle mosaics with geom_polygon() and looping arc chains with geom_path().
Entry for the 2025 plotnine contest.
#DataViz #GenerativeArt #2025plotninecontest
Entry for the 2025 plotnine contest.
#DataViz #GenerativeArt #2025plotninecontest


September 29, 2025 at 5:52 AM
I created these Truchet tiles in plotnine. Triangle mosaics with geom_polygon() and looping arc chains with geom_path().
Entry for the 2025 plotnine contest.
#DataViz #GenerativeArt #2025plotninecontest
Entry for the 2025 plotnine contest.
#DataViz #GenerativeArt #2025plotninecontest
Taste meets tables 🍜📊
For this week’s #TidyTuesday I built a table with {shiny} + {reactable}. In the table, recipes with search, country filters, star ratings, and inline “view details” panels showing images, timings, and ingredients.
There are still a few tweaks to make.
#DataViz #Rstats
For this week’s #TidyTuesday I built a table with {shiny} + {reactable}. In the table, recipes with search, country filters, star ratings, and inline “view details” panels showing images, timings, and ingredients.
There are still a few tweaks to make.
#DataViz #Rstats

September 16, 2025 at 6:01 AM
Taste meets tables 🍜📊
For this week’s #TidyTuesday I built a table with {shiny} + {reactable}. In the table, recipes with search, country filters, star ratings, and inline “view details” panels showing images, timings, and ingredients.
There are still a few tweaks to make.
#DataViz #Rstats
For this week’s #TidyTuesday I built a table with {shiny} + {reactable}. In the table, recipes with search, country filters, star ratings, and inline “view details” panels showing images, timings, and ingredients.
There are still a few tweaks to make.
#DataViz #Rstats
#TidyTuesday week 36 - Henley Passport Index Data.
This one created in #Tableau
each column is a visa-free count;
height = how many countries sit there.
Tableau Public: public.tableau.com/app/profile/...
#DataViz
This one created in #Tableau
each column is a visa-free count;
height = how many countries sit there.
Tableau Public: public.tableau.com/app/profile/...
#DataViz

September 11, 2025 at 12:27 PM
#TidyTuesday week 36 - Henley Passport Index Data.
This one created in #Tableau
each column is a visa-free count;
height = how many countries sit there.
Tableau Public: public.tableau.com/app/profile/...
#DataViz
This one created in #Tableau
each column is a visa-free count;
height = how many countries sit there.
Tableau Public: public.tableau.com/app/profile/...
#DataViz
Catching up with #TidyTuesday week 34 - Billboard hot 100 number ones
I created a visualization exploring the instruments used in every song that topped the Billboard Hot 100 between August 4, 1958 and January 11, 2025 using #Rstats and edited it in #Figma.
#DataViz
I created a visualization exploring the instruments used in every song that topped the Billboard Hot 100 between August 4, 1958 and January 11, 2025 using #Rstats and edited it in #Figma.
#DataViz

September 8, 2025 at 1:13 PM
Catching up with #TidyTuesday week 34 - Billboard hot 100 number ones
I created a visualization exploring the instruments used in every song that topped the Billboard Hot 100 between August 4, 1958 and January 11, 2025 using #Rstats and edited it in #Figma.
#DataViz
I created a visualization exploring the instruments used in every song that topped the Billboard Hot 100 between August 4, 1958 and January 11, 2025 using #Rstats and edited it in #Figma.
#DataViz

September 2, 2025 at 1:23 PM
Quick plot for this week’s #TidyTuesday - Scottish Munros
Code: github.com/deepdk/TidyT...
#Rstats #DataViz
Code: github.com/deepdk/TidyT...
#Rstats #DataViz

August 21, 2025 at 6:18 AM
Quick plot for this week’s #TidyTuesday - Scottish Munros
Code: github.com/deepdk/TidyT...
#Rstats #DataViz
Code: github.com/deepdk/TidyT...
#Rstats #DataViz
#TidyTuesday week 28 - British Library Funding. Created these bookmarks.
Code: github.com/deepdk/TidyT...
#Rstats #DataViz
Code: github.com/deepdk/TidyT...
#Rstats #DataViz

July 17, 2025 at 6:15 AM
#TidyTuesday week 28 - British Library Funding. Created these bookmarks.
Code: github.com/deepdk/TidyT...
#Rstats #DataViz
Code: github.com/deepdk/TidyT...
#Rstats #DataViz
#TidyTuesday week 27 - The xkcd Color Survey Results.
I used the data to create an artistic explosion of colors using #p5js.
Thanks to @nrennie.bsky.social for curating it. This dataset was the perfect playground for a little creative exploration.
#dataviz
I used the data to create an artistic explosion of colors using #p5js.
Thanks to @nrennie.bsky.social for curating it. This dataset was the perfect playground for a little creative exploration.
#dataviz

July 8, 2025 at 6:28 AM
#TidyTuesday week 27 - The xkcd Color Survey Results.
I used the data to create an artistic explosion of colors using #p5js.
Thanks to @nrennie.bsky.social for curating it. This dataset was the perfect playground for a little creative exploration.
#dataviz
I used the data to create an artistic explosion of colors using #p5js.
Thanks to @nrennie.bsky.social for curating it. This dataset was the perfect playground for a little creative exploration.
#dataviz
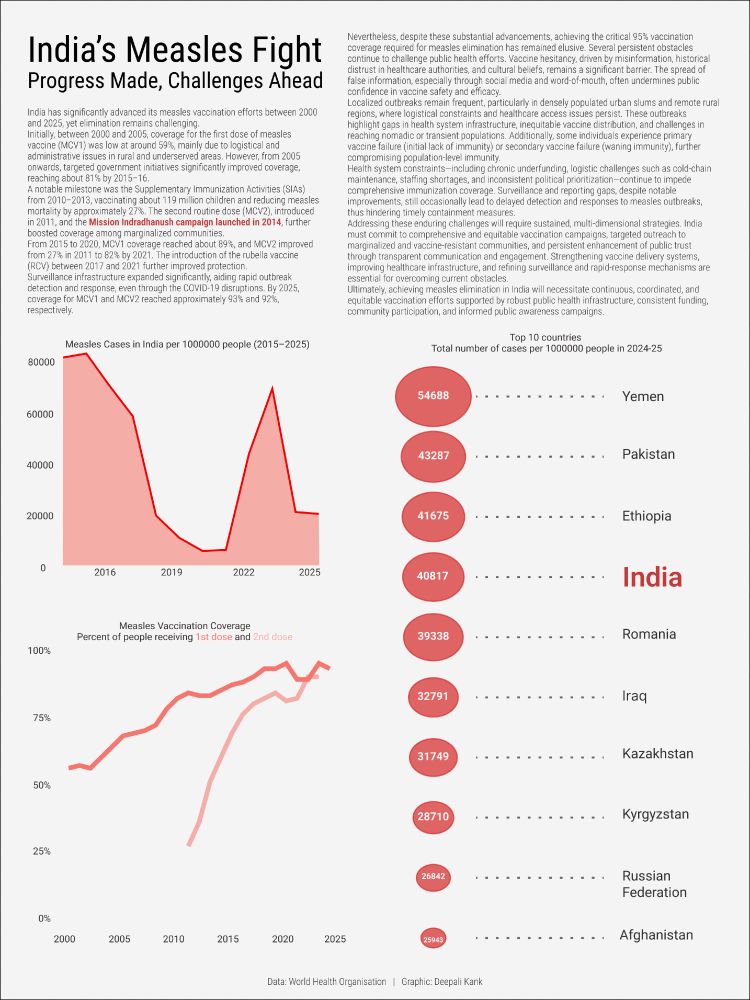
For this week's #TidyTuesday dataset, I explored India's journey toward measles elimination.
The visual layout draws inspiration from newspaper format.
Charts were created in R using #ggplot2
Layout designed in Figma.
#DataVisualization #RStats
The visual layout draws inspiration from newspaper format.
Charts were created in R using #ggplot2
Layout designed in Figma.
#DataVisualization #RStats
June 26, 2025 at 4:59 AM
For this week's #TidyTuesday dataset, I explored India's journey toward measles elimination.
The visual layout draws inspiration from newspaper format.
Charts were created in R using #ggplot2
Layout designed in Figma.
#DataVisualization #RStats
The visual layout draws inspiration from newspaper format.
Charts were created in R using #ggplot2
Layout designed in Figma.
#DataVisualization #RStats

June 12, 2025 at 2:00 PM
Some generative art with #p5.js. Got inspiration from @nrennie.bsky.social
#generativeart #creativecoding
#generativeart #creativecoding


May 2, 2025 at 1:44 PM
Some generative art with #p5.js. Got inspiration from @nrennie.bsky.social
#generativeart #creativecoding
#generativeart #creativecoding
New Shiny app for this week's #TidyTuesday dataset featuring the upcoming useR! 2025 conference sessions!
I built this using {shiny} and some custom styling , with help from AI along the way for troubleshooting and design nudges.
deepalikank.shinyapps.io/useR/
I built this using {shiny} and some custom styling , with help from AI along the way for troubleshooting and design nudges.
deepalikank.shinyapps.io/useR/

April 29, 2025 at 7:00 AM
New Shiny app for this week's #TidyTuesday dataset featuring the upcoming useR! 2025 conference sessions!
I built this using {shiny} and some custom styling , with help from AI along the way for troubleshooting and design nudges.
deepalikank.shinyapps.io/useR/
I built this using {shiny} and some custom styling , with help from AI along the way for troubleshooting and design nudges.
deepalikank.shinyapps.io/useR/
Quick plot for this week's data. #TidyTuesday week 16 - Fatal Car Crashes on 4/20 and #30DayChartChallenge Day 11 - Strips.
Tableau Public: lnkd.in/d8wjZ8Ag
#DataViz
Tableau Public: lnkd.in/d8wjZ8Ag
#DataViz

April 23, 2025 at 6:22 AM
Quick plot for this week's data. #TidyTuesday week 16 - Fatal Car Crashes on 4/20 and #30DayChartChallenge Day 11 - Strips.
Tableau Public: lnkd.in/d8wjZ8Ag
#DataViz
Tableau Public: lnkd.in/d8wjZ8Ag
#DataViz
📊 Day 8 of #30DayChartChallenge: Histogram and #TidyTuesday week 14 - Timely and Effective Care by US State
I looked at the average time (in minutes) patients spend in emergency departments before being sent home.
Tableau Public: public.tableau.com/app/profile/...
#DataViz
I looked at the average time (in minutes) patients spend in emergency departments before being sent home.
Tableau Public: public.tableau.com/app/profile/...
#DataViz

April 8, 2025 at 1:41 PM
📊 Day 8 of #30DayChartChallenge: Histogram and #TidyTuesday week 14 - Timely and Effective Care by US State
I looked at the average time (in minutes) patients spend in emergency departments before being sent home.
Tableau Public: public.tableau.com/app/profile/...
#DataViz
I looked at the average time (in minutes) patients spend in emergency departments before being sent home.
Tableau Public: public.tableau.com/app/profile/...
#DataViz
#30DayChartChallenge Day 7: Outlier
Instead of going the typical stats route for the "Outliers" prompt, Again I took the word literally and explored the Outlier conference hosted by the Data Visualization Society.
Tableau Public: public.tableau.com/app/profile/...
#Dataviz
Instead of going the typical stats route for the "Outliers" prompt, Again I took the word literally and explored the Outlier conference hosted by the Data Visualization Society.
Tableau Public: public.tableau.com/app/profile/...
#Dataviz

April 7, 2025 at 6:09 AM
#30DayChartChallenge Day 7: Outlier
Instead of going the typical stats route for the "Outliers" prompt, Again I took the word literally and explored the Outlier conference hosted by the Data Visualization Society.
Tableau Public: public.tableau.com/app/profile/...
#Dataviz
Instead of going the typical stats route for the "Outliers" prompt, Again I took the word literally and explored the Outlier conference hosted by the Data Visualization Society.
Tableau Public: public.tableau.com/app/profile/...
#Dataviz
#30DayChartChallenge Day 5 - Ranking.
I explored the ranking of sauces in the Hot Ones Show🌶️ by their position in the lineup from mildest (#1) to meltdown-inducing (#10), per season. The lineup gets hotter, redder, and... more regrettable
#Dataviz
I explored the ranking of sauces in the Hot Ones Show🌶️ by their position in the lineup from mildest (#1) to meltdown-inducing (#10), per season. The lineup gets hotter, redder, and... more regrettable
#Dataviz

April 5, 2025 at 12:35 PM
#30DayChartChallenge Day 5 - Ranking.
I explored the ranking of sauces in the Hot Ones Show🌶️ by their position in the lineup from mildest (#1) to meltdown-inducing (#10), per season. The lineup gets hotter, redder, and... more regrettable
#Dataviz
I explored the ranking of sauces in the Hot Ones Show🌶️ by their position in the lineup from mildest (#1) to meltdown-inducing (#10), per season. The lineup gets hotter, redder, and... more regrettable
#Dataviz

April 5, 2025 at 4:00 AM
📊 Day 3 – Circular | #30DayChartChallenge
A bit more on the art side today, visualizing Act I dialogues of Hamlet, Macbeth, Romeo, and Juliet as spirals. I’ve never created text spirals before, so this was a fun little challenge and a great learning opportunity.
#Rstats #D3js #Figma
A bit more on the art side today, visualizing Act I dialogues of Hamlet, Macbeth, Romeo, and Juliet as spirals. I’ve never created text spirals before, so this was a fun little challenge and a great learning opportunity.
#Rstats #D3js #Figma


April 3, 2025 at 5:43 AM
📊 Day 3 – Circular | #30DayChartChallenge
A bit more on the art side today, visualizing Act I dialogues of Hamlet, Macbeth, Romeo, and Juliet as spirals. I’ve never created text spirals before, so this was a fun little challenge and a great learning opportunity.
#Rstats #D3js #Figma
A bit more on the art side today, visualizing Act I dialogues of Hamlet, Macbeth, Romeo, and Juliet as spirals. I’ve never created text spirals before, so this was a fun little challenge and a great learning opportunity.
#Rstats #D3js #Figma
For Day 1 of the #30DayChartChallenge, the theme is “Fractions” and I decided to take that quite literally. What better way to show fractions of time than by visualizing Dhoni’s lightning-fast stumpings.
#DataViz #Rtsats #Figma
#DataViz #Rtsats #Figma

April 1, 2025 at 12:19 PM
For Day 1 of the #30DayChartChallenge, the theme is “Fractions” and I decided to take that quite literally. What better way to show fractions of time than by visualizing Dhoni’s lightning-fast stumpings.
#DataViz #Rtsats #Figma
#DataViz #Rtsats #Figma
#TidyTuesday week 12 - Text data from Amazon's annual reports. Created this proportional streamgraph of the positive and negative words with {ggstream} and also added the word cloud.
#rstats #DataViz #Figma
#rstats #DataViz #Figma

March 25, 2025 at 1:35 PM
#TidyTuesday week 12 - Text data from Amazon's annual reports. Created this proportional streamgraph of the positive and negative words with {ggstream} and also added the word cloud.
#rstats #DataViz #Figma
#rstats #DataViz #Figma