


Dave Osmond
@davidosmond.bsky.social
Weekly renewable simulation of Australia's NEM
Keen on renewables, efficiency, EVs, bikes, the outdoors, running & cycling
Keen on renewables, efficiency, EVs, bikes, the outdoors, running & cycling
The following article contains many more details, assumptions & FAQs about my simulation, including what is ‘Other’, estimates of cost ($107/MWh), emissions, required capacity, scale factors, analysis of the most challenging days & much more (end)
reneweconomy.com.au/a-near-100-p...
reneweconomy.com.au/a-near-100-p...
reneweconomy.com.au
November 5, 2025 at 10:08 PM
The following article contains many more details, assumptions & FAQs about my simulation, including what is ‘Other’, estimates of cost ($107/MWh), emissions, required capacity, scale factors, analysis of the most challenging days & much more (end)
reneweconomy.com.au/a-near-100-p...
reneweconomy.com.au/a-near-100-p...
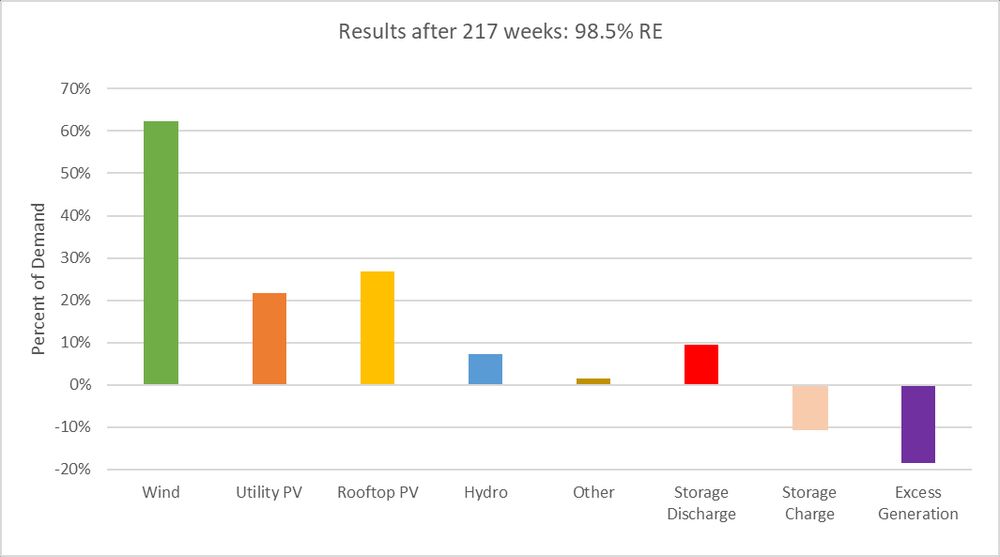
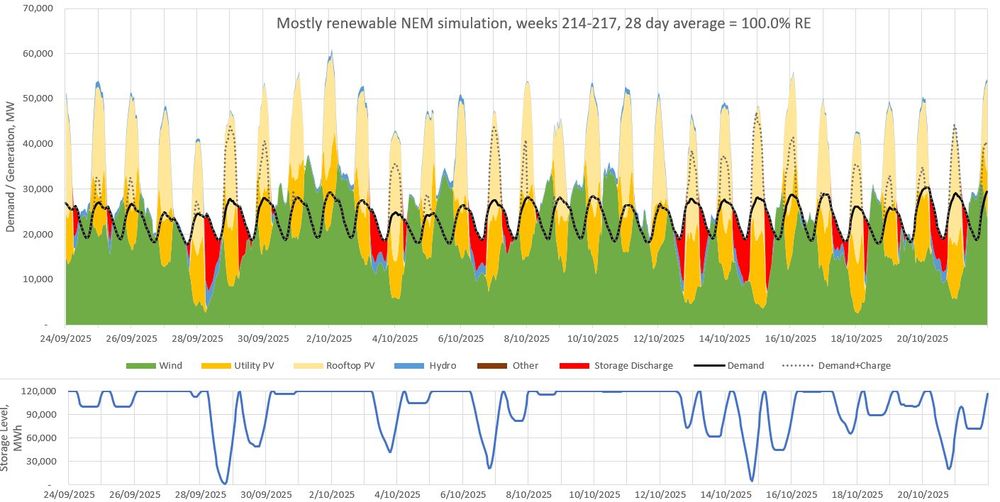
The simulation has used wind, rooftop & utility solar data from
@OpenNEM
, rescaled to supply ~60%, 25% & 20% respectively over the year. It uses the storage & existing hydro to match demand. If there remains a shortfall then the model supplements generation with ‘Other’ (4/5)
@OpenNEM
, rescaled to supply ~60%, 25% & 20% respectively over the year. It uses the storage & existing hydro to match demand. If there remains a shortfall then the model supplements generation with ‘Other’ (4/5)


November 5, 2025 at 10:07 PM
The simulation has used wind, rooftop & utility solar data from
@OpenNEM
, rescaled to supply ~60%, 25% & 20% respectively over the year. It uses the storage & existing hydro to match demand. If there remains a shortfall then the model supplements generation with ‘Other’ (4/5)
@OpenNEM
, rescaled to supply ~60%, 25% & 20% respectively over the year. It uses the storage & existing hydro to match demand. If there remains a shortfall then the model supplements generation with ‘Other’ (4/5)
Here is the simulation from weeks 216 to 219. It was 100% renewable (3/5)

November 5, 2025 at 10:07 PM
Here is the simulation from weeks 216 to 219. It was 100% renewable (3/5)
Last week had:
- average demand (100% of long-term average)
- average wind (100%)
- well above average solar (117%) (2/5)
- average demand (100% of long-term average)
- average wind (100%)
- well above average solar (117%) (2/5)


November 5, 2025 at 10:06 PM
Last week had:
- average demand (100% of long-term average)
- average wind (100%)
- well above average solar (117%) (2/5)
- average demand (100% of long-term average)
- average wind (100%)
- well above average solar (117%) (2/5)
You can download 30-minute data in 3 month chunks here:
www.v-nem.org
www.v-nem.org
V-NEM | VEPC
www.v-nem.org
November 4, 2025 at 8:55 PM
You can download 30-minute data in 3 month chunks here:
www.v-nem.org
www.v-nem.org
not great reductions in SA in the last couple of years. 191kgCO2/MWh is the latest, down from 198kg a year ago and 199kg two years ago.
But we're starting to see improvements again as new wind farms come online & ramp up and also as batteries start to displace gas.
But we're starting to see improvements again as new wind farms come online & ramp up and also as batteries start to displace gas.
November 4, 2025 at 1:45 AM
not great reductions in SA in the last couple of years. 191kgCO2/MWh is the latest, down from 198kg a year ago and 199kg two years ago.
But we're starting to see improvements again as new wind farms come online & ramp up and also as batteries start to displace gas.
But we're starting to see improvements again as new wind farms come online & ramp up and also as batteries start to displace gas.
The following article contains many more details, assumptions & FAQs about my simulation, including what is ‘Other’, estimates of cost ($107/MWh), emissions, required capacity, scale factors, analysis of the most challenging days & much more (end)
reneweconomy.com.au/a-near-100-p...
reneweconomy.com.au/a-near-100-p...
reneweconomy.com.au
October 29, 2025 at 2:33 AM
The following article contains many more details, assumptions & FAQs about my simulation, including what is ‘Other’, estimates of cost ($107/MWh), emissions, required capacity, scale factors, analysis of the most challenging days & much more (end)
reneweconomy.com.au/a-near-100-p...
reneweconomy.com.au/a-near-100-p...
The simulation has used wind, rooftop & utility solar data from
OpenNEM, rescaled to supply ~60%, 25% & 20% respectively over the year. It uses the storage & existing hydro to match demand. If there remains a shortfall then the model supplements generation with ‘Other’ (4/5)
OpenNEM, rescaled to supply ~60%, 25% & 20% respectively over the year. It uses the storage & existing hydro to match demand. If there remains a shortfall then the model supplements generation with ‘Other’ (4/5)


October 29, 2025 at 2:33 AM
The simulation has used wind, rooftop & utility solar data from
OpenNEM, rescaled to supply ~60%, 25% & 20% respectively over the year. It uses the storage & existing hydro to match demand. If there remains a shortfall then the model supplements generation with ‘Other’ (4/5)
OpenNEM, rescaled to supply ~60%, 25% & 20% respectively over the year. It uses the storage & existing hydro to match demand. If there remains a shortfall then the model supplements generation with ‘Other’ (4/5)
Here is the simulation from weeks 215 to 218. It was 100% renewable (3/5)

October 29, 2025 at 2:32 AM
Here is the simulation from weeks 215 to 218. It was 100% renewable (3/5)
Last week had:
- average demand (102% of long-term average)
- average wind (103%)
- above average solar (110%) (2/5)
- average demand (102% of long-term average)
- average wind (103%)
- above average solar (110%) (2/5)


October 29, 2025 at 2:32 AM
Last week had:
- average demand (102% of long-term average)
- average wind (103%)
- above average solar (110%) (2/5)
- average demand (102% of long-term average)
- average wind (103%)
- above average solar (110%) (2/5)
The following article contains many more details, assumptions & FAQs about my simulation, including what is ‘Other’, estimates of cost ($107/MWh), emissions, required capacity, scale factors, analysis of the most challenging days & much more (end)
reneweconomy.com.au/a-near-100-p...
reneweconomy.com.au/a-near-100-p...
reneweconomy.com.au
October 22, 2025 at 2:59 AM
The following article contains many more details, assumptions & FAQs about my simulation, including what is ‘Other’, estimates of cost ($107/MWh), emissions, required capacity, scale factors, analysis of the most challenging days & much more (end)
reneweconomy.com.au/a-near-100-p...
reneweconomy.com.au/a-near-100-p...
The simulation has used wind, rooftop & utility solar data from
OpenNEM, rescaled to supply ~60%, 25% & 20% respectively over the year. It uses the storage & existing hydro to match demand. If there remains a shortfall then the model supplements generation with ‘Other’ (4/5)
OpenNEM, rescaled to supply ~60%, 25% & 20% respectively over the year. It uses the storage & existing hydro to match demand. If there remains a shortfall then the model supplements generation with ‘Other’ (4/5)


October 22, 2025 at 2:59 AM
The simulation has used wind, rooftop & utility solar data from
OpenNEM, rescaled to supply ~60%, 25% & 20% respectively over the year. It uses the storage & existing hydro to match demand. If there remains a shortfall then the model supplements generation with ‘Other’ (4/5)
OpenNEM, rescaled to supply ~60%, 25% & 20% respectively over the year. It uses the storage & existing hydro to match demand. If there remains a shortfall then the model supplements generation with ‘Other’ (4/5)
Here is the simulation from weeks 214 to 217. It was 100% renewable.
For earlier weeks, see the following thread (3/5)
For earlier weeks, see the following thread (3/5)
October 22, 2025 at 2:58 AM
Here is the simulation from weeks 214 to 217. It was 100% renewable.
For earlier weeks, see the following thread (3/5)
For earlier weeks, see the following thread (3/5)
Last week had:
- average demand (100% of long-term average)
- above average wind (110%)
- well above average solar (117%) (2/5)
- average demand (100% of long-term average)
- above average wind (110%)
- well above average solar (117%) (2/5)


October 22, 2025 at 2:58 AM
Last week had:
- average demand (100% of long-term average)
- above average wind (110%)
- well above average solar (117%) (2/5)
- average demand (100% of long-term average)
- above average wind (110%)
- well above average solar (117%) (2/5)
Cheers Jason, storage installations are absolutely booming at the moment, both utility and residential.
It's the build of wind and solar which is the limiting factor now. See also this post
bsky.app/profile/davi...
It's the build of wind and solar which is the limiting factor now. See also this post
bsky.app/profile/davi...

October 16, 2025 at 12:08 AM
Cheers Jason, storage installations are absolutely booming at the moment, both utility and residential.
It's the build of wind and solar which is the limiting factor now. See also this post
bsky.app/profile/davi...
It's the build of wind and solar which is the limiting factor now. See also this post
bsky.app/profile/davi...
My latest estimate:

October 15, 2025 at 11:22 PM
My latest estimate:
This is a simulation. The NEM could have been 100% renewable last week if we had 4x more wind than now, 2.5x/1.9x more utility/rooftop solar & 24GW/120GWh of storage.
October 15, 2025 at 11:19 PM
This is a simulation. The NEM could have been 100% renewable last week if we had 4x more wind than now, 2.5x/1.9x more utility/rooftop solar & 24GW/120GWh of storage.
The following article contains many more details, assumptions & FAQs about my simulation, including what is ‘Other’, estimates of cost ($107/MWh), emissions, required capacity, scale factors, analysis of the most challenging days & much more (end)
reneweconomy.com.au/a-near-100-p...
reneweconomy.com.au/a-near-100-p...
reneweconomy.com.au
October 15, 2025 at 10:31 PM
The following article contains many more details, assumptions & FAQs about my simulation, including what is ‘Other’, estimates of cost ($107/MWh), emissions, required capacity, scale factors, analysis of the most challenging days & much more (end)
reneweconomy.com.au/a-near-100-p...
reneweconomy.com.au/a-near-100-p...
The simulation has used wind, rooftop & utility solar data from
OpenNEM, rescaled to supply ~60%, 25% & 20% respectively over the year. It uses the storage & existing hydro to match demand. If there remains a shortfall then the model supplements generation with ‘Other’ (4/5)
OpenNEM, rescaled to supply ~60%, 25% & 20% respectively over the year. It uses the storage & existing hydro to match demand. If there remains a shortfall then the model supplements generation with ‘Other’ (4/5)


October 15, 2025 at 10:30 PM
The simulation has used wind, rooftop & utility solar data from
OpenNEM, rescaled to supply ~60%, 25% & 20% respectively over the year. It uses the storage & existing hydro to match demand. If there remains a shortfall then the model supplements generation with ‘Other’ (4/5)
OpenNEM, rescaled to supply ~60%, 25% & 20% respectively over the year. It uses the storage & existing hydro to match demand. If there remains a shortfall then the model supplements generation with ‘Other’ (4/5)