


Dave Osmond
@davidosmond.bsky.social
Weekly renewable simulation of Australia's NEM
Keen on renewables, efficiency, EVs, bikes, the outdoors, running & cycling
Keen on renewables, efficiency, EVs, bikes, the outdoors, running & cycling
Pinned

Thread: Each week I run a simulation of Australia’s main electricity grid using rescaled generation data to show that it can get very close to 100% renewable electricity with 24GW/120GWh of storage (5 hrs at av demand)
Results:
Last week: 100% RE
Last 227 weeks: 98.6% RE (1/5)
Results:
Last week: 100% RE
Last 227 weeks: 98.6% RE (1/5)
January 3, 2026 at 6:14 AM
Thread: Each week I run a simulation of Australia’s main electricity grid using rescaled generation data to show that it can get very close to 100% renewable electricity with 24GW/120GWh of storage (5 hrs at av demand)
Results:
Last week: 100% RE
Last 227 weeks: 98.6% RE (1/5)
Results:
Last week: 100% RE
Last 227 weeks: 98.6% RE (1/5)
Reposted by Dave Osmond

You need to read this story.

Cardiff couple invited man in for Christmas, he stayed for 45 years
An arrangement Rob and Dianne Parsons thought would last a few days ended up changing their lives.
www.bbc.com
December 26, 2025 at 11:38 AM
You need to read this story.
The NEM has only had 3 occasions where native demand exceeded 37.8 GW.
Last week on Dec 18, and last year on Feb 22 & Dec 16.
The simulation was 100% renewable on all these days, thanks to good wind & excellent solar.
A mostly renewable NEM copes well with extreme demand.
Last week on Dec 18, and last year on Feb 22 & Dec 16.
The simulation was 100% renewable on all these days, thanks to good wind & excellent solar.
A mostly renewable NEM copes well with extreme demand.


December 24, 2025 at 4:53 AM
The NEM has only had 3 occasions where native demand exceeded 37.8 GW.
Last week on Dec 18, and last year on Feb 22 & Dec 16.
The simulation was 100% renewable on all these days, thanks to good wind & excellent solar.
A mostly renewable NEM copes well with extreme demand.
Last week on Dec 18, and last year on Feb 22 & Dec 16.
The simulation was 100% renewable on all these days, thanks to good wind & excellent solar.
A mostly renewable NEM copes well with extreme demand.
Thread: Each week I run a simulation of Australia’s main electricity grid using rescaled generation data to show that it can get very close to 100% renewable electricity with 24GW/120GWh of storage (5 hrs at av demand)
Results:
Last week: 100.0% RE
Last 226 weeks: 98.6% RE (1/5)
Results:
Last week: 100.0% RE
Last 226 weeks: 98.6% RE (1/5)

December 24, 2025 at 4:27 AM
Thread: Each week I run a simulation of Australia’s main electricity grid using rescaled generation data to show that it can get very close to 100% renewable electricity with 24GW/120GWh of storage (5 hrs at av demand)
Results:
Last week: 100.0% RE
Last 226 weeks: 98.6% RE (1/5)
Results:
Last week: 100.0% RE
Last 226 weeks: 98.6% RE (1/5)
Australia's main electricity grid, the NEM, will soon have 40GW/113GWh of storage (not including Snowy2.0).
That's enough storage to power the grid for about 4.5hrs at average demand of ~25GW
/1
That's enough storage to power the grid for about 4.5hrs at average demand of ~25GW
/1

December 23, 2025 at 3:59 AM
Australia's main electricity grid, the NEM, will soon have 40GW/113GWh of storage (not including Snowy2.0).
That's enough storage to power the grid for about 4.5hrs at average demand of ~25GW
/1
That's enough storage to power the grid for about 4.5hrs at average demand of ~25GW
/1
Extreme native NEM demand on Thu & Fri last week, hitting 38.0 GW on Thu Dec 18 at 3:25pm NEM time & 37.6 GW 1:25pm on Fri.
Av. native demand in 2025 is 24.9 GW.
Rooftop PV once again demonstrating that it dramatically reduces peak grid demand, peaking at 32.7 GW at 6pm on Dec 18.
/1
Av. native demand in 2025 is 24.9 GW.
Rooftop PV once again demonstrating that it dramatically reduces peak grid demand, peaking at 32.7 GW at 6pm on Dec 18.
/1

December 21, 2025 at 10:36 PM
Extreme native NEM demand on Thu & Fri last week, hitting 38.0 GW on Thu Dec 18 at 3:25pm NEM time & 37.6 GW 1:25pm on Fri.
Av. native demand in 2025 is 24.9 GW.
Rooftop PV once again demonstrating that it dramatically reduces peak grid demand, peaking at 32.7 GW at 6pm on Dec 18.
/1
Av. native demand in 2025 is 24.9 GW.
Rooftop PV once again demonstrating that it dramatically reduces peak grid demand, peaking at 32.7 GW at 6pm on Dec 18.
/1
Reposted by Dave Osmond

Here's @ronnisalt. "Don't look back in anger"
theshot.net.au/uncategorize...
theshot.net.au/uncategorize...

Don’t look back in anger - The Shot
I’m angry. We’re all angry. Perhaps that’s part of the problem. At the moment, we’re angry at two twisted individuals...
theshot.net.au
December 18, 2025 at 12:02 AM
Here's @ronnisalt. "Don't look back in anger"
theshot.net.au/uncategorize...
theshot.net.au/uncategorize...
Thread: Each week I run a simulation of Australia’s main electricity grid using rescaled generation data to show that it can get very close to 100% renewable electricity with 24GW/120GWh of storage (5 hrs at av demand)
Results:
Last week: 100% RE
Last 225 weeks: 98.6% RE (1/5)
Results:
Last week: 100% RE
Last 225 weeks: 98.6% RE (1/5)

December 17, 2025 at 5:55 AM
Thread: Each week I run a simulation of Australia’s main electricity grid using rescaled generation data to show that it can get very close to 100% renewable electricity with 24GW/120GWh of storage (5 hrs at av demand)
Results:
Last week: 100% RE
Last 225 weeks: 98.6% RE (1/5)
Results:
Last week: 100% RE
Last 225 weeks: 98.6% RE (1/5)
Reposted by Dave Osmond

In 1991 Mt Pinatubo spewed out 50 MILLION TONNES OF CO₂!!
That's a ridiculously MASSIVE amount!
That's a ridiculously MASSIVE amount!
September 13, 2024 at 11:56 AM
In 1991 Mt Pinatubo spewed out 50 MILLION TONNES OF CO₂!!
That's a ridiculously MASSIVE amount!
That's a ridiculously MASSIVE amount!
Thread: Each week I run a simulation of Australia’s main electricity grid using rescaled generation data to show that it can get very close to 100% renewable electricity with 24GW/120GWh of storage (5 hrs at av demand)
Results:
Last week: 100.0% RE
Last 224 weeks: 98.6% RE (1/5)
Results:
Last week: 100.0% RE
Last 224 weeks: 98.6% RE (1/5)

December 10, 2025 at 5:08 AM
Thread: Each week I run a simulation of Australia’s main electricity grid using rescaled generation data to show that it can get very close to 100% renewable electricity with 24GW/120GWh of storage (5 hrs at av demand)
Results:
Last week: 100.0% RE
Last 224 weeks: 98.6% RE (1/5)
Results:
Last week: 100.0% RE
Last 224 weeks: 98.6% RE (1/5)
Changes from AEMO's 2024 ISP to today's Draft 2026 ISP:
- A large extension in black coal operations
- A large reduction in flexible gas capacity
- An increase in utility solar at the expense of wind
- a large increase in utility storage, at the expense of coordinated CER storage
- A large extension in black coal operations
- A large reduction in flexible gas capacity
- An increase in utility solar at the expense of wind
- a large increase in utility storage, at the expense of coordinated CER storage


December 10, 2025 at 2:17 AM
Changes from AEMO's 2024 ISP to today's Draft 2026 ISP:
- A large extension in black coal operations
- A large reduction in flexible gas capacity
- An increase in utility solar at the expense of wind
- a large increase in utility storage, at the expense of coordinated CER storage
- A large extension in black coal operations
- A large reduction in flexible gas capacity
- An increase in utility solar at the expense of wind
- a large increase in utility storage, at the expense of coordinated CER storage
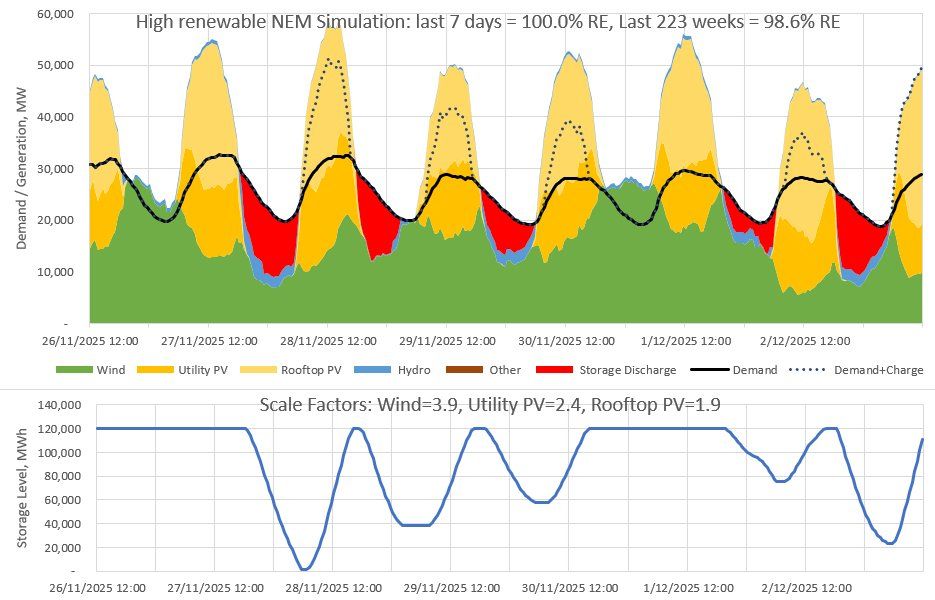
Thread: Each week I run a simulation of Australia’s main electricity grid using rescaled generation data to show that it can get very close to 100% renewable electricity with 24GW/120GWh of storage (5 hrs at av demand)
Results:
Last week: 100% RE
Last 223 weeks: 98.6% RE (1/5)
Results:
Last week: 100% RE
Last 223 weeks: 98.6% RE (1/5)
December 3, 2025 at 10:30 PM
Thread: Each week I run a simulation of Australia’s main electricity grid using rescaled generation data to show that it can get very close to 100% renewable electricity with 24GW/120GWh of storage (5 hrs at av demand)
Results:
Last week: 100% RE
Last 223 weeks: 98.6% RE (1/5)
Results:
Last week: 100% RE
Last 223 weeks: 98.6% RE (1/5)
November was the first month that utility batteries discharged more energy than peaking (OCGT) gas on Australia's NEM.
According to the 2024 ISP, it will only be a few years before batteries are the primary firmer of renewables, exceeding the output of all gas and hydro.
According to the 2024 ISP, it will only be a few years before batteries are the primary firmer of renewables, exceeding the output of all gas and hydro.


December 2, 2025 at 2:50 AM
November was the first month that utility batteries discharged more energy than peaking (OCGT) gas on Australia's NEM.
According to the 2024 ISP, it will only be a few years before batteries are the primary firmer of renewables, exceeding the output of all gas and hydro.
According to the 2024 ISP, it will only be a few years before batteries are the primary firmer of renewables, exceeding the output of all gas and hydro.
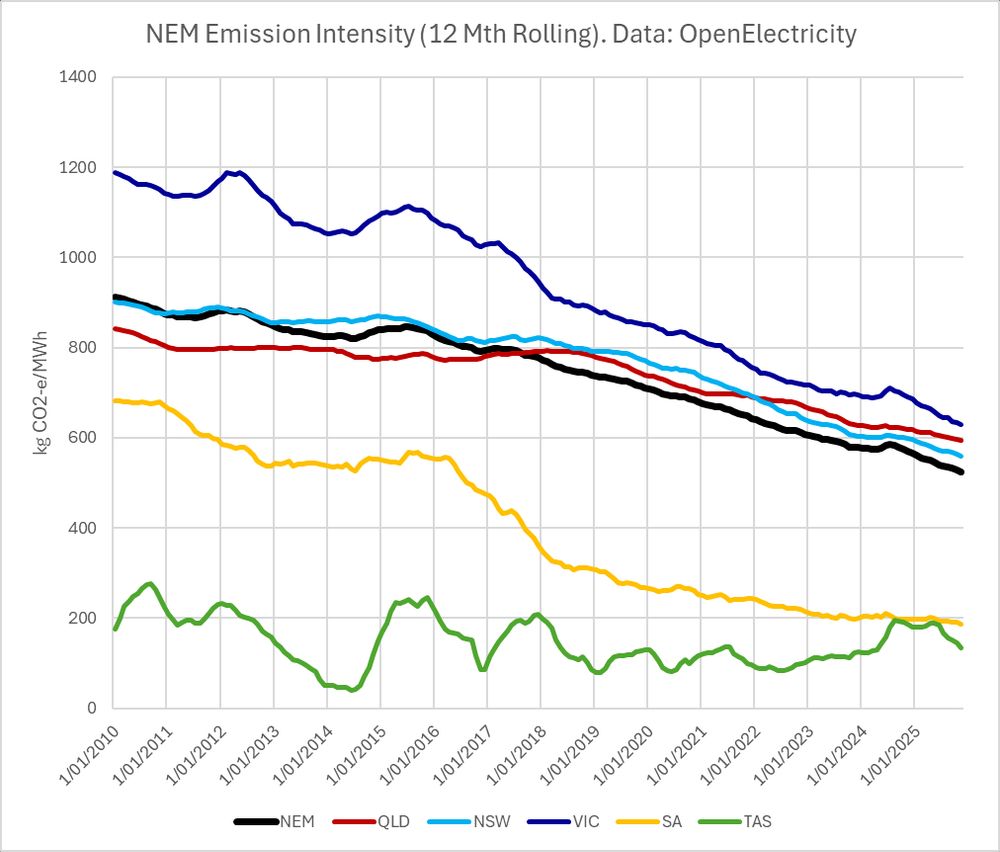
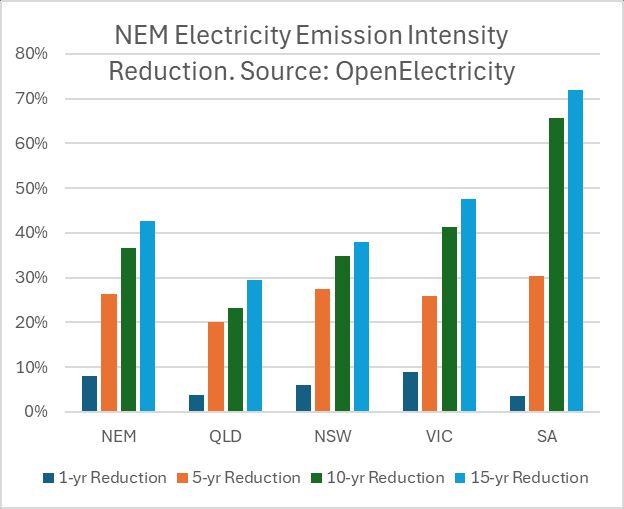
Australia Electricity Emissions Update:
Average NEM emission intensity over last 12 months: 524 kg CO2-e/MWh (down 23% in 5-yrs, down 37% in 10-yrs)
Sth Australia leading the way in reductions thanks to its increase in wind & solar generation. Down 28% in 5-yrs, 66% in 10-yrs)
Average NEM emission intensity over last 12 months: 524 kg CO2-e/MWh (down 23% in 5-yrs, down 37% in 10-yrs)
Sth Australia leading the way in reductions thanks to its increase in wind & solar generation. Down 28% in 5-yrs, 66% in 10-yrs)

December 1, 2025 at 12:54 AM
Australia Electricity Emissions Update:
Average NEM emission intensity over last 12 months: 524 kg CO2-e/MWh (down 23% in 5-yrs, down 37% in 10-yrs)
Sth Australia leading the way in reductions thanks to its increase in wind & solar generation. Down 28% in 5-yrs, 66% in 10-yrs)
Average NEM emission intensity over last 12 months: 524 kg CO2-e/MWh (down 23% in 5-yrs, down 37% in 10-yrs)
Sth Australia leading the way in reductions thanks to its increase in wind & solar generation. Down 28% in 5-yrs, 66% in 10-yrs)
Reposted by Dave Osmond

Australia’s emissions down 2.2% last financial year.
Govt says it is the biggest annual drop in gross emissions recorded (ie not counting land/forests).
This has been put out ahead of a dump of climate documents and Chris Bowen making his annual climate statement.
Govt says it is the biggest annual drop in gross emissions recorded (ie not counting land/forests).
This has been put out ahead of a dump of climate documents and Chris Bowen making his annual climate statement.

Australia’s emissions from fossil fuels down as electricity from renewables passes 40%
While greenhouse gas emissions fell 2.2% or 9.9m tonnes last financial year, new policies are needed to meet the 2035 target
www.theguardian.com
November 26, 2025 at 10:06 PM
Australia’s emissions down 2.2% last financial year.
Govt says it is the biggest annual drop in gross emissions recorded (ie not counting land/forests).
This has been put out ahead of a dump of climate documents and Chris Bowen making his annual climate statement.
Govt says it is the biggest annual drop in gross emissions recorded (ie not counting land/forests).
This has been put out ahead of a dump of climate documents and Chris Bowen making his annual climate statement.
Thread: Each week I run a simulation of Australia’s main electricity grid using rescaled generation data to show that it can get very close to 100% renewable electricity with 24GW/120GWh of storage (5 hrs at av demand)
Results:
Last week: 100% RE
Last 222 weeks: 98.6% RE (1/5)
Results:
Last week: 100% RE
Last 222 weeks: 98.6% RE (1/5)

November 26, 2025 at 10:45 PM
Thread: Each week I run a simulation of Australia’s main electricity grid using rescaled generation data to show that it can get very close to 100% renewable electricity with 24GW/120GWh of storage (5 hrs at av demand)
Results:
Last week: 100% RE
Last 222 weeks: 98.6% RE (1/5)
Results:
Last week: 100% RE
Last 222 weeks: 98.6% RE (1/5)
Thread: Each week I run a simulation of Australia’s main electricity grid using rescaled generation data to show that it can get very close to 100% renewable electricity with 24GW/120GWh of storage (5 hrs at av demand)
Results:
Last week: 100% RE
Last 221 weeks: 98.6% RE (1/5)
Results:
Last week: 100% RE
Last 221 weeks: 98.6% RE (1/5)

November 20, 2025 at 5:31 AM
Thread: Each week I run a simulation of Australia’s main electricity grid using rescaled generation data to show that it can get very close to 100% renewable electricity with 24GW/120GWh of storage (5 hrs at av demand)
Results:
Last week: 100% RE
Last 221 weeks: 98.6% RE (1/5)
Results:
Last week: 100% RE
Last 221 weeks: 98.6% RE (1/5)
Reposted by Dave Osmond
Factchecking five Coalition claims about net zero, from power prices to the $9tn cost
www.theguardian.com/australia-ne...
www.theguardian.com/australia-ne...

Factchecking five Coalition claims about net zero, from power prices to the $9tn cost
As Liberals join Nationals in abandoning a 2050 emissions target, we unpick some of the opposition’s talking points
www.theguardian.com
November 16, 2025 at 10:11 AM
Factchecking five Coalition claims about net zero, from power prices to the $9tn cost
www.theguardian.com/australia-ne...
www.theguardian.com/australia-ne...
Reposted by Dave Osmond

When the #ParisAgreement was signed, a huge global boom in coal was happening, threatening 4 degrees of warming.
10 years later, and coal's generation increased by the FOURTH most.
Solar #1, wind #2 💪💪💪
10 years later, and coal's generation increased by the FOURTH most.
Solar #1, wind #2 💪💪💪

NEW | The world has achieved nearly a tenfold increase in solar power in the ten years since the #ParisAgreement ☀️
Solar rose from providing 1% of global electricity in 2015 to 8.8% in the first half of 2025.
Emerging economies now lead this growth 📈
https://loom.ly/tlCvBso
Solar rose from providing 1% of global electricity in 2015 to 8.8% in the first half of 2025.
Emerging economies now lead this growth 📈
https://loom.ly/tlCvBso

November 14, 2025 at 1:58 PM
When the #ParisAgreement was signed, a huge global boom in coal was happening, threatening 4 degrees of warming.
10 years later, and coal's generation increased by the FOURTH most.
Solar #1, wind #2 💪💪💪
10 years later, and coal's generation increased by the FOURTH most.
Solar #1, wind #2 💪💪💪
Reposted by Dave Osmond
Hi Milly, SA had the highest prices in the country back in 2010, before renewables became significant. High wholesale prices made it an attractive market for renewables.
It had high prices due to lack of cheap coal, peaky demand & lots of poles per customer. threadreaderapp.com/thread/16688...
It had high prices due to lack of cheap coal, peaky demand & lots of poles per customer. threadreaderapp.com/thread/16688...
Thread by @DavidOsmond8 on Thread Reader App
@DavidOsmond8: A thread on why Sth Australia has the most expensive electricity on Australia’s NEM. Short answer: because it has a very ‘peaky’ demand, driven by high electricity use in summer heatwav...
threadreaderapp.com
November 14, 2025 at 12:12 AM
Hi Milly, SA had the highest prices in the country back in 2010, before renewables became significant. High wholesale prices made it an attractive market for renewables.
It had high prices due to lack of cheap coal, peaky demand & lots of poles per customer. threadreaderapp.com/thread/16688...
It had high prices due to lack of cheap coal, peaky demand & lots of poles per customer. threadreaderapp.com/thread/16688...
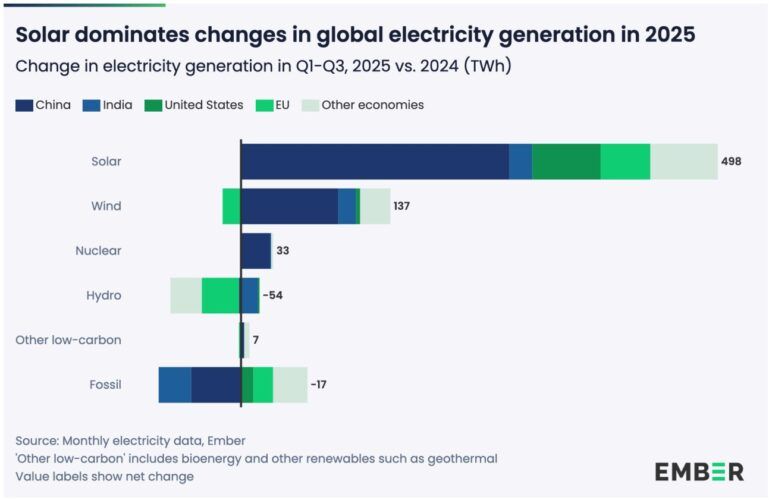
Love this chart from Ember via @reneweconomy.com.au
Shows that the growth in solar and wind generation is finally starting to exceed the growth in demand, so that fossil generation is declining.
That is true in both China & India, as well as globally.
Shows that the growth in solar and wind generation is finally starting to exceed the growth in demand, so that fossil generation is declining.
That is true in both China & India, as well as globally.
November 13, 2025 at 11:33 PM
Love this chart from Ember via @reneweconomy.com.au
Shows that the growth in solar and wind generation is finally starting to exceed the growth in demand, so that fossil generation is declining.
That is true in both China & India, as well as globally.
Shows that the growth in solar and wind generation is finally starting to exceed the growth in demand, so that fossil generation is declining.
That is true in both China & India, as well as globally.
Reposted by Dave Osmond
A Clear Air column today. It's a pretty long one. Could have been longer.
www.theguardian.com/environment/...
www.theguardian.com/environment/...

The spectacular nonsense of the Coalition’s internal brawl over the 2050 net zero emissions target | Clear air
The public stoush is really about whether the party will drop the charade or maintain it while shuffling some words
www.theguardian.com
November 11, 2025 at 9:07 PM
A Clear Air column today. It's a pretty long one. Could have been longer.
www.theguardian.com/environment/...
www.theguardian.com/environment/...
Thread: Each week I run a simulation of Australia’s main electricity grid using rescaled generation data to show that it can get very close to 100% renewable electricity with 24GW/120GWh of storage (5 hrs at av demand)
Results:
Last week: 100% RE
Last 220 weeks: 98.6% RE (1/5)
Results:
Last week: 100% RE
Last 220 weeks: 98.6% RE (1/5)

November 12, 2025 at 3:28 AM
Thread: Each week I run a simulation of Australia’s main electricity grid using rescaled generation data to show that it can get very close to 100% renewable electricity with 24GW/120GWh of storage (5 hrs at av demand)
Results:
Last week: 100% RE
Last 220 weeks: 98.6% RE (1/5)
Results:
Last week: 100% RE
Last 220 weeks: 98.6% RE (1/5)
Thread: Each week I run a simulation of Australia’s main electricity grid using rescaled generation data to show that it can get very close to 100% renewable electricity with 24GW/120GWh of storage (5 hrs at av demand)
Results:
Last week: 100.0% RE
Last 219 weeks: 98.6% RE (1/5)
Results:
Last week: 100.0% RE
Last 219 weeks: 98.6% RE (1/5)

November 5, 2025 at 10:05 PM
Thread: Each week I run a simulation of Australia’s main electricity grid using rescaled generation data to show that it can get very close to 100% renewable electricity with 24GW/120GWh of storage (5 hrs at av demand)
Results:
Last week: 100.0% RE
Last 219 weeks: 98.6% RE (1/5)
Results:
Last week: 100.0% RE
Last 219 weeks: 98.6% RE (1/5)
Australian Electricity Emission Intensity Update:
Average NEM emission intensity over last 12 months: 529 kg CO2-e/MWh
(down 26% in 5-yrs, down 37% in 10-yrs)
Sth Australia leading the way reductions thanks to its increase in wind & solar generation.
Down 30% in 5-yrs, 66% in 10-yrs)
Average NEM emission intensity over last 12 months: 529 kg CO2-e/MWh
(down 26% in 5-yrs, down 37% in 10-yrs)
Sth Australia leading the way reductions thanks to its increase in wind & solar generation.
Down 30% in 5-yrs, 66% in 10-yrs)

November 2, 2025 at 11:26 PM
Australian Electricity Emission Intensity Update:
Average NEM emission intensity over last 12 months: 529 kg CO2-e/MWh
(down 26% in 5-yrs, down 37% in 10-yrs)
Sth Australia leading the way reductions thanks to its increase in wind & solar generation.
Down 30% in 5-yrs, 66% in 10-yrs)
Average NEM emission intensity over last 12 months: 529 kg CO2-e/MWh
(down 26% in 5-yrs, down 37% in 10-yrs)
Sth Australia leading the way reductions thanks to its increase in wind & solar generation.
Down 30% in 5-yrs, 66% in 10-yrs)