


Data Design Dude
@datadesigner.bsky.social
DataViz Specialist 📊 Teaching Elegance & Excellence in Data Storytelling
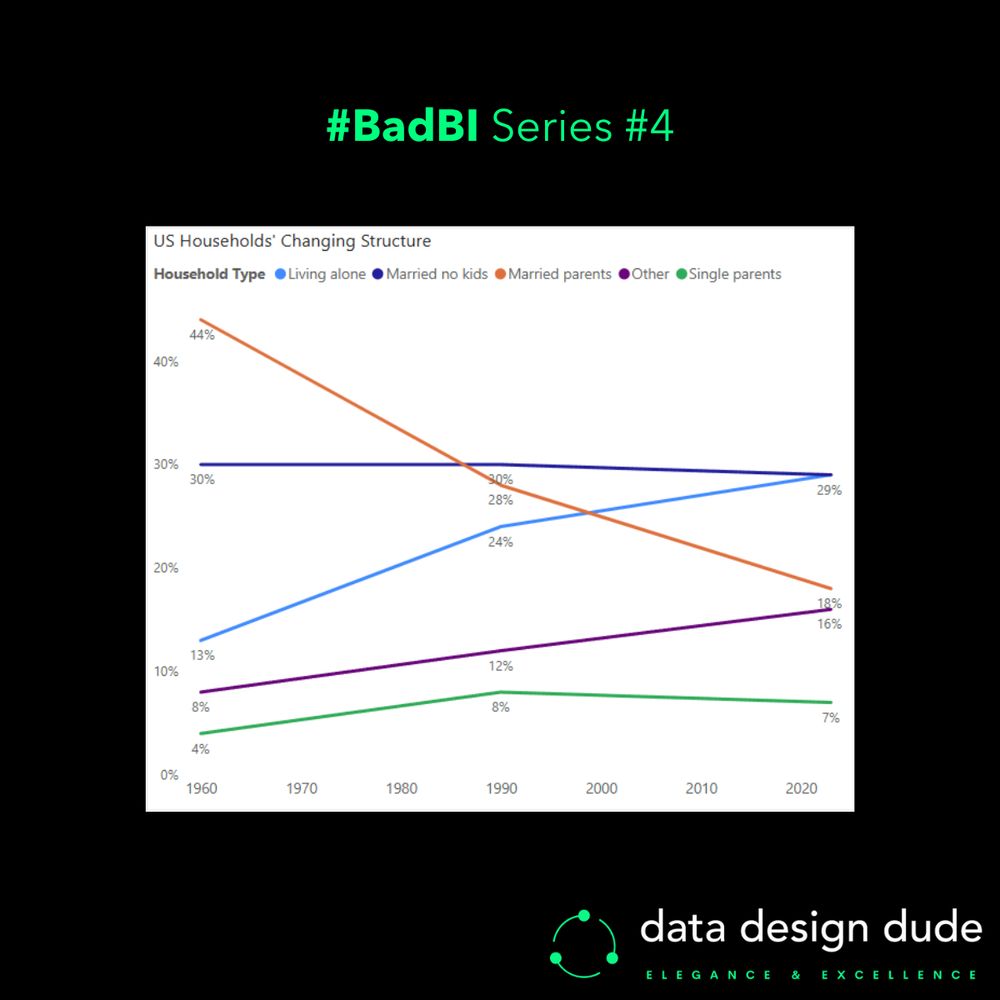
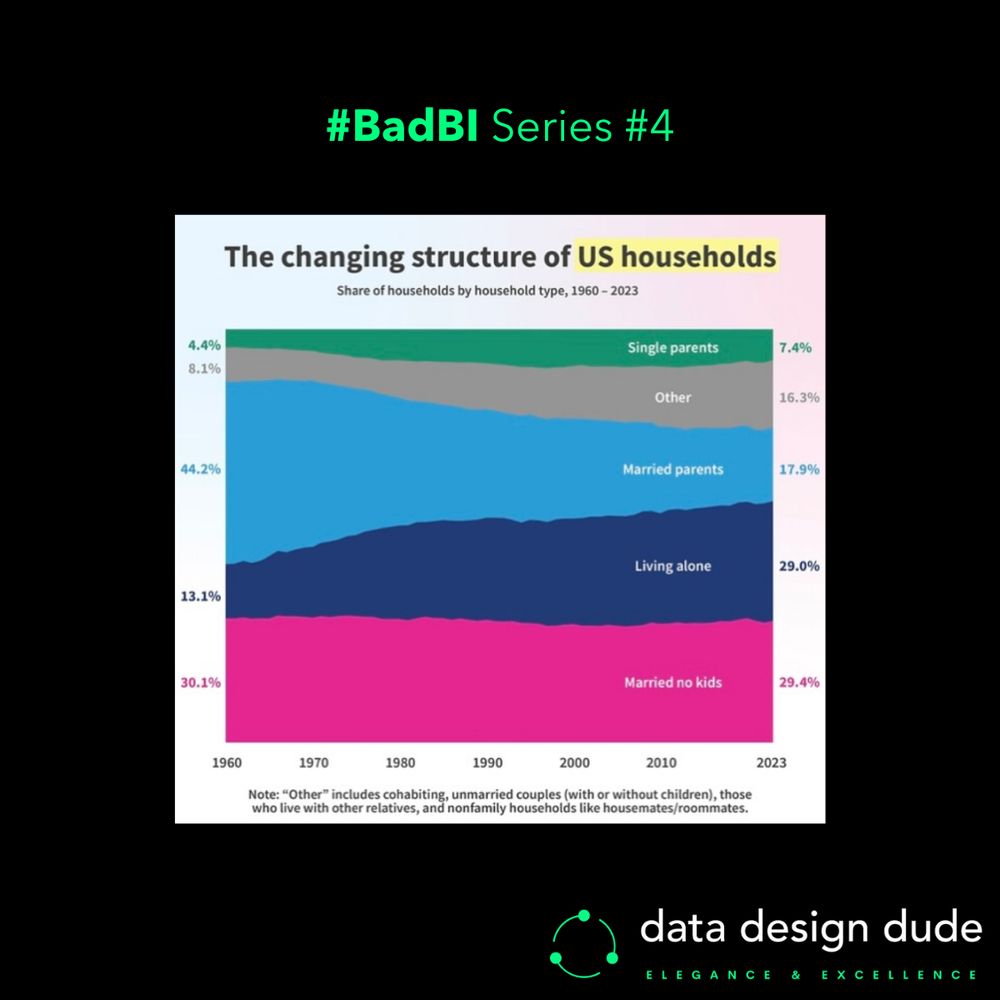
These flaws aren’t exclusive to this particular chart; all stacked area charts have them.
Now look at the second chart I made (with data points for just three years) and see how each of the problems above go away.
Now look at the second chart I made (with data points for just three years) and see how each of the problems above go away.
February 14, 2025 at 4:51 PM
These flaws aren’t exclusive to this particular chart; all stacked area charts have them.
Now look at the second chart I made (with data points for just three years) and see how each of the problems above go away.
Now look at the second chart I made (with data points for just three years) and see how each of the problems above go away.
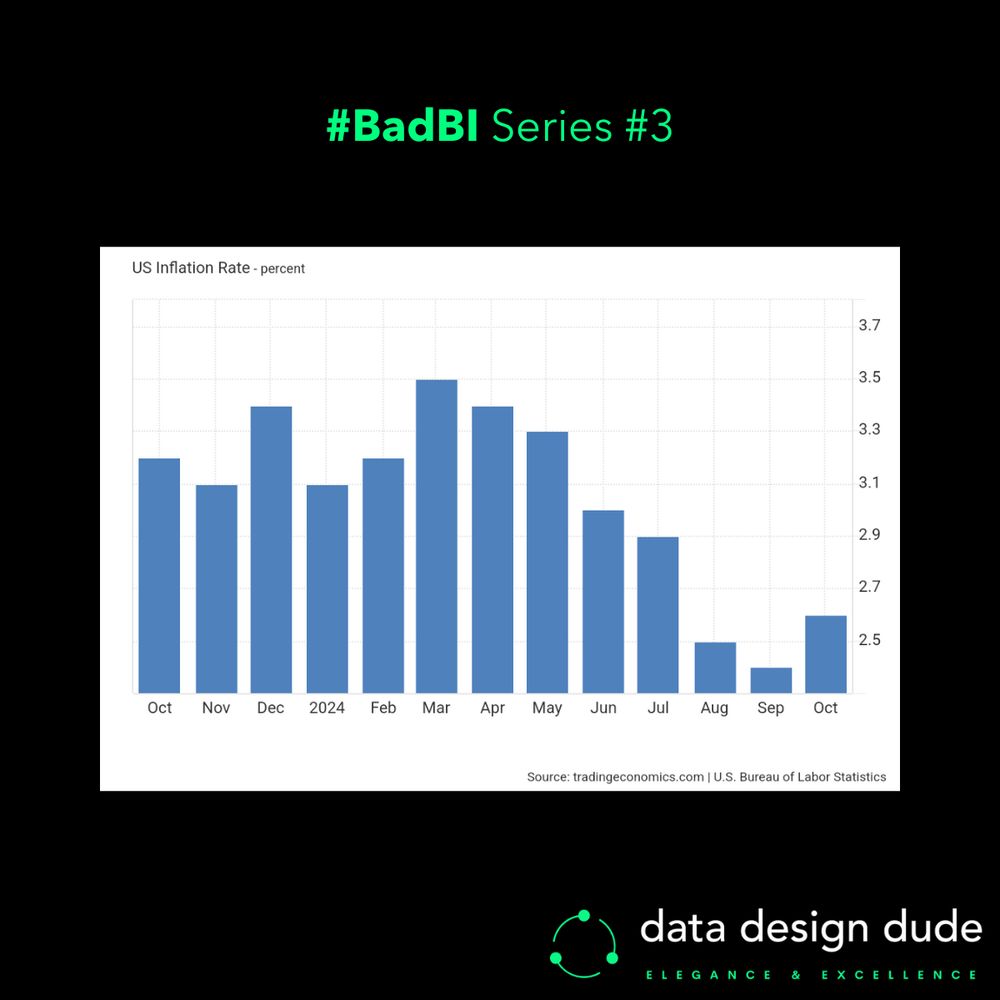
The more I look at this chart, the more I see it sucks 🍑…
I’ll explain quickly why:
I’ll explain quickly why:
February 14, 2025 at 4:49 PM
The more I look at this chart, the more I see it sucks 🍑…
I’ll explain quickly why:
I’ll explain quickly why:
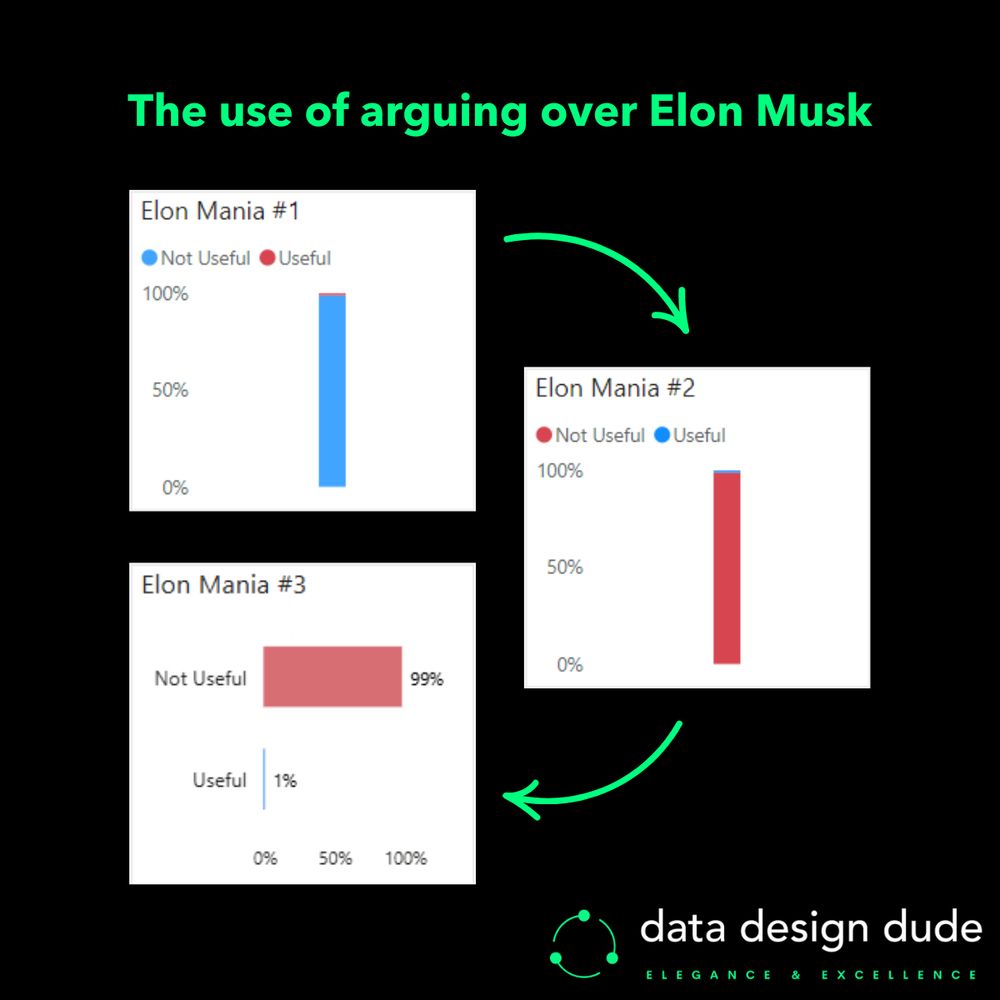
You sick of seeing #ElonMusk everywhere too?.. 😑
I definitely am. And even more than that, I’m sick of the “I know we should keep politics of LinkedIn buuut…” posts whose writers somehow all think they’re the very 1st person to think of a certain take.
🧵⤵
I definitely am. And even more than that, I’m sick of the “I know we should keep politics of LinkedIn buuut…” posts whose writers somehow all think they’re the very 1st person to think of a certain take.
🧵⤵
January 28, 2025 at 11:01 PM
You sick of seeing #ElonMusk everywhere too?.. 😑
I definitely am. And even more than that, I’m sick of the “I know we should keep politics of LinkedIn buuut…” posts whose writers somehow all think they’re the very 1st person to think of a certain take.
🧵⤵
I definitely am. And even more than that, I’m sick of the “I know we should keep politics of LinkedIn buuut…” posts whose writers somehow all think they’re the very 1st person to think of a certain take.
🧵⤵
There are 8 types of relationships we display with graphs.
How many of these do you know? ⤵
- Times series
- Ranking
- Part-to-whole
- Deviation
- Distribution
- Correlation
- Geospatial
- Nominal comparison
#BusinessIntelligence #Data #Analytics #DataVisualization
How many of these do you know? ⤵
- Times series
- Ranking
- Part-to-whole
- Deviation
- Distribution
- Correlation
- Geospatial
- Nominal comparison
#BusinessIntelligence #Data #Analytics #DataVisualization
December 17, 2024 at 10:58 PM
There are 8 types of relationships we display with graphs.
How many of these do you know? ⤵
- Times series
- Ranking
- Part-to-whole
- Deviation
- Distribution
- Correlation
- Geospatial
- Nominal comparison
#BusinessIntelligence #Data #Analytics #DataVisualization
How many of these do you know? ⤵
- Times series
- Ranking
- Part-to-whole
- Deviation
- Distribution
- Correlation
- Geospatial
- Nominal comparison
#BusinessIntelligence #Data #Analytics #DataVisualization
Why every [ambitious] professional should learn a bit about #DataVisualization...
110 years ago, an American engineer named William C. Brinton wrote the first book on data presentation and in it he wrote a better answer to the above question than what I can come up with:
110 years ago, an American engineer named William C. Brinton wrote the first book on data presentation and in it he wrote a better answer to the above question than what I can come up with:

November 26, 2024 at 12:35 AM
Why every [ambitious] professional should learn a bit about #DataVisualization...
110 years ago, an American engineer named William C. Brinton wrote the first book on data presentation and in it he wrote a better answer to the above question than what I can come up with:
110 years ago, an American engineer named William C. Brinton wrote the first book on data presentation and in it he wrote a better answer to the above question than what I can come up with: