


Darío San Segundo Molina
@dario-ssm.bsky.social
PhD Candidate at Universidad de Alcalá.
Focused on thermal ecology of major crop pests.
Focused on thermal ecology of major crop pests.

Hoy en el wrapped me ha salido @rufustf.bsky.social como mi principal acompañante.
En medio del caos, algunas cosas buenas que lo valen todo.
(Foto de una pradera al norte de Madrid en una mañana de domingo de paseo con mi madre)
En medio del caos, algunas cosas buenas que lo valen todo.
(Foto de una pradera al norte de Madrid en una mañana de domingo de paseo con mi madre)

December 3, 2025 at 10:30 PM
Hoy en el wrapped me ha salido @rufustf.bsky.social como mi principal acompañante.
En medio del caos, algunas cosas buenas que lo valen todo.
(Foto de una pradera al norte de Madrid en una mañana de domingo de paseo con mi madre)
En medio del caos, algunas cosas buenas que lo valen todo.
(Foto de una pradera al norte de Madrid en una mañana de domingo de paseo con mi madre)
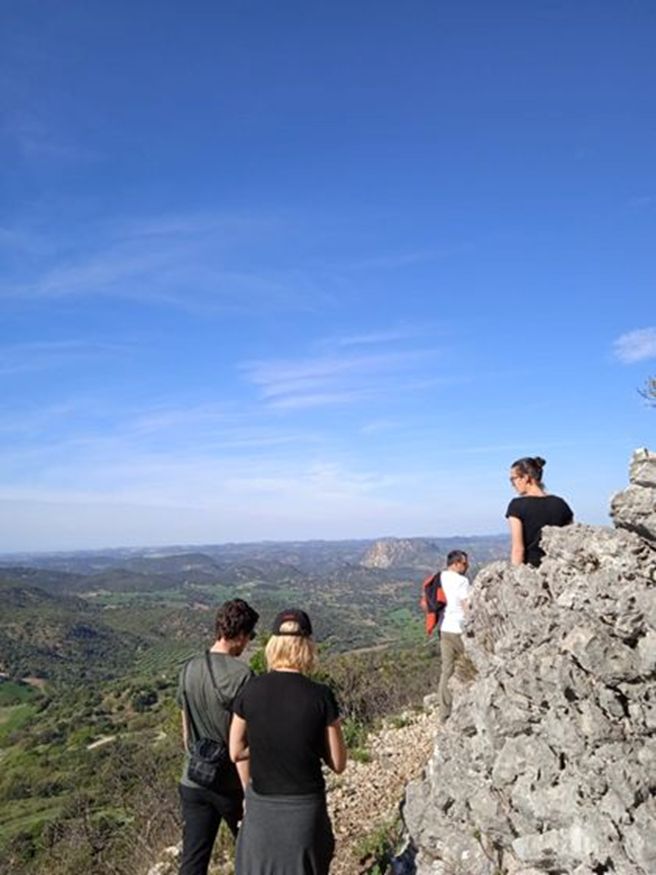
This workshop has been one of the best moments in these PhD years, as it was celebrated in an inspiring place near Grazalema, in Southern Spain
November 20, 2025 at 4:34 PM
This workshop has been one of the best moments in these PhD years, as it was celebrated in an inspiring place near Grazalema, in Southern Spain
mappestRisk has been possible thanks to the Workshop on R packages for ecology (ecologyr.github.io/workshop/), a great initiative by
@frodsan.bsky.social
). The R packages BlueCarbon (github.com/EcologyR/Blu...) and labeler (github.com/EcologyR/lab...) are also results of this workshop.
@frodsan.bsky.social
). The R packages BlueCarbon (github.com/EcologyR/Blu...) and labeler (github.com/EcologyR/lab...) are also results of this workshop.

November 20, 2025 at 4:34 PM
mappestRisk has been possible thanks to the Workshop on R packages for ecology (ecologyr.github.io/workshop/), a great initiative by
@frodsan.bsky.social
). The R packages BlueCarbon (github.com/EcologyR/Blu...) and labeler (github.com/EcologyR/lab...) are also results of this workshop.
@frodsan.bsky.social
). The R packages BlueCarbon (github.com/EcologyR/Blu...) and labeler (github.com/EcologyR/lab...) are also results of this workshop.
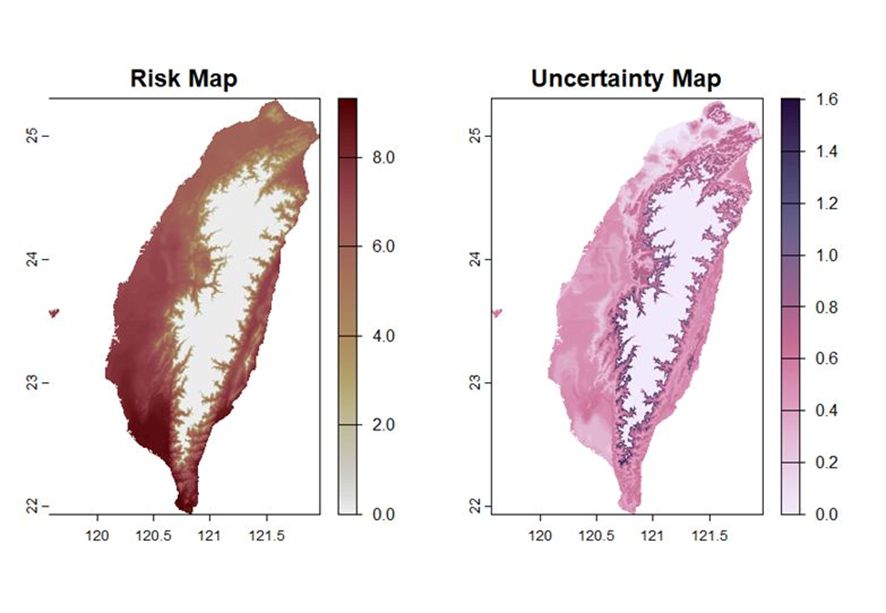
4. The function map_risk() automatically downloads climatic data from WorldClim (worldclim.org/data/worldcl...) for the user-defined target region and calculate how many months per year would have optimal temperatures for pest development. The output is a raster map with the potential pest risk.
November 20, 2025 at 4:34 PM
4. The function map_risk() automatically downloads climatic data from WorldClim (worldclim.org/data/worldcl...) for the user-defined target region and calculate how many months per year would have optimal temperatures for pest development. The output is a raster map with the potential pest risk.
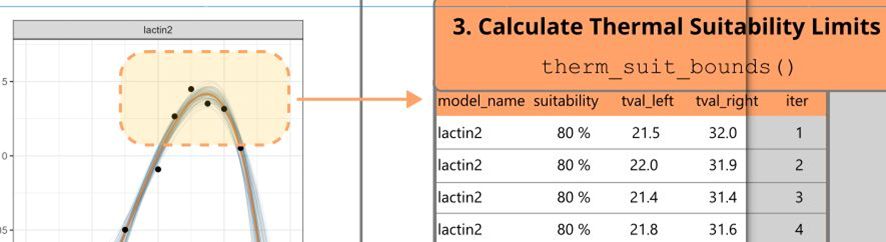
4. Calculate the range of temperatures that result optimal for pest development with therm_suit_bounds().
November 20, 2025 at 4:34 PM
4. Calculate the range of temperatures that result optimal for pest development with therm_suit_bounds().
3. Simulate multiple curves with bootstrap to propagate uncertainty in the parameters of the fitted TPCs and draw ribbons with predict_curves() and plot_uncertainties()

November 20, 2025 at 4:34 PM
3. Simulate multiple curves with bootstrap to propagate uncertainty in the parameters of the fitted TPCs and draw ribbons with predict_curves() and plot_uncertainties()
2. Visualize and compare fitted curves easily with plot_devmodels().

November 20, 2025 at 4:34 PM
2. Visualize and compare fitted curves easily with plot_devmodels().
which was celebrated in an inspiring place near Grazalema, in Southern Spain.

November 20, 2025 at 1:50 PM
which was celebrated in an inspiring place near Grazalema, in Southern Spain.
…and would not have been possible without the R packages for ecology workshop (ecologyr.github.io/workshop/), a great initiative by @frodsan.bsky.social).
The R packages BlueCarbon (github.com/EcologyR/Blu...) and labeler (github.com/EcologyR/lab...) are also results of this workshop.
The R packages BlueCarbon (github.com/EcologyR/Blu...) and labeler (github.com/EcologyR/lab...) are also results of this workshop.

November 20, 2025 at 1:50 PM
…and would not have been possible without the R packages for ecology workshop (ecologyr.github.io/workshop/), a great initiative by @frodsan.bsky.social).
The R packages BlueCarbon (github.com/EcologyR/Blu...) and labeler (github.com/EcologyR/lab...) are also results of this workshop.
The R packages BlueCarbon (github.com/EcologyR/Blu...) and labeler (github.com/EcologyR/lab...) are also results of this workshop.
4. The function map_risk() automatically downloads climatic data from WorldClim (worldclim.org/data/worldcl...) for the user-defined target region and calculate how many months per year would have optimal temperatures for pest development. The output is a raster map with the potential pest risk.

November 20, 2025 at 1:50 PM
4. The function map_risk() automatically downloads climatic data from WorldClim (worldclim.org/data/worldcl...) for the user-defined target region and calculate how many months per year would have optimal temperatures for pest development. The output is a raster map with the potential pest risk.
3. Calculate the range of temperatures that result optimal for pest development with therm_suit_bounds().

November 20, 2025 at 1:50 PM
3. Calculate the range of temperatures that result optimal for pest development with therm_suit_bounds().
3. Simulate multiple curves with bootstrap to propagate uncertainty in the parameters of the fitted TPCs and draw ribbons with predict_curves() and plot_uncertainties()

November 20, 2025 at 1:50 PM
3. Simulate multiple curves with bootstrap to propagate uncertainty in the parameters of the fitted TPCs and draw ribbons with predict_curves() and plot_uncertainties()
2. Visualize and compare fitted curves easily with plot_devmodels().

November 20, 2025 at 1:50 PM
2. Visualize and compare fitted curves easily with plot_devmodels().
Estas sí son más útiles

February 14, 2025 at 3:28 PM
Estas sí son más útiles
A veces la figura no sirve de mucho pero queda bonita

February 14, 2025 at 2:46 PM
A veces la figura no sirve de mucho pero queda bonita