


Carlos Odio
@carlosodio.bsky.social
Co-founder, Equis Research. Miamian living in New Jersey. Not a pollster I just poll a lot.
In NJ-09, one of the state’s most-watched CDs, Sherrill way over-performed 2024 support in the densest Hispanic precincts. Given recent past, it is reasonable to expect that 2025, not 2024, is the proper benchmark for 2026. That’s a big boost for incumbent Nellie Pou.

November 5, 2025 at 7:22 PM
In NJ-09, one of the state’s most-watched CDs, Sherrill way over-performed 2024 support in the densest Hispanic precincts. Given recent past, it is reasonable to expect that 2025, not 2024, is the proper benchmark for 2026. That’s a big boost for incumbent Nellie Pou.
Here’s Passaic County now, preliminarily. Sherrill support closely tracks Murphy ‘21 in Hispanic precincts, way outperforming Harris there. Turnout is lower in Hispanic areas, per usual for Passaic, but less notable in 2025 than in 2021.


November 5, 2025 at 2:25 PM
Here’s Passaic County now, preliminarily. Sherrill support closely tracks Murphy ‘21 in Hispanic precincts, way outperforming Harris there. Turnout is lower in Hispanic areas, per usual for Passaic, but less notable in 2025 than in 2021.
Looking at all available precincts in Hudson County, Sherrill support is higher in the most-densely Hispanic turf & tracks closely with '21. Turnout is *higher* than '21 across the county-- and even more so in the most Hispanic precincts.


November 5, 2025 at 4:58 AM
Looking at all available precincts in Hudson County, Sherrill support is higher in the most-densely Hispanic turf & tracks closely with '21. Turnout is *higher* than '21 across the county-- and even more so in the most Hispanic precincts.
Update: safe to say that Trump discontent isn't a polling mirage. Partial end-of-night #s have Sherrill coming in at around '21 levels in key Hispanic cities in NJ: in aggregate, higher than '20/'24, but lower than '16/'17. The tape is rewound a bit heading into '26.


November 5, 2025 at 4:57 AM
Update: safe to say that Trump discontent isn't a polling mirage. Partial end-of-night #s have Sherrill coming in at around '21 levels in key Hispanic cities in NJ: in aggregate, higher than '20/'24, but lower than '16/'17. The tape is rewound a bit heading into '26.
NJ election is the first real measure of Latino support since last year. A test of whether the Trump discontent in polls is re-shaping behavior heading into '26: will Sherrill come in closer to '21 or '24 in Hispanic bellwethers?
Here are cities to watch. Note '24 vs. prior.
Here are cities to watch. Note '24 vs. prior.


November 4, 2025 at 8:48 PM
NJ election is the first real measure of Latino support since last year. A test of whether the Trump discontent in polls is re-shaping behavior heading into '26: will Sherrill come in closer to '21 or '24 in Hispanic bellwethers?
Here are cities to watch. Note '24 vs. prior.
Here are cities to watch. Note '24 vs. prior.
Cue Montell Jordan: this is how you do it

December 7, 2024 at 3:39 AM
Cue Montell Jordan: this is how you do it
This one breaks my heart. There is wishful thinking here. But also rational calculation based on past experience (see: enforcement of DeSantis immigration law). And there’s what came to be understood on campaign trail (Vance: “we start with the criminal migrants”), w/o pushback from Harris campaign.

November 26, 2024 at 6:14 PM
This one breaks my heart. There is wishful thinking here. But also rational calculation based on past experience (see: enforcement of DeSantis immigration law). And there’s what came to be understood on campaign trail (Vance: “we start with the criminal migrants”), w/o pushback from Harris campaign.
“It’s not fair” — the sentiment at the heart of things, from those frustrated by broken immigration promises
Great @propublica.org piece
t.co/0ic8u6oGNm
Great @propublica.org piece
t.co/0ic8u6oGNm

November 26, 2024 at 2:15 PM
“It’s not fair” — the sentiment at the heart of things, from those frustrated by broken immigration promises
Great @propublica.org piece
t.co/0ic8u6oGNm
Great @propublica.org piece
t.co/0ic8u6oGNm
By comparison, Harris voters weren't ticket splitting as much.
In Latino-heavy precincts, more "none of the above" than explicit Brown splitting; the opposite in the least Hispanic precincts.
In Latino-heavy precincts, more "none of the above" than explicit Brown splitting; the opposite in the least Hispanic precincts.

November 22, 2024 at 10:00 PM
By comparison, Harris voters weren't ticket splitting as much.
In Latino-heavy precincts, more "none of the above" than explicit Brown splitting; the opposite in the least Hispanic precincts.
In Latino-heavy precincts, more "none of the above" than explicit Brown splitting; the opposite in the least Hispanic precincts.
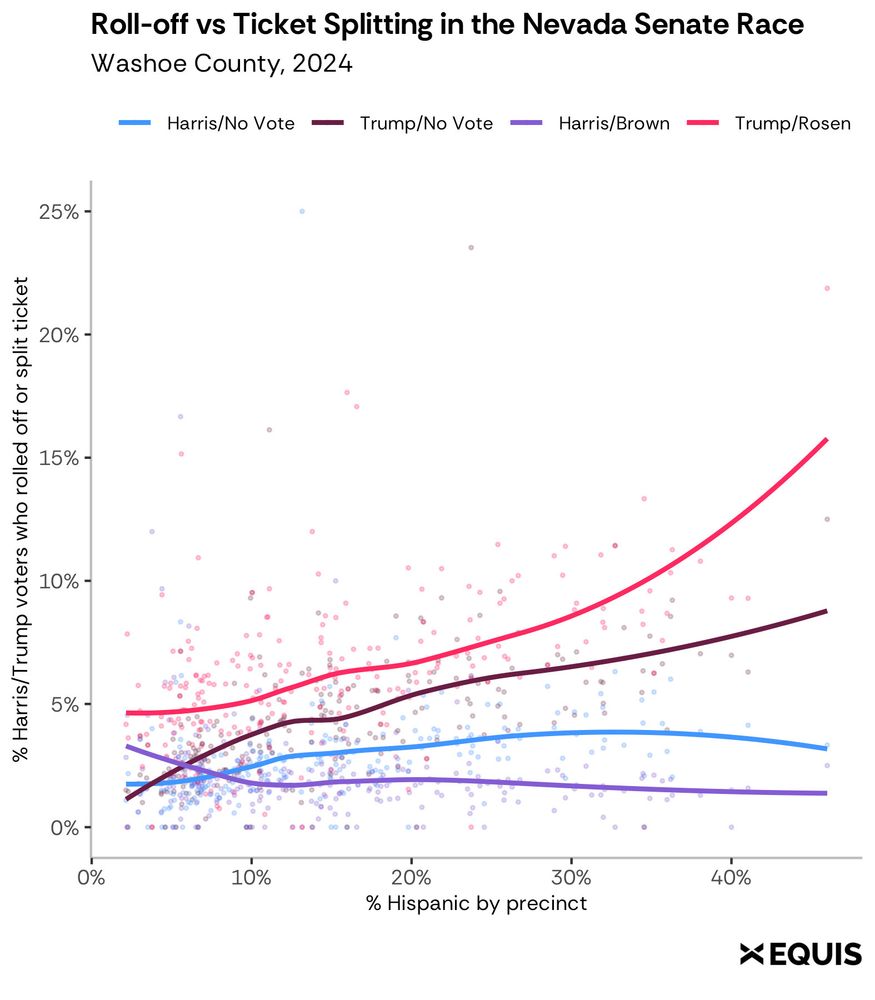
Here's another way to look at it. As Washoe precincts get more Hispanic, there is more ticket-splitting AND more de facto roll-off (Nevada's unique "none of the above" option) among Trump voters.

November 22, 2024 at 10:00 PM
Here's another way to look at it. As Washoe precincts get more Hispanic, there is more ticket-splitting AND more de facto roll-off (Nevada's unique "none of the above" option) among Trump voters.
In Washoe's heavily Latino precincts (30%+), 8.6% of Trump voters voted for Rosen, 8.9% voted "none of the above" or 3rd party & 1.5% skipped altogether.

November 22, 2024 at 10:00 PM
In Washoe's heavily Latino precincts (30%+), 8.6% of Trump voters voted for Rosen, 8.9% voted "none of the above" or 3rd party & 1.5% skipped altogether.
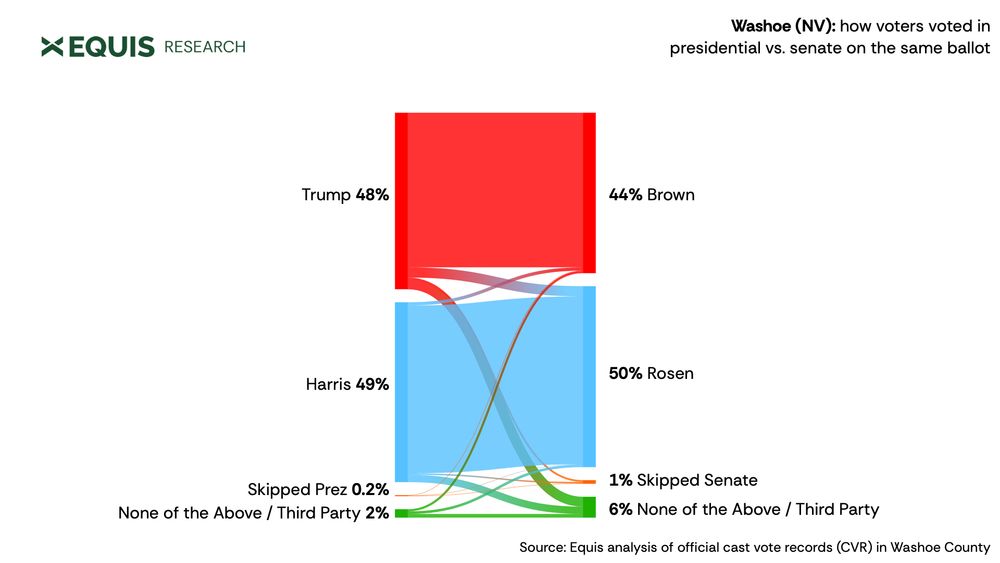
Update: cast vote records (CVR) in Washoe (NV) allow us to see the choices voters made on the whole ballot.
Overall, 5.8% of Trump voters went for Rosen, 5.5% went "none of the above" or 3rd party, and 1% skipped.
(And there was more splitting in Latino precincts...)
Overall, 5.8% of Trump voters went for Rosen, 5.5% went "none of the above" or 3rd party, and 1% skipped.
(And there was more splitting in Latino precincts...)
November 22, 2024 at 10:00 PM
Update: cast vote records (CVR) in Washoe (NV) allow us to see the choices voters made on the whole ballot.
Overall, 5.8% of Trump voters went for Rosen, 5.5% went "none of the above" or 3rd party, and 1% skipped.
(And there was more splitting in Latino precincts...)
Overall, 5.8% of Trump voters went for Rosen, 5.5% went "none of the above" or 3rd party, and 1% skipped.
(And there was more splitting in Latino precincts...)
In AZ-Sen, Gallego under-performed Biden, but by less – he hews closer to that '20 line.

November 21, 2024 at 2:41 PM
In AZ-Sen, Gallego under-performed Biden, but by less – he hews closer to that '20 line.
*Arizona*
In majority Hispanic precincts across Maricopa (Phoenix) & Pima (Tucson):
Clinton 2016: 80
Biden 2020: 75
Gallego 2024: 74
Harris 2024: 68
In majority Hispanic precincts across Maricopa (Phoenix) & Pima (Tucson):
Clinton 2016: 80
Biden 2020: 75
Gallego 2024: 74
Harris 2024: 68

November 21, 2024 at 2:41 PM
*Arizona*
In majority Hispanic precincts across Maricopa (Phoenix) & Pima (Tucson):
Clinton 2016: 80
Biden 2020: 75
Gallego 2024: 74
Harris 2024: 68
In majority Hispanic precincts across Maricopa (Phoenix) & Pima (Tucson):
Clinton 2016: 80
Biden 2020: 75
Gallego 2024: 74
Harris 2024: 68
In NV-Sen, Rosen came short of Biden '20 levels but out-performed Harris — most in the heaviest Latino areas.

November 21, 2024 at 2:41 PM
In NV-Sen, Rosen came short of Biden '20 levels but out-performed Harris — most in the heaviest Latino areas.
*Nevada*
In majority-Hispanic precincts in Clark (Las Vegas):
Clinton 2016: 84
Biden 2020: 75
Rosen 2024: 72
Harris 2024: 67
Harris under-performed Biden across the board but most, seemingly, in densely Hispanic precincts. A large drop two prez cycles in a row.
In majority-Hispanic precincts in Clark (Las Vegas):
Clinton 2016: 84
Biden 2020: 75
Rosen 2024: 72
Harris 2024: 67
Harris under-performed Biden across the board but most, seemingly, in densely Hispanic precincts. A large drop two prez cycles in a row.

November 21, 2024 at 2:41 PM
*Nevada*
In majority-Hispanic precincts in Clark (Las Vegas):
Clinton 2016: 84
Biden 2020: 75
Rosen 2024: 72
Harris 2024: 67
Harris under-performed Biden across the board but most, seemingly, in densely Hispanic precincts. A large drop two prez cycles in a row.
In majority-Hispanic precincts in Clark (Las Vegas):
Clinton 2016: 84
Biden 2020: 75
Rosen 2024: 72
Harris 2024: 67
Harris under-performed Biden across the board but most, seemingly, in densely Hispanic precincts. A large drop two prez cycles in a row.
Slotkin joins Casey (PA) as Senate Dems who outperformed Harris in Hispanic areas but did not approach Biden '20 levels (unlike AZ/NV/WI)


November 21, 2024 at 2:41 PM
Slotkin joins Casey (PA) as Senate Dems who outperformed Harris in Hispanic areas but did not approach Biden '20 levels (unlike AZ/NV/WI)
*Michigan*
In 30%+ Hispanic precincts in Kent (Grand Rapids) vs. those in Detroit (not all of Wayne):
Clinton 2016: 87 | 87
Biden 2020: 82 | 82
Slotkin 2024: 75 | 70
Harris 2024: 73 | 66
In 30%+ Hispanic precincts in Kent (Grand Rapids) vs. those in Detroit (not all of Wayne):
Clinton 2016: 87 | 87
Biden 2020: 82 | 82
Slotkin 2024: 75 | 70
Harris 2024: 73 | 66


November 21, 2024 at 2:41 PM
*Michigan*
In 30%+ Hispanic precincts in Kent (Grand Rapids) vs. those in Detroit (not all of Wayne):
Clinton 2016: 87 | 87
Biden 2020: 82 | 82
Slotkin 2024: 75 | 70
Harris 2024: 73 | 66
In 30%+ Hispanic precincts in Kent (Grand Rapids) vs. those in Detroit (not all of Wayne):
Clinton 2016: 87 | 87
Biden 2020: 82 | 82
Slotkin 2024: 75 | 70
Harris 2024: 73 | 66
22% of registered Latinos in Milwaukee live in majority Latino wards. That represents ~8% of all registered Latinos in the state.

November 21, 2024 at 2:41 PM
22% of registered Latinos in Milwaukee live in majority Latino wards. That represents ~8% of all registered Latinos in the state.
*Wisconsin*
In majority Hispanic wards in Milwaukee County:
Clinton 2016: 86
Biden 2020: 78
Baldwin 2024: 76
Harris 2024: 72
Note how close Baldwin got to Biden '20 in the Sen race.
In majority Hispanic wards in Milwaukee County:
Clinton 2016: 86
Biden 2020: 78
Baldwin 2024: 76
Harris 2024: 72
Note how close Baldwin got to Biden '20 in the Sen race.


November 21, 2024 at 2:41 PM
*Wisconsin*
In majority Hispanic wards in Milwaukee County:
Clinton 2016: 86
Biden 2020: 78
Baldwin 2024: 76
Harris 2024: 72
Note how close Baldwin got to Biden '20 in the Sen race.
In majority Hispanic wards in Milwaukee County:
Clinton 2016: 86
Biden 2020: 78
Baldwin 2024: 76
Harris 2024: 72
Note how close Baldwin got to Biden '20 in the Sen race.
A word of caution that while dense Latino precincts allow us to narrow in on Hispanics vs. others, they only capture a small share of all Latinos in their respective counties. In the example of PA: 28% in Philly, 42% in Berks, 33% in Lehigh.

November 21, 2024 at 2:41 PM
A word of caution that while dense Latino precincts allow us to narrow in on Hispanics vs. others, they only capture a small share of all Latinos in their respective counties. In the example of PA: 28% in Philly, 42% in Berks, 33% in Lehigh.
PA: Senate vs. Presidential
Casey out-performed Harris in Latino-majority precincts across Philly/Berks/Lehigh, but under-performed Biden '20 more than most other Senate Dems.
Casey out-performed Harris in Latino-majority precincts across Philly/Berks/Lehigh, but under-performed Biden '20 more than most other Senate Dems.

November 21, 2024 at 2:41 PM
PA: Senate vs. Presidential
Casey out-performed Harris in Latino-majority precincts across Philly/Berks/Lehigh, but under-performed Biden '20 more than most other Senate Dems.
Casey out-performed Harris in Latino-majority precincts across Philly/Berks/Lehigh, but under-performed Biden '20 more than most other Senate Dems.
*Pennsylvania*
Across majority Hispanic precincts in Philly, Berks (Reading) & Lehigh (Allentown):
Clinton 2016: 91
Biden 2020: 81
Casey 2024: 74
Harris 2024: 71
Across majority Hispanic precincts in Philly, Berks (Reading) & Lehigh (Allentown):
Clinton 2016: 91
Biden 2020: 81
Casey 2024: 74
Harris 2024: 71


November 21, 2024 at 2:41 PM
*Pennsylvania*
Across majority Hispanic precincts in Philly, Berks (Reading) & Lehigh (Allentown):
Clinton 2016: 91
Biden 2020: 81
Casey 2024: 74
Harris 2024: 71
Across majority Hispanic precincts in Philly, Berks (Reading) & Lehigh (Allentown):
Clinton 2016: 91
Biden 2020: 81
Casey 2024: 74
Harris 2024: 71
“You’re going to have to do both.”

November 20, 2024 at 12:49 PM
“You’re going to have to do both.”
Early look at cast vote records (CVR) in Washoe (NV), which allow us to see the choices voters made on the whole ballot: overall, 6% of Trump voters went for Rosen, to 4% who skipped the race.
The chart shows Trump voters in Latino precincts were the most likely to either ticket-split or roll-off.
The chart shows Trump voters in Latino precincts were the most likely to either ticket-split or roll-off.
November 19, 2024 at 2:07 PM
Early look at cast vote records (CVR) in Washoe (NV), which allow us to see the choices voters made on the whole ballot: overall, 6% of Trump voters went for Rosen, to 4% who skipped the race.
The chart shows Trump voters in Latino precincts were the most likely to either ticket-split or roll-off.
The chart shows Trump voters in Latino precincts were the most likely to either ticket-split or roll-off.