


Giacomo Bignardi
@bignardi.bsky.social
Research Associate at the Social, Genetic & Developmental Psychiatry Centre, Kings College London. Interests: developmental psychology, data science, coffee. www.bignardi.co.uk
I think both methods should converge to the same answer as the number of draws -> ∞. I think your approach is 1-V_w/V whereas empirical reliability is defined as v_a/(v_a+v_w) - but it should be the same as draws -> ∞. Pic from onlinelibrary.wiley.com/doi/10.1002/...

October 1, 2025 at 11:38 AM
I think both methods should converge to the same answer as the number of draws -> ∞. I think your approach is 1-V_w/V whereas empirical reliability is defined as v_a/(v_a+v_w) - but it should be the same as draws -> ∞. Pic from onlinelibrary.wiley.com/doi/10.1002/...
We also compared RMU to coefficient alpha and H (Study 1) and split-half reliability (Study 2). RMU generally had lower bias and error, as well as better coverage. However, the main benefit of RMU is that it can be applied across a wide range of Bayesian measurement models - unlike alpha.


October 1, 2025 at 8:17 AM
We also compared RMU to coefficient alpha and H (Study 1) and split-half reliability (Study 2). RMU generally had lower bias and error, as well as better coverage. However, the main benefit of RMU is that it can be applied across a wide range of Bayesian measurement models - unlike alpha.
We ran 3 simulation studies to evaluate RMU's bias, accuracy and coverage (% of times the 95% credible intervals included the right answer) across linear factor, signal detection theory and reinforcement learning models. Results were good-to-great across studies and simulation conditions.


October 1, 2025 at 8:17 AM
We ran 3 simulation studies to evaluate RMU's bias, accuracy and coverage (% of times the 95% credible intervals included the right answer) across linear factor, signal detection theory and reinforcement learning models. Results were good-to-great across studies and simulation conditions.
Our method involves taking two random draws (without replacement) from each subject's posterior and computes the correlation between draws. We repeat this process many times and use the distribution of correlations to calculate credible intervals or posterior probabilities (e.g., reliability > .70).

October 1, 2025 at 8:17 AM
Our method involves taking two random draws (without replacement) from each subject's posterior and computes the correlation between draws. We repeat this process many times and use the distribution of correlations to calculate credible intervals or posterior probabilities (e.g., reliability > .70).
Our reliability method can be applied to most fitted Bayesian measurement models. In the example below, I've used a Bayesian signal detection model to estimate posterior distributions for each subject's performance on a go/no-go test. Each curve shows our certainty in each subject's estimate.

October 1, 2025 at 8:17 AM
Our reliability method can be applied to most fitted Bayesian measurement models. In the example below, I've used a Bayesian signal detection model to estimate posterior distributions for each subject's performance on a go/no-go test. Each curve shows our certainty in each subject's estimate.
📈Comparing model predictions for low food insecurity to medium or high food insecurity, we found moderate (.3-.5 standard deviations) changes in depression and adolescent wellbeing scores, and smaller changes (.2-.3 standard deviations) in anxiety, loneliness and positive thoughts.


September 24, 2025 at 12:05 PM
📈Comparing model predictions for low food insecurity to medium or high food insecurity, we found moderate (.3-.5 standard deviations) changes in depression and adolescent wellbeing scores, and smaller changes (.2-.3 standard deviations) in anxiety, loneliness and positive thoughts.
We found 4-5% of CYP sometimes experience food insecurity, and 1-2% often experience food insecurity, across our three questions (F1: food bank usage, F2: food affordability, F3: going to bed hungry). Post-stratification weighting using school census data did not massively alter these estimates.

September 24, 2025 at 12:05 PM
We found 4-5% of CYP sometimes experience food insecurity, and 1-2% often experience food insecurity, across our three questions (F1: food bank usage, F2: food affordability, F3: going to bed hungry). Post-stratification weighting using school census data did not massively alter these estimates.
Your pics just look black to me! Lets see if this works...

July 4, 2025 at 10:33 AM
Your pics just look black to me! Lets see if this works...
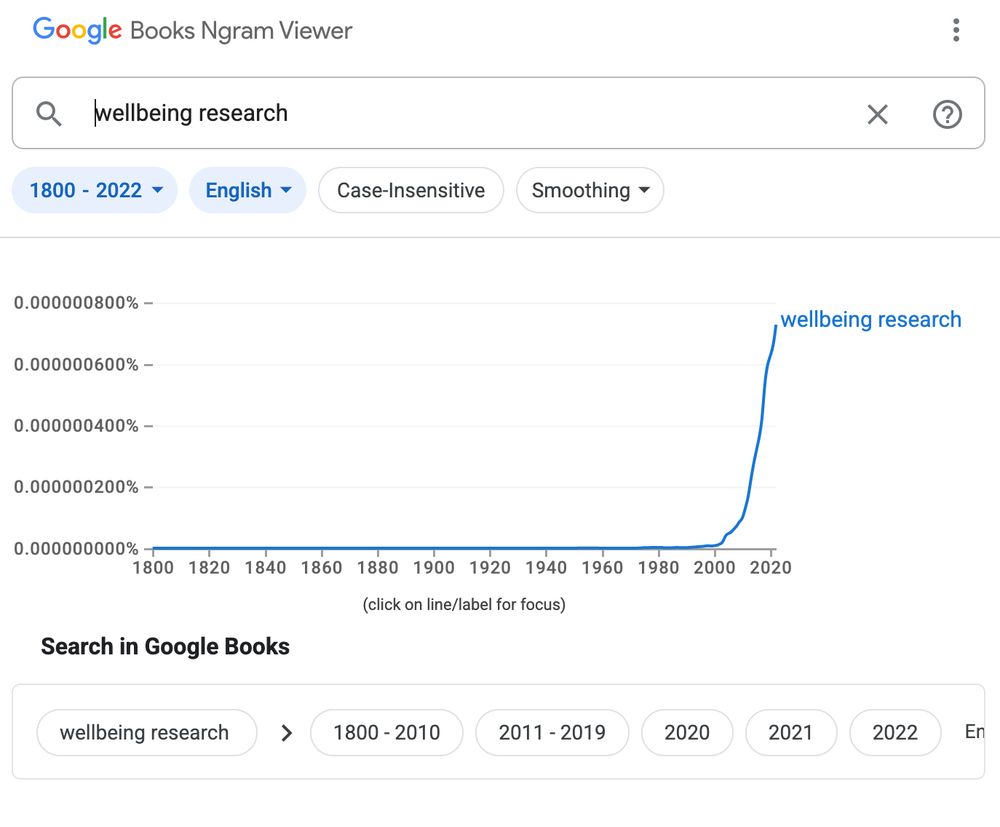
I wonder to what extent this reflects changing terminology - "wellbeing" research is skyrocketing. The content of "wellbeing" and "happiness" scales seems to overlap quite a bit too.
June 19, 2025 at 1:49 PM
I wonder to what extent this reflects changing terminology - "wellbeing" research is skyrocketing. The content of "wellbeing" and "happiness" scales seems to overlap quite a bit too.
Dress code: robes and skullcap optional
"...this is an official speaker invitation, to be a Distinguished Speaker at the upcoming “6th Global Conclave on Neurology and Neurological Disorders" (NEURO Conclave 2025)"
"...this is an official speaker invitation, to be a Distinguished Speaker at the upcoming “6th Global Conclave on Neurology and Neurological Disorders" (NEURO Conclave 2025)"

January 16, 2025 at 5:15 PM
Dress code: robes and skullcap optional
"...this is an official speaker invitation, to be a Distinguished Speaker at the upcoming “6th Global Conclave on Neurology and Neurological Disorders" (NEURO Conclave 2025)"
"...this is an official speaker invitation, to be a Distinguished Speaker at the upcoming “6th Global Conclave on Neurology and Neurological Disorders" (NEURO Conclave 2025)"
American Psychological Association giving big South Park energy this morning

January 8, 2025 at 11:02 AM
American Psychological Association giving big South Park energy this morning
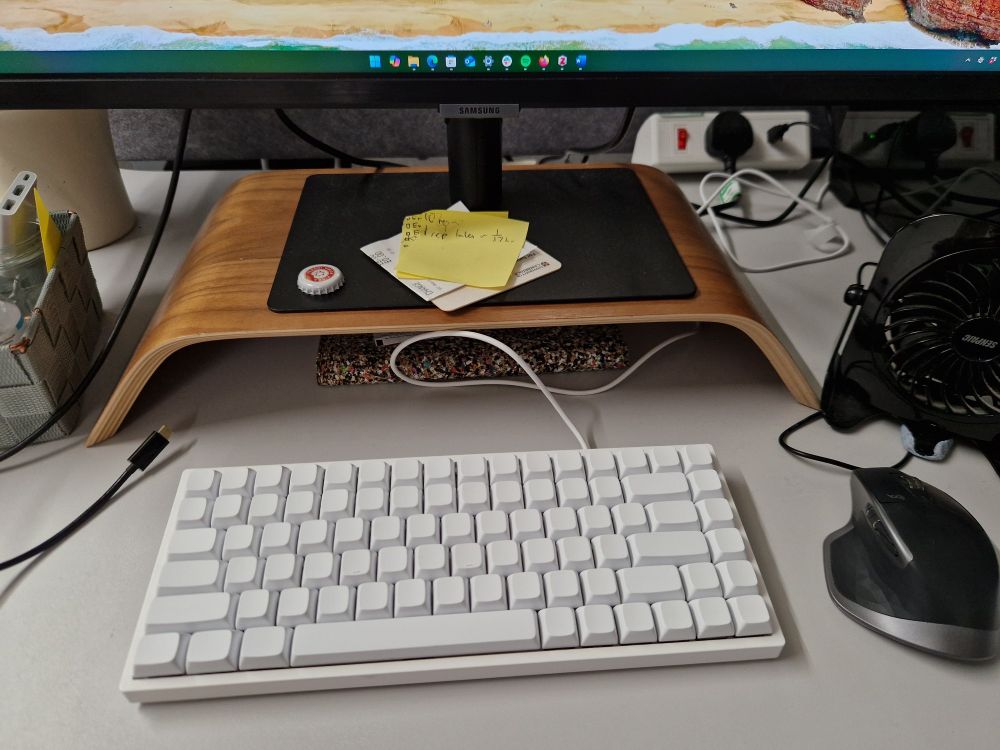
New year, new keyboard (switches & keycaps).
January 6, 2025 at 2:22 PM
New year, new keyboard (switches & keycaps).
& after editing and clicking the submit button at the end, I still see this red bar on the preprint:

August 2, 2024 at 11:54 AM
& after editing and clicking the submit button at the end, I still see this red bar on the preprint:
Okay, this has been driving me crazy all day - is #cran down for anyone else? #rstats #biostats ? 😿
cran.r-project.org
cran.r-project.org

November 15, 2023 at 10:26 PM
Okay, this has been driving me crazy all day - is #cran down for anyone else? #rstats #biostats ? 😿
cran.r-project.org
cran.r-project.org