


Arshi Saleh
@arshisaleh.bsky.social
Tableau Ambassador | Data Visual Designer | 2x #VOTDs | #DataFamRisingStars 2025
#dataviz #datavisualization #tableau #datafam
#dataviz #datavisualization #tableau #datafam
My #dataviz, "APT :Voices For Human Dignity" has won the second place in the 2025 #DataViz Competition🎉 🥈
Thank you @DataConnect Conference, @womeninanalytics, @womenindata and @Apexon
for organizing the event.
#WomenInAnalytics #DataConnectConf #DataStorytelling #DCC2025
Thank you @DataConnect Conference, @womeninanalytics, @womenindata and @Apexon
for organizing the event.
#WomenInAnalytics #DataConnectConf #DataStorytelling #DCC2025


October 8, 2025 at 2:37 PM
My #dataviz, "APT :Voices For Human Dignity" has won the second place in the 2025 #DataViz Competition🎉 🥈
Thank you @DataConnect Conference, @womeninanalytics, @womenindata and @Apexon
for organizing the event.
#WomenInAnalytics #DataConnectConf #DataStorytelling #DCC2025
Thank you @DataConnect Conference, @womeninanalytics, @womenindata and @Apexon
for organizing the event.
#WomenInAnalytics #DataConnectConf #DataStorytelling #DCC2025
Hello #DataFam,
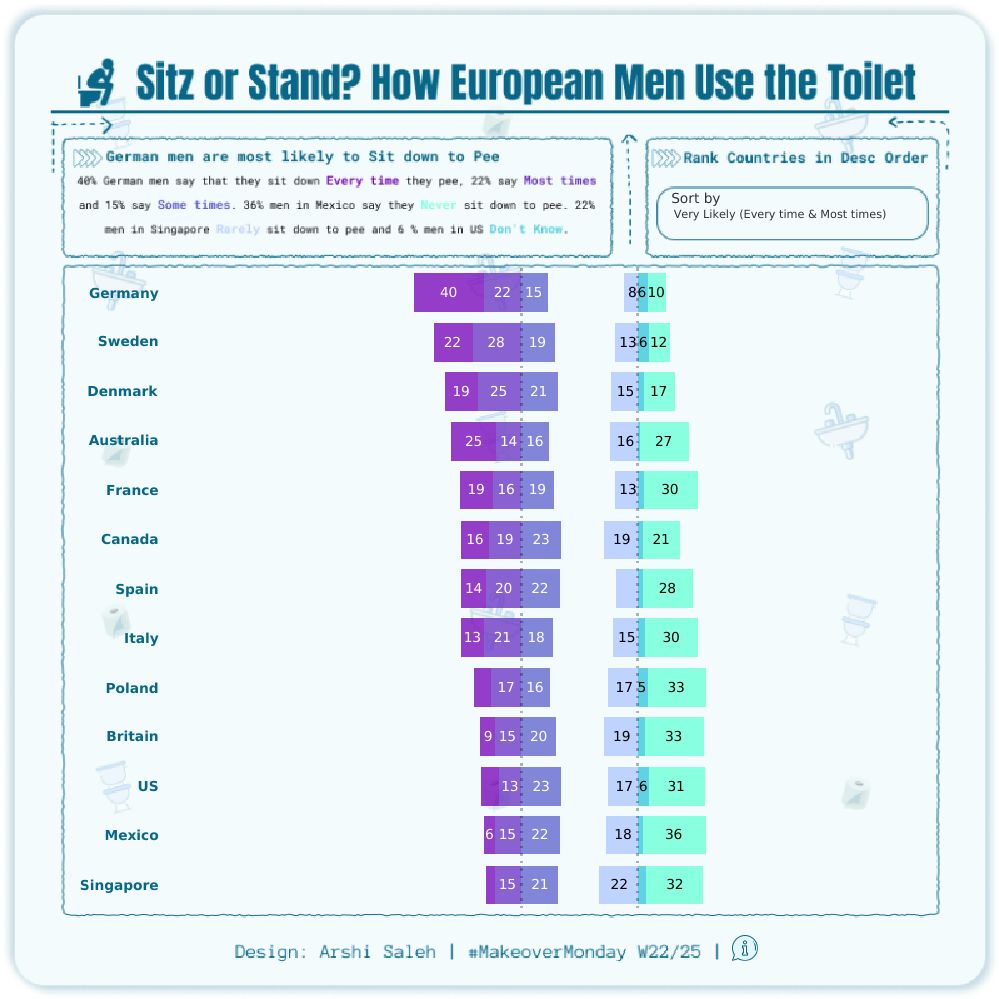
Sharing my submission for W22/25 #makeovermonday.
📊 Tableau Link: public.tableau.com/views/Sitzor...
Hope you enjoy the viz and feel free to share feedback! 😊
Thank you Chimdi Nwosu, Harry Beardon, and Irene Diomi for the challenge!
#tableau #dataviz #datavisualization
Sharing my submission for W22/25 #makeovermonday.
📊 Tableau Link: public.tableau.com/views/Sitzor...
Hope you enjoy the viz and feel free to share feedback! 😊
Thank you Chimdi Nwosu, Harry Beardon, and Irene Diomi for the challenge!
#tableau #dataviz #datavisualization
May 30, 2025 at 6:34 PM
Hello #DataFam,
Sharing my submission for W22/25 #makeovermonday.
📊 Tableau Link: public.tableau.com/views/Sitzor...
Hope you enjoy the viz and feel free to share feedback! 😊
Thank you Chimdi Nwosu, Harry Beardon, and Irene Diomi for the challenge!
#tableau #dataviz #datavisualization
Sharing my submission for W22/25 #makeovermonday.
📊 Tableau Link: public.tableau.com/views/Sitzor...
Hope you enjoy the viz and feel free to share feedback! 😊
Thank you Chimdi Nwosu, Harry Beardon, and Irene Diomi for the challenge!
#tableau #dataviz #datavisualization
Hello #datafam!
My viz "APT: Voices for Human Dignity" is one of the Top 10 Finalists for the Women In Analytics Dataviz Competition!
I now need your support to make it to Top 5. If you like my viz please vote for it.
Voting Link: www.dataconnectconf.com/data-viz-fin...
#dataviz
My viz "APT: Voices for Human Dignity" is one of the Top 10 Finalists for the Women In Analytics Dataviz Competition!
I now need your support to make it to Top 5. If you like my viz please vote for it.
Voting Link: www.dataconnectconf.com/data-viz-fin...
#dataviz
May 10, 2025 at 4:12 PM
Hello #datafam!
My viz "APT: Voices for Human Dignity" is one of the Top 10 Finalists for the Women In Analytics Dataviz Competition!
I now need your support to make it to Top 5. If you like my viz please vote for it.
Voting Link: www.dataconnectconf.com/data-viz-fin...
#dataviz
My viz "APT: Voices for Human Dignity" is one of the Top 10 Finalists for the Women In Analytics Dataviz Competition!
I now need your support to make it to Top 5. If you like my viz please vote for it.
Voting Link: www.dataconnectconf.com/data-viz-fin...
#dataviz
Hello #DataFam,
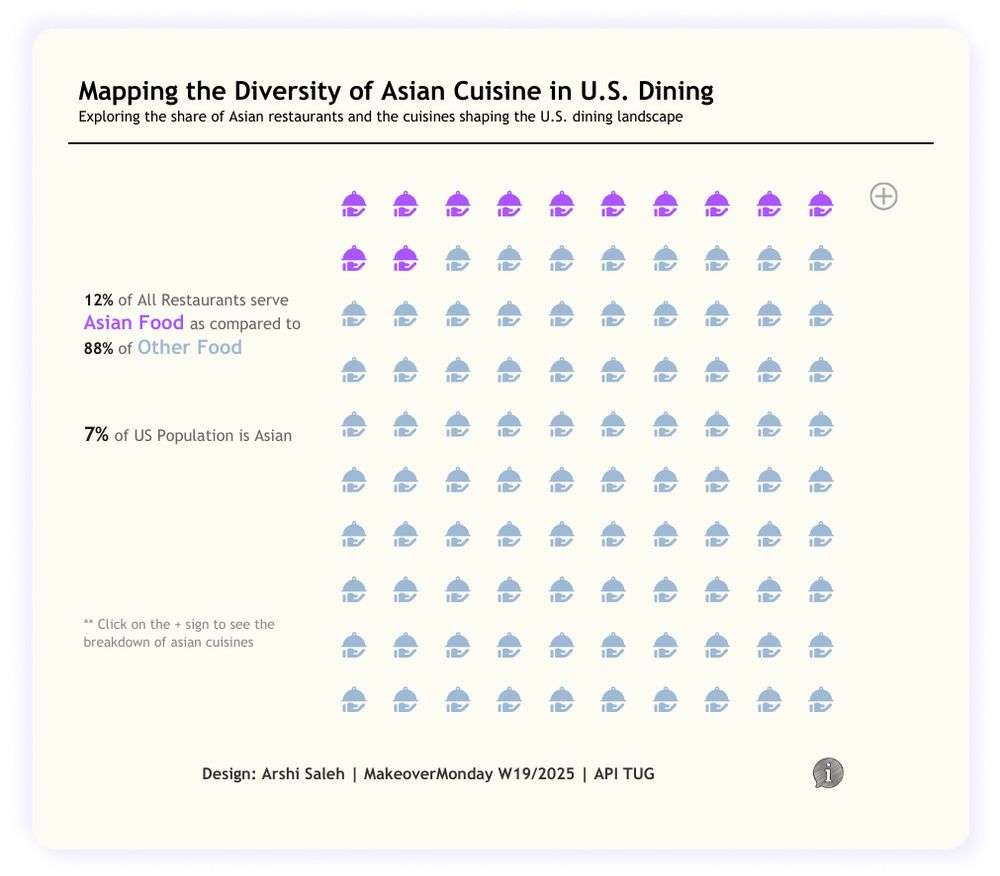
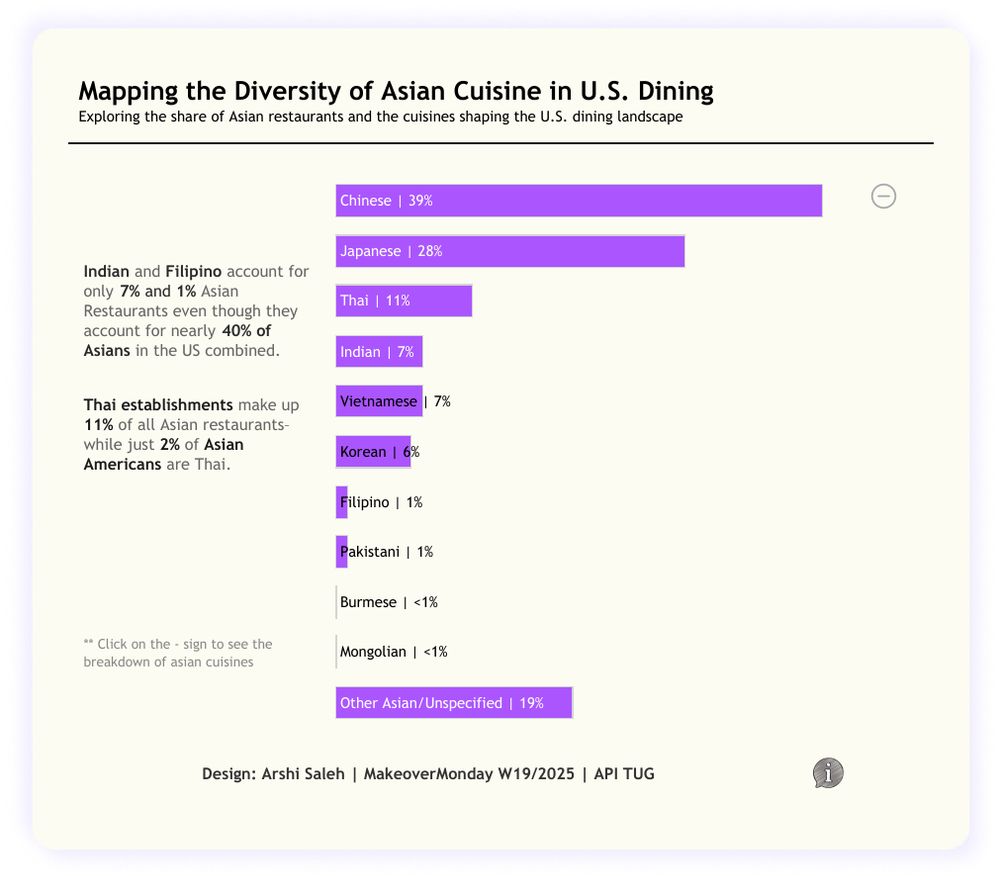
I am excited to share my submission for Week 19/2025 #MakeoverMonday in partnership with API TUG!
📊 Tableau Link: public.tableau.com/views/AsianR...
Hope you enjoy the viz and feel free to share feedback! 😊
Thank you #MakoverMonday team & the API TUG team!
#dataviz #data
I am excited to share my submission for Week 19/2025 #MakeoverMonday in partnership with API TUG!
📊 Tableau Link: public.tableau.com/views/AsianR...
Hope you enjoy the viz and feel free to share feedback! 😊
Thank you #MakoverMonday team & the API TUG team!
#dataviz #data
May 6, 2025 at 7:47 PM
Hello #DataFam,
I am excited to share my submission for Week 19/2025 #MakeoverMonday in partnership with API TUG!
📊 Tableau Link: public.tableau.com/views/AsianR...
Hope you enjoy the viz and feel free to share feedback! 😊
Thank you #MakoverMonday team & the API TUG team!
#dataviz #data
I am excited to share my submission for Week 19/2025 #MakeoverMonday in partnership with API TUG!
📊 Tableau Link: public.tableau.com/views/AsianR...
Hope you enjoy the viz and feel free to share feedback! 😊
Thank you #MakoverMonday team & the API TUG team!
#dataviz #data
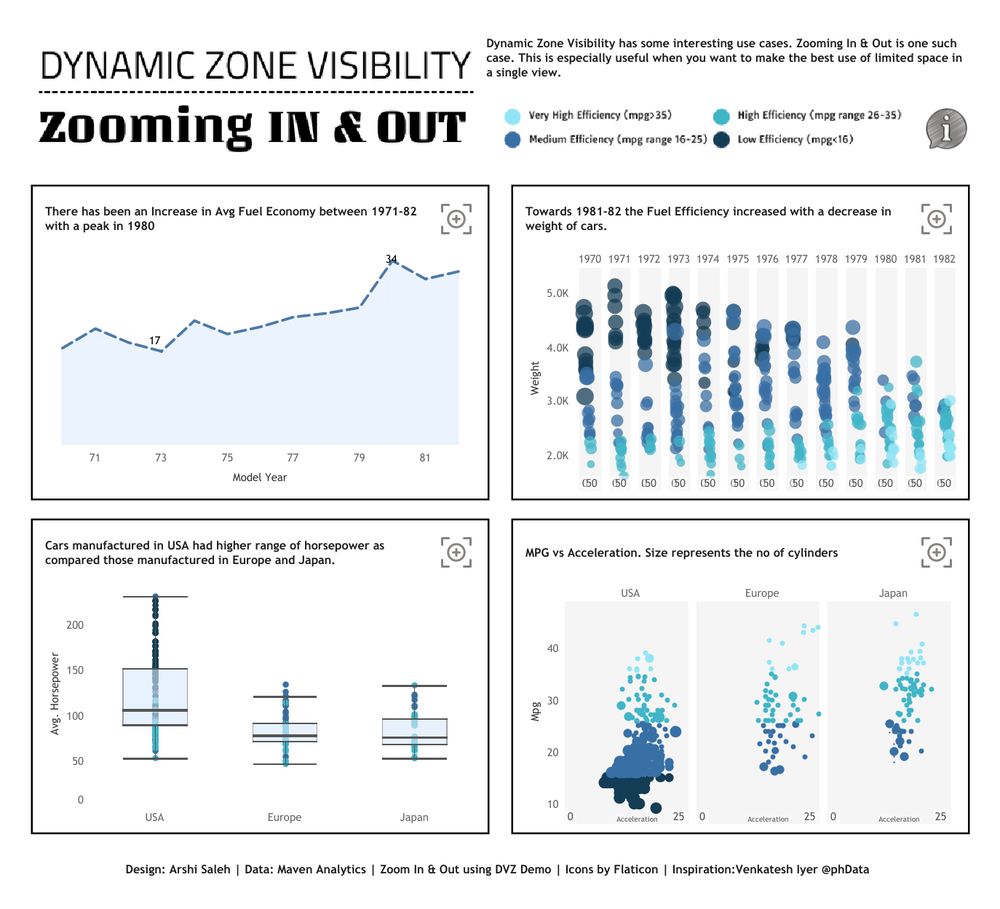
Hey #DataFam!
I am excited to share a hands-on demo I created for adding dynamic view to your dashboard using Zoom In & Out buttons. Download the dashboard to learn how.
🔗 Tableau Link: public.tableau.com/views/Dynami...
#tableau #dashboard #dashboarddesign #zoom #DynamicZoneVisibility
I am excited to share a hands-on demo I created for adding dynamic view to your dashboard using Zoom In & Out buttons. Download the dashboard to learn how.
🔗 Tableau Link: public.tableau.com/views/Dynami...
#tableau #dashboard #dashboarddesign #zoom #DynamicZoneVisibility
May 2, 2025 at 5:39 PM
Hey #DataFam!
I am excited to share a hands-on demo I created for adding dynamic view to your dashboard using Zoom In & Out buttons. Download the dashboard to learn how.
🔗 Tableau Link: public.tableau.com/views/Dynami...
#tableau #dashboard #dashboarddesign #zoom #DynamicZoneVisibility
I am excited to share a hands-on demo I created for adding dynamic view to your dashboard using Zoom In & Out buttons. Download the dashboard to learn how.
🔗 Tableau Link: public.tableau.com/views/Dynami...
#tableau #dashboard #dashboarddesign #zoom #DynamicZoneVisibility
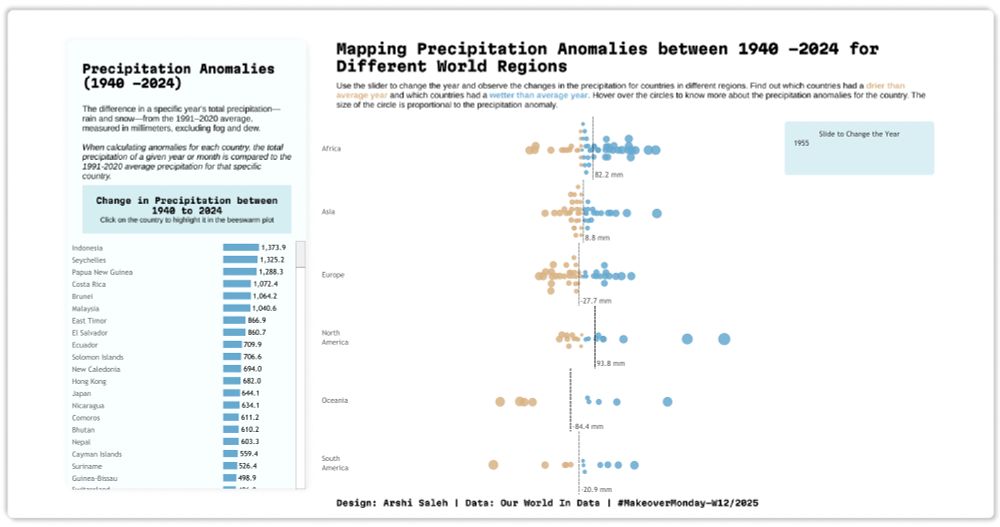
Hello #DataFam,
Sharing my submission for Week 12/2025 #MakeoverMonday!
Dive into this #viz to discover Precipitation Anomalies from year 1940 -2024
📊 Tableau Link: public.tableau.com/views/AWorld...
Feel free to share feedback!
#tableau #datavisualization #makeovermonday #dataviz
Sharing my submission for Week 12/2025 #MakeoverMonday!
Dive into this #viz to discover Precipitation Anomalies from year 1940 -2024
📊 Tableau Link: public.tableau.com/views/AWorld...
Feel free to share feedback!
#tableau #datavisualization #makeovermonday #dataviz
March 24, 2025 at 6:12 AM
Hello #DataFam,
Sharing my submission for Week 12/2025 #MakeoverMonday!
Dive into this #viz to discover Precipitation Anomalies from year 1940 -2024
📊 Tableau Link: public.tableau.com/views/AWorld...
Feel free to share feedback!
#tableau #datavisualization #makeovermonday #dataviz
Sharing my submission for Week 12/2025 #MakeoverMonday!
Dive into this #viz to discover Precipitation Anomalies from year 1940 -2024
📊 Tableau Link: public.tableau.com/views/AWorld...
Feel free to share feedback!
#tableau #datavisualization #makeovermonday #dataviz
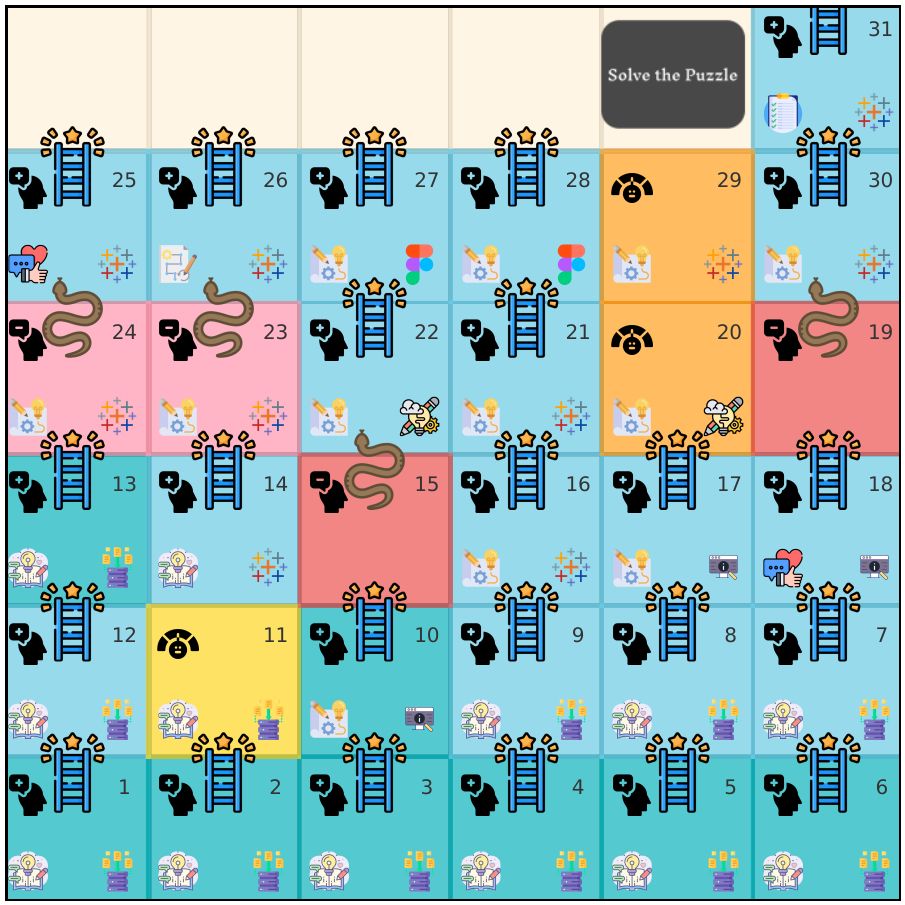
Hello #datafam,
Creating my first #IronViz entry felt like a snakes & ladder game and I want to share the BTS with you through my latest viz. Do dive in to discover the process. 🙂
📊 Tableau Link: public.tableau.com/views/MyIron...
#dataart #ironviz #design #informationdesign #tableau #dataviz
Creating my first #IronViz entry felt like a snakes & ladder game and I want to share the BTS with you through my latest viz. Do dive in to discover the process. 🙂
📊 Tableau Link: public.tableau.com/views/MyIron...
#dataart #ironviz #design #informationdesign #tableau #dataviz
January 14, 2025 at 2:28 PM
Hello #datafam,
Creating my first #IronViz entry felt like a snakes & ladder game and I want to share the BTS with you through my latest viz. Do dive in to discover the process. 🙂
📊 Tableau Link: public.tableau.com/views/MyIron...
#dataart #ironviz #design #informationdesign #tableau #dataviz
Creating my first #IronViz entry felt like a snakes & ladder game and I want to share the BTS with you through my latest viz. Do dive in to discover the process. 🙂
📊 Tableau Link: public.tableau.com/views/MyIron...
#dataart #ironviz #design #informationdesign #tableau #dataviz
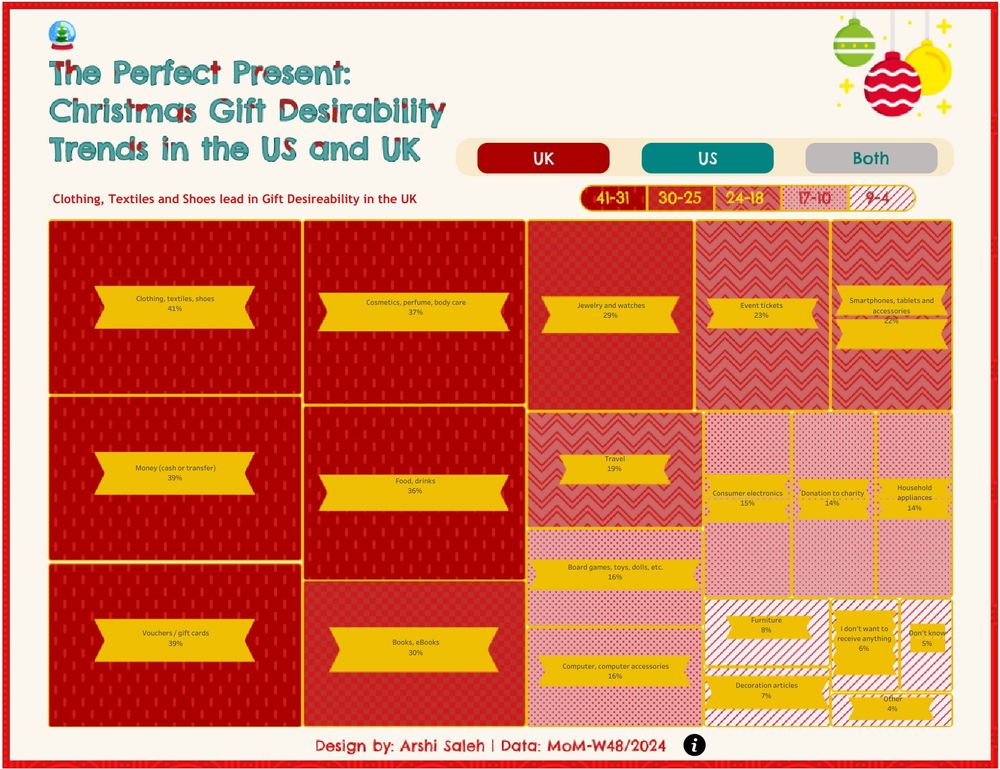
Hello #DataFam,
Sharing my submission for this week's #MakeoverMonday. If you are based in UK or US and are looking for the perfect gift for family & friends then this is the viz for you.
📊 #Tableau Link: public.tableau.com/views/Christ...
#dataviz 📊 #datavisualization #art 📊 #Data&Viz
Sharing my submission for this week's #MakeoverMonday. If you are based in UK or US and are looking for the perfect gift for family & friends then this is the viz for you.
📊 #Tableau Link: public.tableau.com/views/Christ...
#dataviz 📊 #datavisualization #art 📊 #Data&Viz
December 16, 2024 at 9:27 AM
Hello #DataFam,
Sharing my submission for this week's #MakeoverMonday. If you are based in UK or US and are looking for the perfect gift for family & friends then this is the viz for you.
📊 #Tableau Link: public.tableau.com/views/Christ...
#dataviz 📊 #datavisualization #art 📊 #Data&Viz
Sharing my submission for this week's #MakeoverMonday. If you are based in UK or US and are looking for the perfect gift for family & friends then this is the viz for you.
📊 #Tableau Link: public.tableau.com/views/Christ...
#dataviz 📊 #datavisualization #art 📊 #Data&Viz
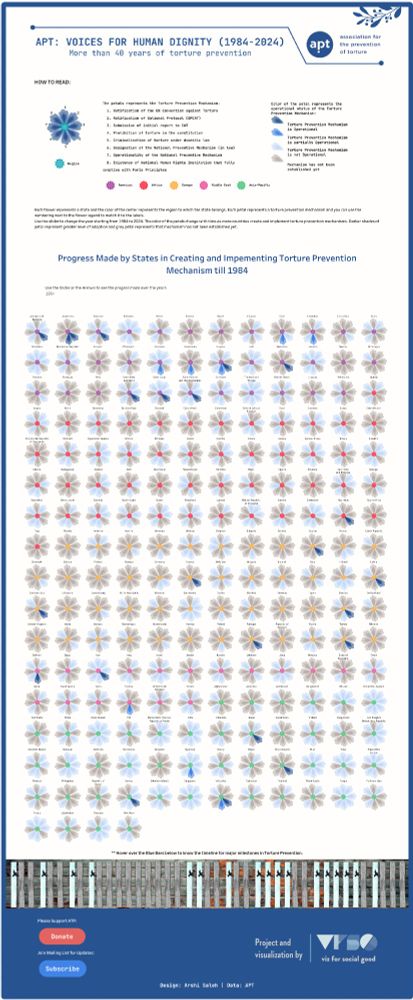
Hello #datafam and #dataviz community,
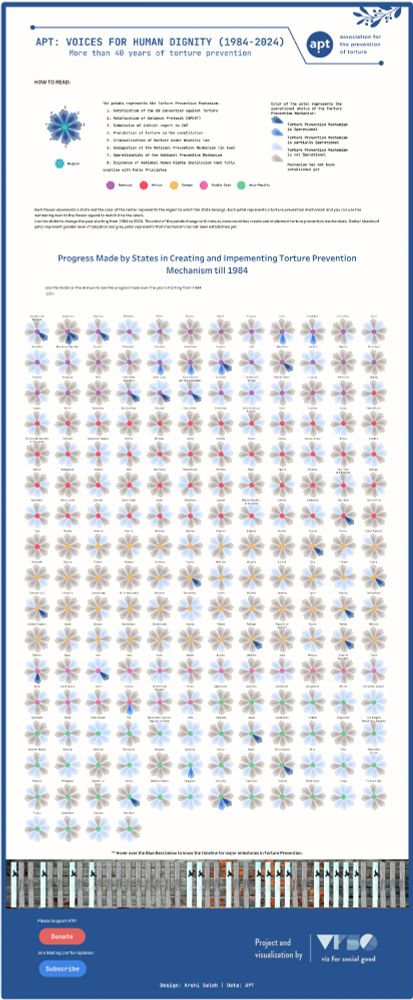
Sharing my latest project for #VFSG and APT which showcases the work done in implementing torture prevention mechanism.
Tableau Link: public.tableau.com/views/APTVoi...
#tableau #tortureprevention #datavisualization #storytelling #data #informationdesign
Sharing my latest project for #VFSG and APT which showcases the work done in implementing torture prevention mechanism.
Tableau Link: public.tableau.com/views/APTVoi...
#tableau #tortureprevention #datavisualization #storytelling #data #informationdesign
November 25, 2024 at 1:37 PM
Hello #datafam and #dataviz community,
Sharing my latest project for #VFSG and APT which showcases the work done in implementing torture prevention mechanism.
Tableau Link: public.tableau.com/views/APTVoi...
#tableau #tortureprevention #datavisualization #storytelling #data #informationdesign
Sharing my latest project for #VFSG and APT which showcases the work done in implementing torture prevention mechanism.
Tableau Link: public.tableau.com/views/APTVoi...
#tableau #tortureprevention #datavisualization #storytelling #data #informationdesign
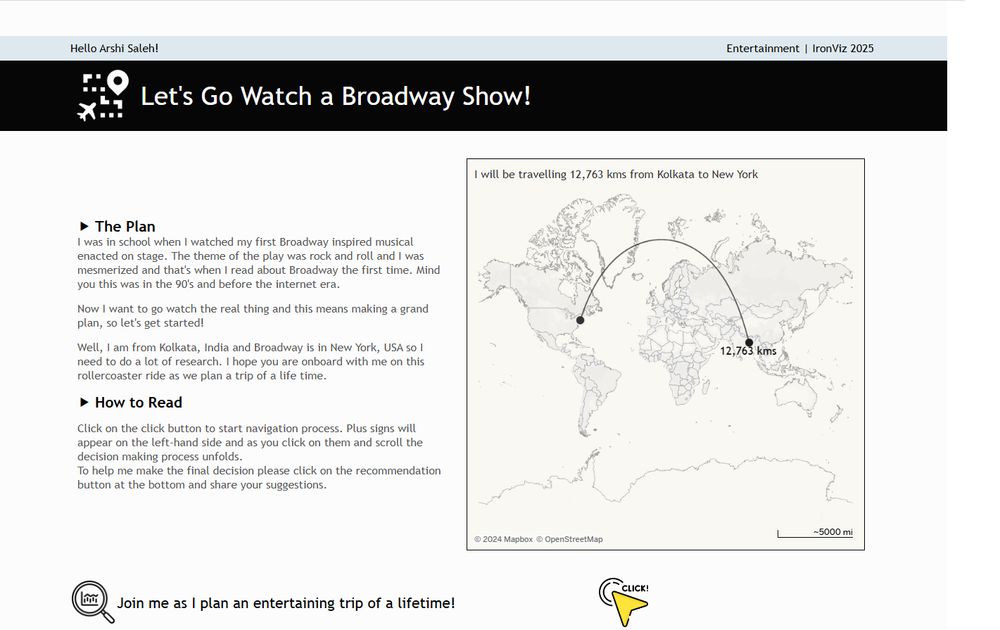
Hello #DataFam,
I am really excited to share my first #IronViz submission. It's been a roller coaster ride and I am glad to have made it before the deadline. Hope you enjoy it!
📊 Tableau Link: public.tableau.com/views/LetsGo...
I am really excited to share my first #IronViz submission. It's been a roller coaster ride and I am glad to have made it before the deadline. Hope you enjoy it!
📊 Tableau Link: public.tableau.com/views/LetsGo...
October 31, 2024 at 8:30 PM
Hello #DataFam,
I am really excited to share my first #IronViz submission. It's been a roller coaster ride and I am glad to have made it before the deadline. Hope you enjoy it!
📊 Tableau Link: public.tableau.com/views/LetsGo...
I am really excited to share my first #IronViz submission. It's been a roller coaster ride and I am glad to have made it before the deadline. Hope you enjoy it!
📊 Tableau Link: public.tableau.com/views/LetsGo...
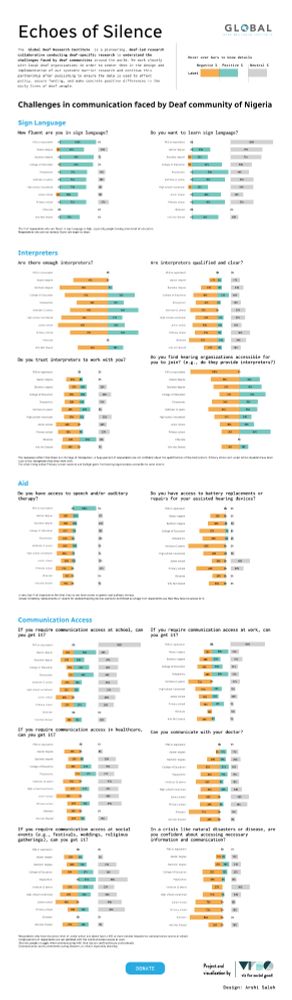
Hello #datafam,
Sharing my submission for #VizforSocialGood where I have explored the challenges in communication faced by the #Deaf community in #Nigeria.
Tableau Link: public.tableau.com/views/Echoes...
#VFSG #DataVisualization #DataForGood #DataForAll
#GDRI #Data #tableau #VFSG
Sharing my submission for #VizforSocialGood where I have explored the challenges in communication faced by the #Deaf community in #Nigeria.
Tableau Link: public.tableau.com/views/Echoes...
#VFSG #DataVisualization #DataForGood #DataForAll
#GDRI #Data #tableau #VFSG
May 31, 2024 at 7:38 AM
Hello #datafam,
Sharing my submission for #VizforSocialGood where I have explored the challenges in communication faced by the #Deaf community in #Nigeria.
Tableau Link: public.tableau.com/views/Echoes...
#VFSG #DataVisualization #DataForGood #DataForAll
#GDRI #Data #tableau #VFSG
Sharing my submission for #VizforSocialGood where I have explored the challenges in communication faced by the #Deaf community in #Nigeria.
Tableau Link: public.tableau.com/views/Echoes...
#VFSG #DataVisualization #DataForGood #DataForAll
#GDRI #Data #tableau #VFSG
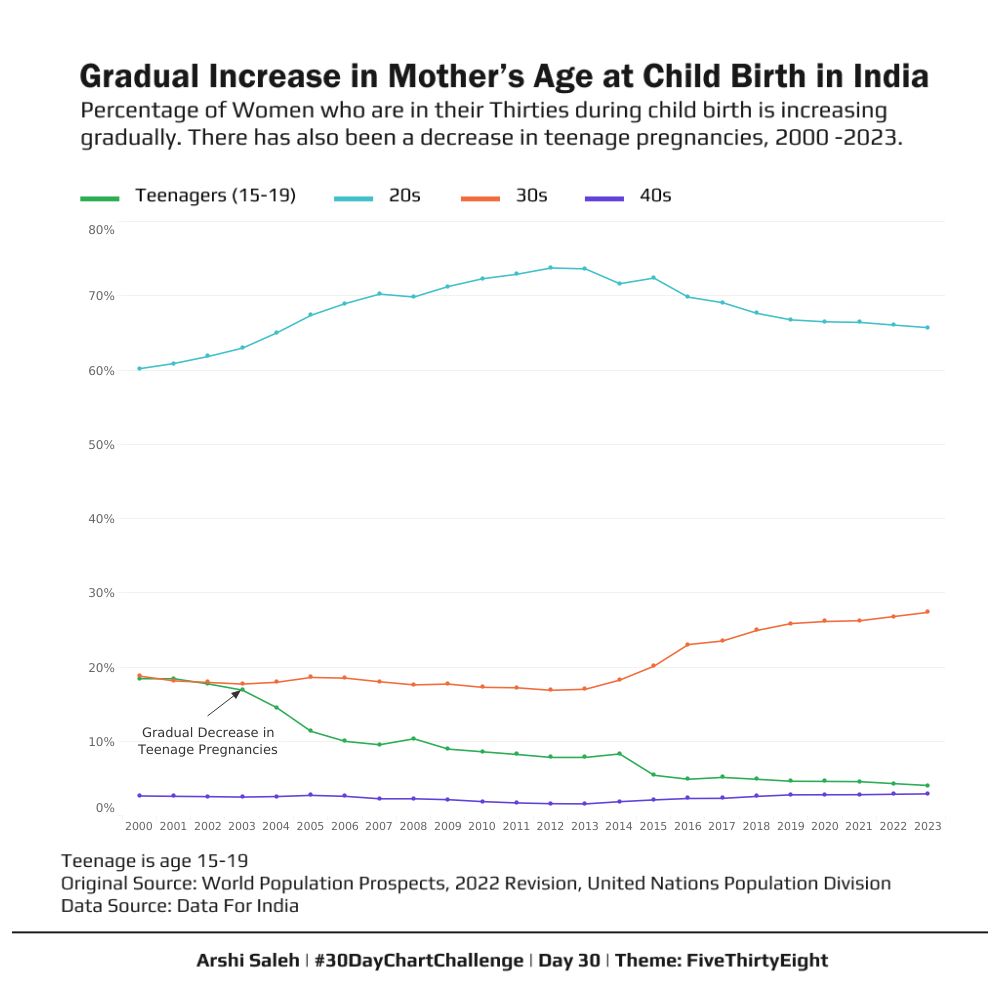
*** #NewDataViz ***
Hello #DataFam,
For #Day30 of #30DayChartChallenge the prompt was #theme: #fivethirtyeight and I have chosen to explore the Age of Women at Child Birth, in India. The data has been sourced from DataforIndia.
Tableau Link: public.tableau.com/views/30DayC...
Hello #DataFam,
For #Day30 of #30DayChartChallenge the prompt was #theme: #fivethirtyeight and I have chosen to explore the Age of Women at Child Birth, in India. The data has been sourced from DataforIndia.
Tableau Link: public.tableau.com/views/30DayC...
April 30, 2024 at 1:55 PM
*** #NewDataViz ***
Hello #DataFam,
For #Day30 of #30DayChartChallenge the prompt was #theme: #fivethirtyeight and I have chosen to explore the Age of Women at Child Birth, in India. The data has been sourced from DataforIndia.
Tableau Link: public.tableau.com/views/30DayC...
Hello #DataFam,
For #Day30 of #30DayChartChallenge the prompt was #theme: #fivethirtyeight and I have chosen to explore the Age of Women at Child Birth, in India. The data has been sourced from DataforIndia.
Tableau Link: public.tableau.com/views/30DayC...
Hello #DataFam,
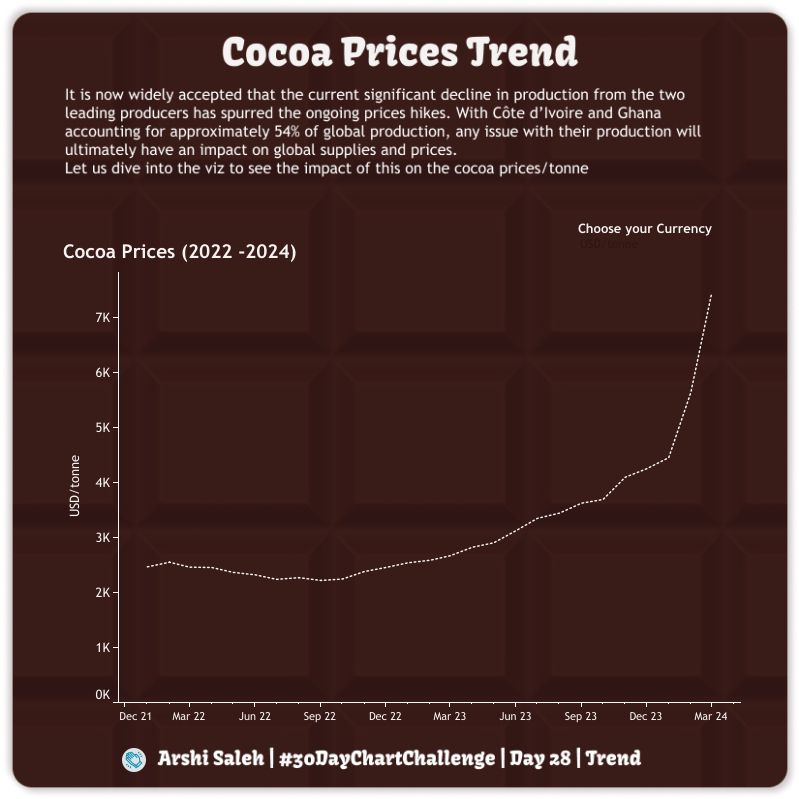
For #Day28 of the #30DayChartChallenge the prompt was #trends and I have explored the cocoa price trend.
If you are a #chocolate lover, then this is the #chart for you.
📊 Tableau Link: public.tableau.com/shared/7C4YS...
#tableau #tableaupublic #datavisualization #cocoa
For #Day28 of the #30DayChartChallenge the prompt was #trends and I have explored the cocoa price trend.
If you are a #chocolate lover, then this is the #chart for you.
📊 Tableau Link: public.tableau.com/shared/7C4YS...
#tableau #tableaupublic #datavisualization #cocoa
April 29, 2024 at 6:04 PM
Hello #DataFam,
For #Day28 of the #30DayChartChallenge the prompt was #trends and I have explored the cocoa price trend.
If you are a #chocolate lover, then this is the #chart for you.
📊 Tableau Link: public.tableau.com/shared/7C4YS...
#tableau #tableaupublic #datavisualization #cocoa
For #Day28 of the #30DayChartChallenge the prompt was #trends and I have explored the cocoa price trend.
If you are a #chocolate lover, then this is the #chart for you.
📊 Tableau Link: public.tableau.com/shared/7C4YS...
#tableau #tableaupublic #datavisualization #cocoa
Hello #DataFam,
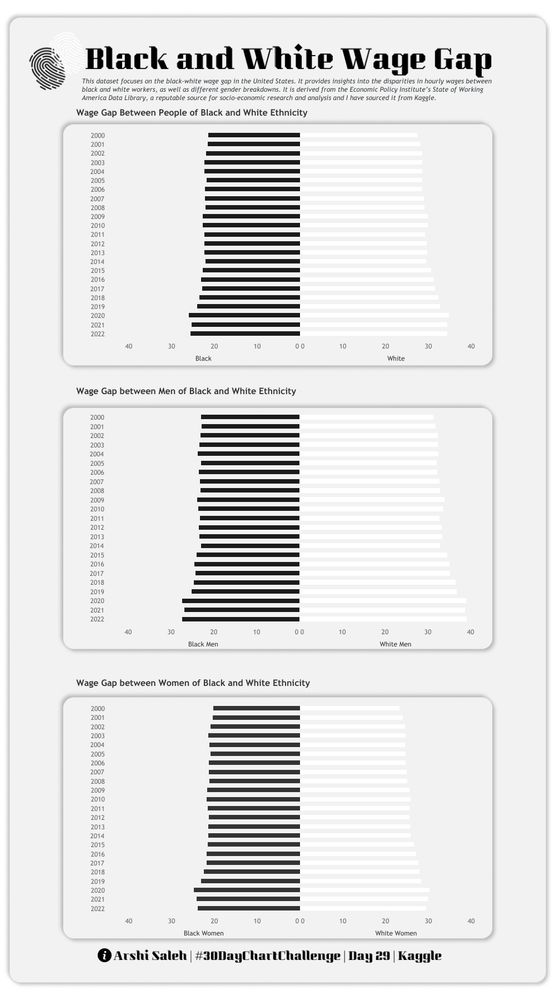
For #Day29 of the #30DayChartChallenge the prompt was #black and #white and I have explored the Wage Gap for people of Black and White Ethnicity.
📊 Tableau Link: public.tableau.com/views/30DayC...
#tableau #tableaupublic #diversity #paygap #datavisualization #dataviz
For #Day29 of the #30DayChartChallenge the prompt was #black and #white and I have explored the Wage Gap for people of Black and White Ethnicity.
📊 Tableau Link: public.tableau.com/views/30DayC...
#tableau #tableaupublic #diversity #paygap #datavisualization #dataviz
April 29, 2024 at 1:45 PM
Hello #DataFam,
For #Day29 of the #30DayChartChallenge the prompt was #black and #white and I have explored the Wage Gap for people of Black and White Ethnicity.
📊 Tableau Link: public.tableau.com/views/30DayC...
#tableau #tableaupublic #diversity #paygap #datavisualization #dataviz
For #Day29 of the #30DayChartChallenge the prompt was #black and #white and I have explored the Wage Gap for people of Black and White Ethnicity.
📊 Tableau Link: public.tableau.com/views/30DayC...
#tableau #tableaupublic #diversity #paygap #datavisualization #dataviz
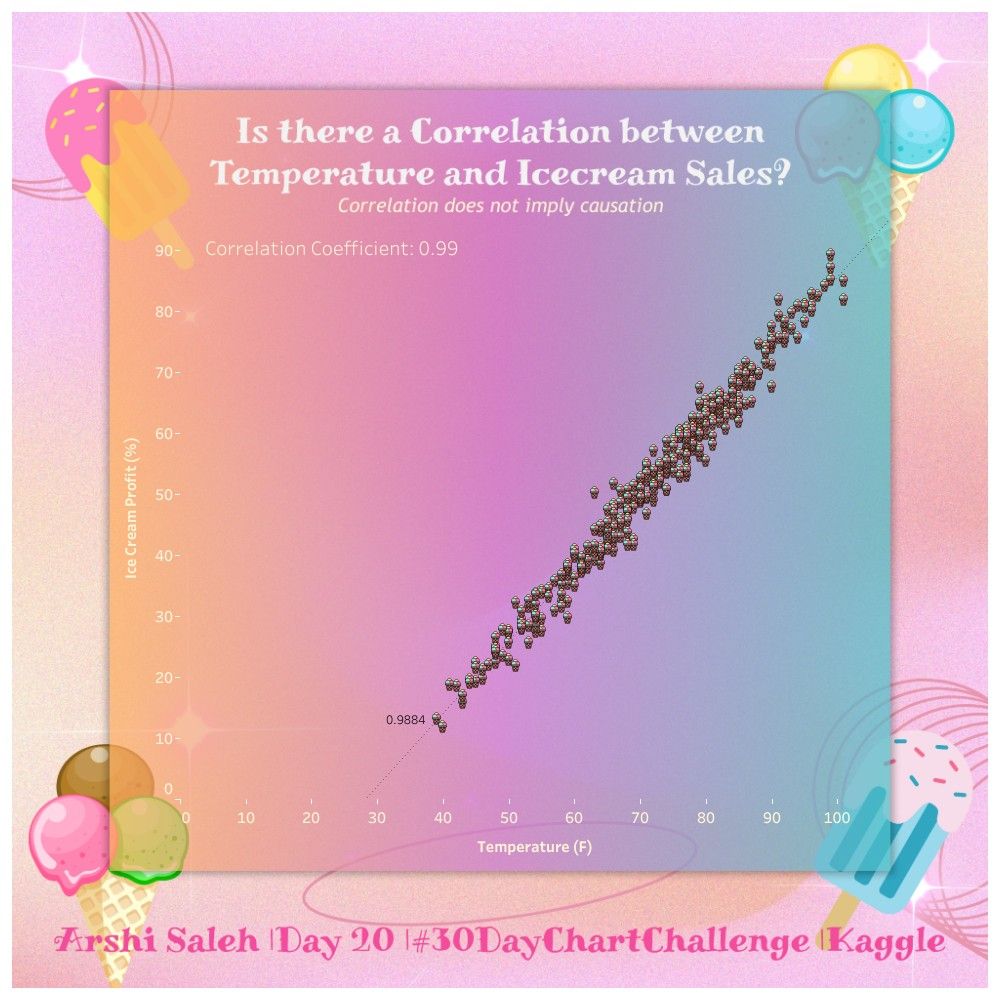
Hello #DataFam,
Sharing my viz for #Day20 of #30DayChartChallenge, prompt #correlation. Let's dive into this viz and find out if there is a correlation between Ice cream Profits and Temperature.
📊 Tableau Link: public.tableau.com/views/30DayC...
#tableau #datavisualization
Sharing my viz for #Day20 of #30DayChartChallenge, prompt #correlation. Let's dive into this viz and find out if there is a correlation between Ice cream Profits and Temperature.
📊 Tableau Link: public.tableau.com/views/30DayC...
#tableau #datavisualization
April 27, 2024 at 3:19 PM
Hello #DataFam,
Sharing my viz for #Day20 of #30DayChartChallenge, prompt #correlation. Let's dive into this viz and find out if there is a correlation between Ice cream Profits and Temperature.
📊 Tableau Link: public.tableau.com/views/30DayC...
#tableau #datavisualization
Sharing my viz for #Day20 of #30DayChartChallenge, prompt #correlation. Let's dive into this viz and find out if there is a correlation between Ice cream Profits and Temperature.
📊 Tableau Link: public.tableau.com/views/30DayC...
#tableau #datavisualization
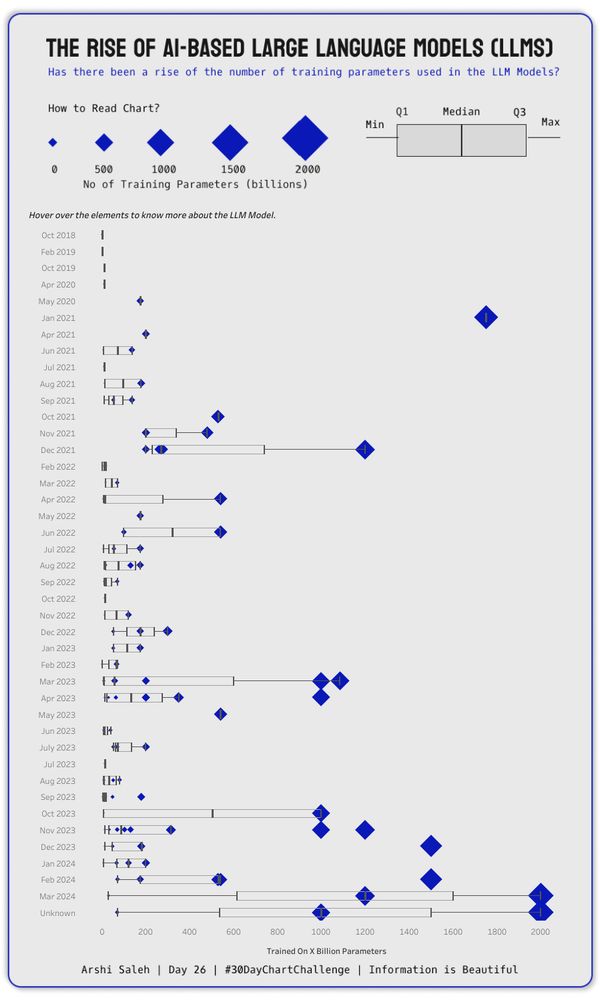
Hello #DataFam
For #Day26 of #30DayChartChallenge the Prompt was #AI and I have explored "The rise of AI-based LLMs.
Today is International #chartday and this is my contribution to celebrate the day.
Sharing the #Tableau Link: public.tableau.com/views/30DayC...
@datavizsociety.bsky.social
For #Day26 of #30DayChartChallenge the Prompt was #AI and I have explored "The rise of AI-based LLMs.
Today is International #chartday and this is my contribution to celebrate the day.
Sharing the #Tableau Link: public.tableau.com/views/30DayC...
@datavizsociety.bsky.social
April 26, 2024 at 6:15 PM
Hello #DataFam
For #Day26 of #30DayChartChallenge the Prompt was #AI and I have explored "The rise of AI-based LLMs.
Today is International #chartday and this is my contribution to celebrate the day.
Sharing the #Tableau Link: public.tableau.com/views/30DayC...
@datavizsociety.bsky.social
For #Day26 of #30DayChartChallenge the Prompt was #AI and I have explored "The rise of AI-based LLMs.
Today is International #chartday and this is my contribution to celebrate the day.
Sharing the #Tableau Link: public.tableau.com/views/30DayC...
@datavizsociety.bsky.social
Hello #DataFam,
For #Day25 of #30DayChartChallenge, the prompt was #globalchange and I am exploring the #top25 countries responsible for #coalemissions.
📊 Tableau Link: public.tableau.com/views/30DayC...
#tableau #tableaupublic #carbonemission #environment #dataviz #datavisualization
For #Day25 of #30DayChartChallenge, the prompt was #globalchange and I am exploring the #top25 countries responsible for #coalemissions.
📊 Tableau Link: public.tableau.com/views/30DayC...
#tableau #tableaupublic #carbonemission #environment #dataviz #datavisualization

April 25, 2024 at 7:05 PM
Hello #DataFam,
For #Day25 of #30DayChartChallenge, the prompt was #globalchange and I am exploring the #top25 countries responsible for #coalemissions.
📊 Tableau Link: public.tableau.com/views/30DayC...
#tableau #tableaupublic #carbonemission #environment #dataviz #datavisualization
For #Day25 of #30DayChartChallenge, the prompt was #globalchange and I am exploring the #top25 countries responsible for #coalemissions.
📊 Tableau Link: public.tableau.com/views/30DayC...
#tableau #tableaupublic #carbonemission #environment #dataviz #datavisualization
Hello #datafam,
For #Day24 of #30DayChartChallenge the prompt was #ILORegionForAfrica.
This is also my #50thviz and I am excited about it. 😁
For my submission, I have chosen to explore the "Informal Employment Rate by Sex (%)".
📊 Tableau Link: public.tableau.com/views/30DayC...
#dataviz
For #Day24 of #30DayChartChallenge the prompt was #ILORegionForAfrica.
This is also my #50thviz and I am excited about it. 😁
For my submission, I have chosen to explore the "Informal Employment Rate by Sex (%)".
📊 Tableau Link: public.tableau.com/views/30DayC...
#dataviz

April 24, 2024 at 6:29 PM
Hello #datafam,
For #Day24 of #30DayChartChallenge the prompt was #ILORegionForAfrica.
This is also my #50thviz and I am excited about it. 😁
For my submission, I have chosen to explore the "Informal Employment Rate by Sex (%)".
📊 Tableau Link: public.tableau.com/views/30DayC...
#dataviz
For #Day24 of #30DayChartChallenge the prompt was #ILORegionForAfrica.
This is also my #50thviz and I am excited about it. 😁
For my submission, I have chosen to explore the "Informal Employment Rate by Sex (%)".
📊 Tableau Link: public.tableau.com/views/30DayC...
#dataviz
Hello #DataFam,
For #Day23 of #30DayChartChallenge the prompt is #tiles.
Today's submission explores the "Consumer Spending by Generation" and the dataset was sourced from #makeovermonday #2019W13.
📊 Tableau link: public.tableau.com/views/30DayC...
#tableau #dataviz #datavisualization
For #Day23 of #30DayChartChallenge the prompt is #tiles.
Today's submission explores the "Consumer Spending by Generation" and the dataset was sourced from #makeovermonday #2019W13.
📊 Tableau link: public.tableau.com/views/30DayC...
#tableau #dataviz #datavisualization

April 23, 2024 at 2:42 PM
Hello #DataFam,
For #Day23 of #30DayChartChallenge the prompt is #tiles.
Today's submission explores the "Consumer Spending by Generation" and the dataset was sourced from #makeovermonday #2019W13.
📊 Tableau link: public.tableau.com/views/30DayC...
#tableau #dataviz #datavisualization
For #Day23 of #30DayChartChallenge the prompt is #tiles.
Today's submission explores the "Consumer Spending by Generation" and the dataset was sourced from #makeovermonday #2019W13.
📊 Tableau link: public.tableau.com/views/30DayC...
#tableau #dataviz #datavisualization
Hello #DataFam,
Happy #EarthDay2024!
For #Day22 of #30DayChartChallenge, the prompt was #mobility.
Dive into this #viz to know CO2 emissions/km for different forms of transport and choose your transport wisely.
📊 Tableau Link: public.tableau.com/views/30DayC...
Happy #EarthDay2024!
For #Day22 of #30DayChartChallenge, the prompt was #mobility.
Dive into this #viz to know CO2 emissions/km for different forms of transport and choose your transport wisely.
📊 Tableau Link: public.tableau.com/views/30DayC...

April 22, 2024 at 12:17 PM
Hello #DataFam,
Happy #EarthDay2024!
For #Day22 of #30DayChartChallenge, the prompt was #mobility.
Dive into this #viz to know CO2 emissions/km for different forms of transport and choose your transport wisely.
📊 Tableau Link: public.tableau.com/views/30DayC...
Happy #EarthDay2024!
For #Day22 of #30DayChartChallenge, the prompt was #mobility.
Dive into this #viz to know CO2 emissions/km for different forms of transport and choose your transport wisely.
📊 Tableau Link: public.tableau.com/views/30DayC...
Hello #DataFam,
I am sharing my submission for #Day21 of #30DayChartChallenge
Prompt: #GreenEnergy.
How are the Top 50 most Populated Countries doing with adopting renewable energy to generate electricity?
📊 Tableau Link: public.tableau.com/views/30DayC...
I am sharing my submission for #Day21 of #30DayChartChallenge
Prompt: #GreenEnergy.
How are the Top 50 most Populated Countries doing with adopting renewable energy to generate electricity?
📊 Tableau Link: public.tableau.com/views/30DayC...

April 21, 2024 at 2:12 PM
Hello #DataFam,
I am sharing my submission for #Day21 of #30DayChartChallenge
Prompt: #GreenEnergy.
How are the Top 50 most Populated Countries doing with adopting renewable energy to generate electricity?
📊 Tableau Link: public.tableau.com/views/30DayC...
I am sharing my submission for #Day21 of #30DayChartChallenge
Prompt: #GreenEnergy.
How are the Top 50 most Populated Countries doing with adopting renewable energy to generate electricity?
📊 Tableau Link: public.tableau.com/views/30DayC...
Hey #DataFam
Sharing my #viz for #Day19 of #30DayChartChallenge, prompt #dinosaur.
If you are interested in all things dinosaurs then this is the viz for you.
Tableau Link: public.tableau.com/views/30DayC...
#tableau
Sharing my #viz for #Day19 of #30DayChartChallenge, prompt #dinosaur.
If you are interested in all things dinosaurs then this is the viz for you.
Tableau Link: public.tableau.com/views/30DayC...
#tableau

April 19, 2024 at 7:52 PM
Hey #DataFam
Sharing my #viz for #Day19 of #30DayChartChallenge, prompt #dinosaur.
If you are interested in all things dinosaurs then this is the viz for you.
Tableau Link: public.tableau.com/views/30DayC...
#tableau
Sharing my #viz for #Day19 of #30DayChartChallenge, prompt #dinosaur.
If you are interested in all things dinosaurs then this is the viz for you.
Tableau Link: public.tableau.com/views/30DayC...
#tableau
Hey #datafam,
#Day18 of #30DayChartChallenge
Prompt: #AsianDevelopmentBank
I have analyzed the Climate Change Finance provided by the Asian Development Bank.
You can view the dashboard here: public.tableau.com/shared/D8PY5...
#Day18 of #30DayChartChallenge
Prompt: #AsianDevelopmentBank
I have analyzed the Climate Change Finance provided by the Asian Development Bank.
You can view the dashboard here: public.tableau.com/shared/D8PY5...

April 19, 2024 at 11:58 AM
Hey #datafam,
#Day18 of #30DayChartChallenge
Prompt: #AsianDevelopmentBank
I have analyzed the Climate Change Finance provided by the Asian Development Bank.
You can view the dashboard here: public.tableau.com/shared/D8PY5...
#Day18 of #30DayChartChallenge
Prompt: #AsianDevelopmentBank
I have analyzed the Climate Change Finance provided by the Asian Development Bank.
You can view the dashboard here: public.tableau.com/shared/D8PY5...
Hello #datafam
#day17 of #30DayChartChallenge, the prompt was #network and thanks to @ladataviz, I created my first network chart showing the network of films in the Marvel Series and its worldwide gross($) for the Series.
📊 Tableau Link: public.tableau.com/views/30DayC...
#tableau #figma
#day17 of #30DayChartChallenge, the prompt was #network and thanks to @ladataviz, I created my first network chart showing the network of films in the Marvel Series and its worldwide gross($) for the Series.
📊 Tableau Link: public.tableau.com/views/30DayC...
#tableau #figma

April 17, 2024 at 6:58 PM
Hello #datafam
#day17 of #30DayChartChallenge, the prompt was #network and thanks to @ladataviz, I created my first network chart showing the network of films in the Marvel Series and its worldwide gross($) for the Series.
📊 Tableau Link: public.tableau.com/views/30DayC...
#tableau #figma
#day17 of #30DayChartChallenge, the prompt was #network and thanks to @ladataviz, I created my first network chart showing the network of films in the Marvel Series and its worldwide gross($) for the Series.
📊 Tableau Link: public.tableau.com/views/30DayC...
#tableau #figma
*** NewDataViz ***
For #Day16 of #30DayChartChallenge, prompt #weather I have explored the daily average temperature of my city Kolkata from 2017-2022.
📊 Tableau Link: public.tableau.com/views/30DayC...
Thank you, Cédric Scherer and team for this wonderful challenge.
#tableau #dataviz #datafam
For #Day16 of #30DayChartChallenge, prompt #weather I have explored the daily average temperature of my city Kolkata from 2017-2022.
📊 Tableau Link: public.tableau.com/views/30DayC...
Thank you, Cédric Scherer and team for this wonderful challenge.
#tableau #dataviz #datafam

April 16, 2024 at 5:42 PM
*** NewDataViz ***
For #Day16 of #30DayChartChallenge, prompt #weather I have explored the daily average temperature of my city Kolkata from 2017-2022.
📊 Tableau Link: public.tableau.com/views/30DayC...
Thank you, Cédric Scherer and team for this wonderful challenge.
#tableau #dataviz #datafam
For #Day16 of #30DayChartChallenge, prompt #weather I have explored the daily average temperature of my city Kolkata from 2017-2022.
📊 Tableau Link: public.tableau.com/views/30DayC...
Thank you, Cédric Scherer and team for this wonderful challenge.
#tableau #dataviz #datafam