


Aman Bhargava
@aman.bh
data/dev/design/map enthusiast
Data viz and development @revisual.co, interned @graphics.reuters.com
Bangalore, India
#dataviz #rstats #svelte #maps
🔗 https://aman.bh
Data viz and development @revisual.co, interned @graphics.reuters.com
Bangalore, India
#dataviz #rstats #svelte #maps
🔗 https://aman.bh
Sidenote: I love seeing another NYT game tracker on a personal site! How did you implement that for yourself? I have a custom form where we make entries daily manually, have you automated this data collection? Here's my games tracker :)

November 6, 2025 at 2:18 PM
Sidenote: I love seeing another NYT game tracker on a personal site! How did you implement that for yourself? I have a custom form where we make entries daily manually, have you automated this data collection? Here's my games tracker :)
Overall, public transport is higher throughout in the areas not on the NYT map. I'm just curious why it was done that way.
a816-dohbesp.nyc.gov/IndicatorPub...
a816-dohbesp.nyc.gov/IndicatorPub...


November 5, 2025 at 11:26 AM
Overall, public transport is higher throughout in the areas not on the NYT map. I'm just curious why it was done that way.
a816-dohbesp.nyc.gov/IndicatorPub...
a816-dohbesp.nyc.gov/IndicatorPub...
Could someone help me understand why most of Manhattan has no color in this map by @nytimes.com, showing Mamdani and Cuomo voters by 'commute type'? Is it not either public transit or cars, why is most blank? Can I find this broken down by type of transit (subway, buses) for these areas? #dataviz

November 5, 2025 at 11:02 AM
Could someone help me understand why most of Manhattan has no color in this map by @nytimes.com, showing Mamdani and Cuomo voters by 'commute type'? Is it not either public transit or cars, why is most blank? Can I find this broken down by type of transit (subway, buses) for these areas? #dataviz
Very nicely done. This is a niche compliment, but great job nailing the chart exports! Many standard implementations export as-is visible in the DOM, but it's nice to see it be viewport-sizing independent and beautifully formatted.

October 31, 2025 at 3:46 PM
Very nicely done. This is a niche compliment, but great job nailing the chart exports! Many standard implementations export as-is visible in the DOM, but it's nice to see it be viewport-sizing independent and beautifully formatted.

Our analysis notebook lives in the same repo, where we can take in the CSV, do whatever we want with it (eg: prototype charts in ggplot), and output the condensed summary as a JSON. Interactive charts can read that data, and this can be kept up to date/changed without worry.

October 3, 2025 at 4:17 PM
Our analysis notebook lives in the same repo, where we can take in the CSV, do whatever we want with it (eg: prototype charts in ggplot), and output the condensed summary as a JSON. Interactive charts can read that data, and this can be kept up to date/changed without worry.
More skeuomorphic signs! HTML/CSS ftw, replicating their real-life counterparts.
October 3, 2025 at 4:17 PM
More skeuomorphic signs! HTML/CSS ftw, replicating their real-life counterparts.
This is probably the first time I've managed a network graph in a way I liked. I used workers to shift the simulation off the main thread so that the page doesn't lag while it sets up. More connections were on the same line, so we take a minimum number from both types of travel.
October 3, 2025 at 4:17 PM
This is probably the first time I've managed a network graph in a way I liked. I used workers to shift the simulation off the main thread so that the page doesn't lag while it sets up. More connections were on the same line, so we take a minimum number from both types of travel.
Same as above, I might know what the general map looks like but not specific "routes", so this was a custom routing system for handling interchanges, inter-line commutes. A virtualized list to show all 6k possible commutes so you can click at random ones quickly.
October 3, 2025 at 4:17 PM
Same as above, I might know what the general map looks like but not specific "routes", so this was a custom routing system for handling interchanges, inter-line commutes. A virtualized list to show all 6k possible commutes so you can click at random ones quickly.
Not everyone's from Bangalore or might know where a specific station is (ik I don't), so instead of just name-dropping places, I reused our metro map component in a tooltip which shows the location of that station in a popover.
October 3, 2025 at 4:17 PM
Not everyone's from Bangalore or might know where a specific station is (ik I don't), so instead of just name-dropping places, I reused our metro map component in a tooltip which shows the location of that station in a popover.
A thread of some design/code highlights for me from our 'How Bangalore Uses the Metro' 📊 project.
1. The header sign is fully HTML/CSS. 'Go Down Take Up For Toilet' is real signage at one of our biggest stations (pic below) :P
1. The header sign is fully HTML/CSS. 'Go Down Take Up For Toilet' is real signage at one of our biggest stations (pic below) :P
October 3, 2025 at 4:17 PM
A thread of some design/code highlights for me from our 'How Bangalore Uses the Metro' 📊 project.
1. The header sign is fully HTML/CSS. 'Go Down Take Up For Toilet' is real signage at one of our biggest stations (pic below) :P
1. The header sign is fully HTML/CSS. 'Go Down Take Up For Toilet' is real signage at one of our biggest stations (pic below) :P
My favorite part is this routing system I built for visualizing pairs of commute trips. All this and more in the story!
October 1, 2025 at 5:31 PM
My favorite part is this routing system I built for visualizing pairs of commute trips. All this and more in the story!
Filed a Right to Information request with Bangalore's metro authority asking how many people traveled on the metro and got a file with 1.2M rows of data! We break our findings down in this story on how Bangalore uses the metro. w/
@vonter.bsky.social #dataviz
diagramchasing.fun/2025/how-ban...
@vonter.bsky.social #dataviz
diagramchasing.fun/2025/how-ban...


October 1, 2025 at 5:29 PM
Filed a Right to Information request with Bangalore's metro authority asking how many people traveled on the metro and got a file with 1.2M rows of data! We break our findings down in this story on how Bangalore uses the metro. w/
@vonter.bsky.social #dataviz
diagramchasing.fun/2025/how-ban...
@vonter.bsky.social #dataviz
diagramchasing.fun/2025/how-ban...
Experiments in visualizing crowds in Bangalore's metro station. The floor plans come in SVG formats, so I solved this by managing to constrain rendering clusters within a polygon with a certain color code (platform color is always consistent) :P
September 25, 2025 at 2:15 PM
Experiments in visualizing crowds in Bangalore's metro station. The floor plans come in SVG formats, so I solved this by managing to constrain rendering clusters within a polygon with a certain color code (platform color is always consistent) :P
The search is also super powerful! These records were previously incredibly messy and unsearchable. We joined three different datasets and parsed, cleaned, and classified these records to make them searchable in ways that have never been possible with this data before in India.

September 14, 2025 at 6:33 PM
The search is also super powerful! These records were previously incredibly messy and unsearchable. We joined three different datasets and parsed, cleaned, and classified these records to make them searchable in ways that have never been possible with this data before in India.
One detail I'm pretty proud of is the info boxes that accompany each chart on a film's page. Some people may not know how to interpret a histogram, and that's okay! This popup walks you through the _same_ chart you're looking at with a series of steppers, no placeholder explanation. :)
September 14, 2025 at 6:33 PM
One detail I'm pretty proud of is the info boxes that accompany each chart on a film's page. Some people may not know how to interpret a histogram, and that's okay! This popup walks you through the _same_ chart you're looking at with a series of steppers, no placeholder explanation. :)
Today, @vonter.bsky.social and I launched cbfc.watch, an archive of over 100k censorship records for ~18k movies released in India since 2017. For the first time, you can search for any movie and see how they were modified before release.
The site is fun to explore, but here's some #dataviz in it!
The site is fun to explore, but here's some #dataviz in it!


September 14, 2025 at 6:33 PM
Today, @vonter.bsky.social and I launched cbfc.watch, an archive of over 100k censorship records for ~18k movies released in India since 2017. For the first time, you can search for any movie and see how they were modified before release.
The site is fun to explore, but here's some #dataviz in it!
The site is fun to explore, but here's some #dataviz in it!
Big into doing long walks now. This is a 31 km walk I did from central Bangalore through the peripheries so I could get to the other end of a newly opened metro line and ride it back.

September 2, 2025 at 11:42 AM
Big into doing long walks now. This is a 31 km walk I did from central Bangalore through the peripheries so I could get to the other end of a newly opened metro line and ride it back.
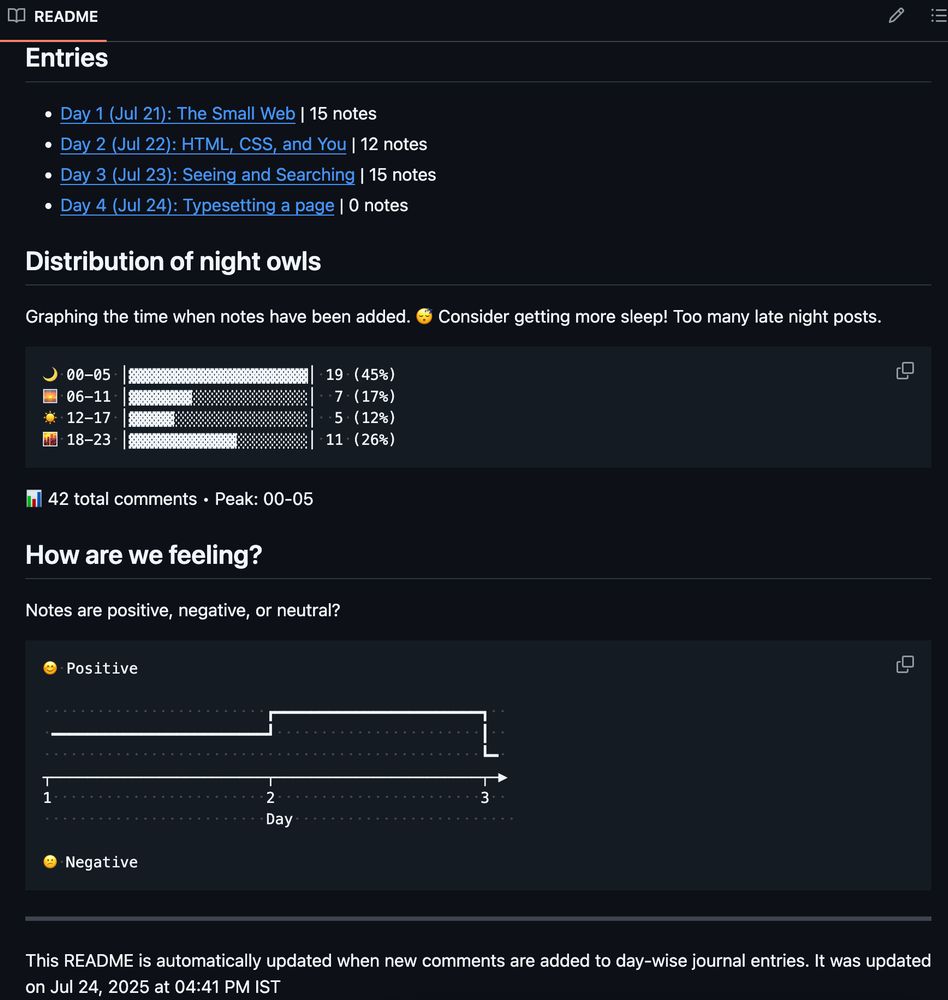
Can a README file become a "dashboard" with #dataviz? Maybe.
My web design module has students submitting daily journal entries as Github Issues, which means I can use the API and Github Actions to do all sorts of neat stuff. Simple processing and throw in some ASCII charts, you have a live dash.
My web design module has students submitting daily journal entries as Github Issues, which means I can use the API and Github Actions to do all sorts of neat stuff. Simple processing and throw in some ASCII charts, you have a live dash.
July 24, 2025 at 3:42 PM
Can a README file become a "dashboard" with #dataviz? Maybe.
My web design module has students submitting daily journal entries as Github Issues, which means I can use the API and Github Actions to do all sorts of neat stuff. Simple processing and throw in some ASCII charts, you have a live dash.
My web design module has students submitting daily journal entries as Github Issues, which means I can use the API and Github Actions to do all sorts of neat stuff. Simple processing and throw in some ASCII charts, you have a live dash.

July 2, 2025 at 6:54 PM
Psst: If you're interested, I have a Discord server where we work on our dataviz and web dev projects in public to share progress, get feedback also have other people share their work!
Process is much more interesting than the output, and this is my space to share more of that. Link below!
Process is much more interesting than the output, and this is my space to share more of that. Link below!

May 6, 2025 at 1:38 AM
Psst: If you're interested, I have a Discord server where we work on our dataviz and web dev projects in public to share progress, get feedback also have other people share their work!
Process is much more interesting than the output, and this is my space to share more of that. Link below!
Process is much more interesting than the output, and this is my space to share more of that. Link below!
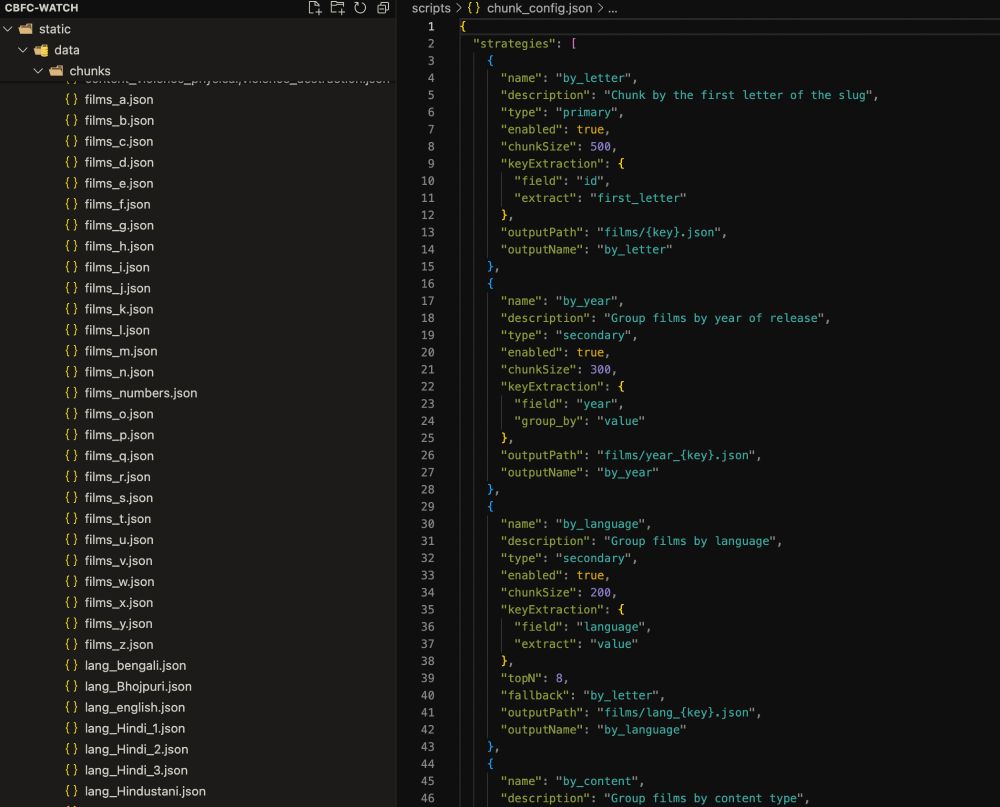
Our new project with 6k+ "pages" is fully-static. The source data is chunked and pre-processed, enabling fast lookup across different categories with fallbacks. We are able to do the same stuff we would need a database for by optimizing everything at build time. No devops headache needed later.
May 5, 2025 at 1:31 PM
Our new project with 6k+ "pages" is fully-static. The source data is chunked and pre-processed, enabling fast lookup across different categories with fallbacks. We are able to do the same stuff we would need a database for by optimizing everything at build time. No devops headache needed later.
Found an old project from 4 years ago for which I mixed Harry Styles, Beatles songs and The Office quotes with Markov chains to send Rhea weekly newsletters of lyrical nonsense with matching GIFs. One of my first "big" Python projects 😛
Also, text from Markov chains is still funnier than GPT text.
Also, text from Markov chains is still funnier than GPT text.


May 1, 2025 at 12:43 PM
Found an old project from 4 years ago for which I mixed Harry Styles, Beatles songs and The Office quotes with Markov chains to send Rhea weekly newsletters of lyrical nonsense with matching GIFs. One of my first "big" Python projects 😛
Also, text from Markov chains is still funnier than GPT text.
Also, text from Markov chains is still funnier than GPT text.
Observable Framework puts static-site architecture first as well. It just works!
observablehq.com/framework/wh...
observablehq.com/framework/wh...

April 28, 2025 at 5:25 PM
Observable Framework puts static-site architecture first as well. It just works!
observablehq.com/framework/wh...
observablehq.com/framework/wh...
There's a lot you can do with some nifty aggregation and filtering functions, and finally export the data to take it anywhere else you'd like. All of this happens completely locally, this is a static site built with @svelte.dev and @duckdb.org WASM. Code is fully open-source and linked on the site!


April 20, 2025 at 1:13 PM
There's a lot you can do with some nifty aggregation and filtering functions, and finally export the data to take it anywhere else you'd like. All of this happens completely locally, this is a static site built with @svelte.dev and @duckdb.org WASM. Code is fully open-source and linked on the site!