


Aleksander Berg
@alekberg.bsky.social
Geography PhD Student University of Colorado Boulder
I am a geographer that uses big data at fine grained scales to answer questions about natural hazards, health, and population dynamics to better inform decision making in and for those communities.
I am a geographer that uses big data at fine grained scales to answer questions about natural hazards, health, and population dynamics to better inform decision making in and for those communities.
While Zillow has wrapped up their ZTRAX program we are grateful to have had access to their data.
Disclaimer: The results and opinions are those of the author(s) and do not reflect the position of Zillow Group. Support by Zillow Group Inc. is acknowledged.
8/8
Disclaimer: The results and opinions are those of the author(s) and do not reflect the position of Zillow Group. Support by Zillow Group Inc. is acknowledged.
8/8
April 30, 2024 at 4:29 PM
While Zillow has wrapped up their ZTRAX program we are grateful to have had access to their data.
Disclaimer: The results and opinions are those of the author(s) and do not reflect the position of Zillow Group. Support by Zillow Group Inc. is acknowledged.
8/8
Disclaimer: The results and opinions are those of the author(s) and do not reflect the position of Zillow Group. Support by Zillow Group Inc. is acknowledged.
8/8
Explore the maps and data yourself at felt.com/map/Californ...
I appreciate the support of everyone @ASU, @ASU_SGSUP, and @cugeography who helped to make this paper possible.
7/8
I appreciate the support of everyone @ASU, @ASU_SGSUP, and @cugeography who helped to make this paper possible.
7/8
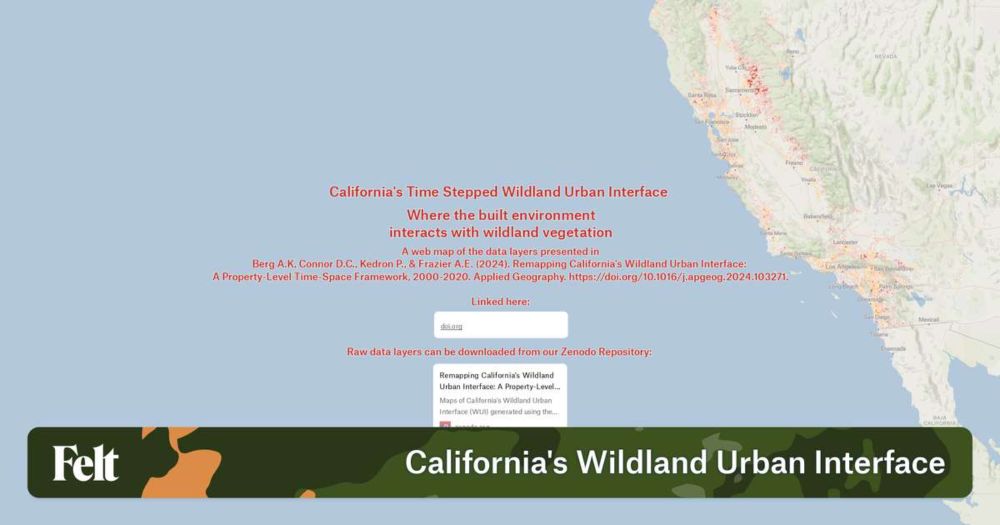
California's Wildland Urban Interface – Felt
The best way to make maps on the internet.
https://felt.com/map/Californias-Wildland-Urban-Interface-zUTEwQ5mSl9BzZLDzu3sGUB?loc=34.29,-129.122,6.73z&share=1…
April 30, 2024 at 4:29 PM
Explore the maps and data yourself at felt.com/map/Californ...
I appreciate the support of everyone @ASU, @ASU_SGSUP, and @cugeography who helped to make this paper possible.
7/8
I appreciate the support of everyone @ASU, @ASU_SGSUP, and @cugeography who helped to make this paper possible.
7/8
Now, with a rapidly changing environment, one that is more fire prone, we hope that the TSMW framework can provide a methodology for leveraging #BigData (e.g. property records) to provide a more nuanced understanding of how people become exposed to wildfire.
6/8
6/8
April 30, 2024 at 4:28 PM
Now, with a rapidly changing environment, one that is more fire prone, we hope that the TSMW framework can provide a methodology for leveraging #BigData (e.g. property records) to provide a more nuanced understanding of how people become exposed to wildfire.
6/8
6/8
In addition to utilizing rich property level data, our results show that our WUI maps better represent the WUI through time. For example, the TSMW maps capture 94.6% of burn exposed structures from 2010 to 2020 compared to 87.2% when using a census block based WUI map.
5/8
5/8
April 30, 2024 at 4:28 PM
In addition to utilizing rich property level data, our results show that our WUI maps better represent the WUI through time. For example, the TSMW maps capture 94.6% of burn exposed structures from 2010 to 2020 compared to 87.2% when using a census block based WUI map.
5/8
5/8
While growth has slowed, California's 4 million WUI properties make up 1.34 trillion or 40% of the state's improved residential property value. These homes tend to be newer, more expensive, and single family - over 9,000 of which are worth over $5 million.
4/8
4/8
April 30, 2024 at 4:27 PM
While growth has slowed, California's 4 million WUI properties make up 1.34 trillion or 40% of the state's improved residential property value. These homes tend to be newer, more expensive, and single family - over 9,000 of which are worth over $5 million.
4/8
4/8
The time stepped maps give us a building level profile of how CA's WUI has changed through time. We, like others, find that CA's WUI grew from 2000-2010 (441,531 (12.6%) more structures). Notably, WUI growth slowed in the following decade (58,725 (1.5%) more structures)
3/8
3/8

April 30, 2024 at 4:27 PM
The time stepped maps give us a building level profile of how CA's WUI has changed through time. We, like others, find that CA's WUI grew from 2000-2010 (441,531 (12.6%) more structures). Notably, WUI growth slowed in the following decade (58,725 (1.5%) more structures)
3/8
3/8
We build upon moving window based WUI mapping methods using a new data integration scheme we term the Time Step Moving Window (TSMW) framework which leverages Zillow's Transaction and Assessment Data (ZTRAX) to enrich FEMA building footprints to map the WUI through time.
2/8
2/8
April 30, 2024 at 4:26 PM
We build upon moving window based WUI mapping methods using a new data integration scheme we term the Time Step Moving Window (TSMW) framework which leverages Zillow's Transaction and Assessment Data (ZTRAX) to enrich FEMA building footprints to map the WUI through time.
2/8
2/8