


Alex Thompson, PhD
@ajtclimate.bsky.social
Research Scientist studying extreme precipitation | CIRES - CU Boulder | NOAA Affiliate - Physical Sciences Laboratory | PhD 2021 - University of Michigan
This new approach also included enough historical and modern/future data to estimate that the rainfall amount from this extreme event is about 2-4 times more likely to occur now and in the future compared to the preceding ~1,000 years. (5/6)

February 10, 2025 at 5:04 PM
This new approach also included enough historical and modern/future data to estimate that the rainfall amount from this extreme event is about 2-4 times more likely to occur now and in the future compared to the preceding ~1,000 years. (5/6)
This new “blended dataset” allowed me to refine the estimate of the storm’s rainfall over St. Louis and Kentucky to a ~1-in-530-year and ~1-in-280-year event, respectively, and reduced the uncertainty bars in this calculation by ~24-94% (4/6)

February 10, 2025 at 5:04 PM
This new “blended dataset” allowed me to refine the estimate of the storm’s rainfall over St. Louis and Kentucky to a ~1-in-530-year and ~1-in-280-year event, respectively, and reduced the uncertainty bars in this calculation by ~24-94% (4/6)
I sought to improve the assessment of this storm by developing a new method that combined over a century of rainfall observations from dozens of rain gauges with 1,250 years of climate model simulations spanning 850 to 2100 CE, thus greatly lengthening the data record. (3/6)

February 10, 2025 at 5:04 PM
I sought to improve the assessment of this storm by developing a new method that combined over a century of rainfall observations from dozens of rain gauges with 1,250 years of climate model simulations spanning 850 to 2100 CE, thus greatly lengthening the data record. (3/6)
This event was declared a 1-in-1,000-year event and caused quite a stir in the media, but a deeper look into the historical rainfall data revealed HUGE uncertainty bars on making such a declaration - mainly because it was made using only a few decades of observations (2/6)

February 10, 2025 at 5:04 PM
This event was declared a 1-in-1,000-year event and caused quite a stir in the media, but a deeper look into the historical rainfall data revealed HUGE uncertainty bars on making such a declaration - mainly because it was made using only a few decades of observations (2/6)
Year-end report for 2024 daily high temperature from the station at Boulder's NOAA lab: days warmer than the historical mean (1893-2023) outnumbered colder days by ~2.3 to 1

January 16, 2025 at 11:54 PM
Year-end report for 2024 daily high temperature from the station at Boulder's NOAA lab: days warmer than the historical mean (1893-2023) outnumbered colder days by ~2.3 to 1
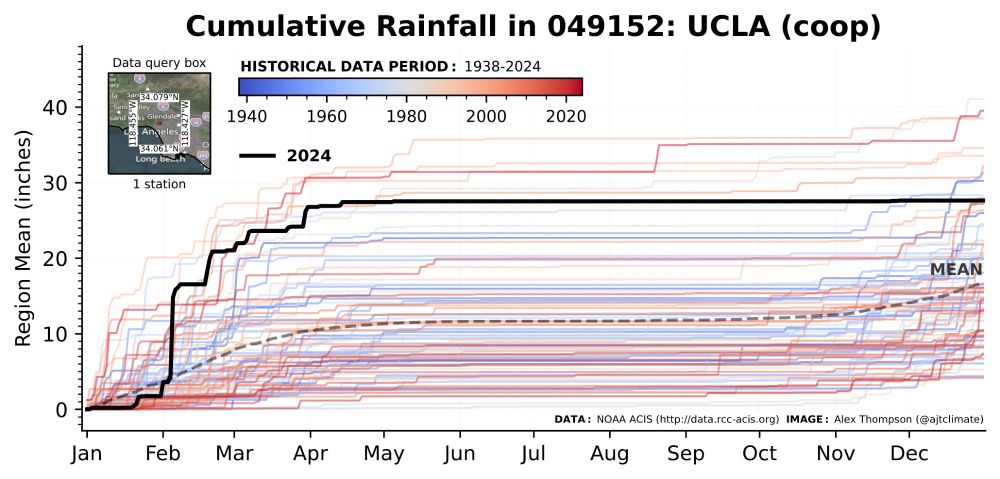
In the lead up to the #PalisadesFire and #EatonFire (using data from a nearby station at UCLA), Southern California experienced one of its wettest periods on record during Jan-Apr 2024 and has not had meaningful rainfall since 🤯 Mindblowingly favorable meteorological conditions for large wildfires
January 10, 2025 at 5:57 PM
In the lead up to the #PalisadesFire and #EatonFire (using data from a nearby station at UCLA), Southern California experienced one of its wettest periods on record during Jan-Apr 2024 and has not had meaningful rainfall since 🤯 Mindblowingly favorable meteorological conditions for large wildfires

The last ClimateDataVisualizer example for AGU is the August 20, 2023 rainfall event in Death Valley NP from remnants of Hurricane Hilary. This event was the single highest recorded day since 1912 and accounted for an entire year's worth of 🌧️ in a single day

December 15, 2023 at 3:52 PM
The last ClimateDataVisualizer example for AGU is the August 20, 2023 rainfall event in Death Valley NP from remnants of Hurricane Hilary. This event was the single highest recorded day since 1912 and accounted for an entire year's worth of 🌧️ in a single day
Today’s ClimateDataVisualizer example for AGU is annual rainfall for Western Maui in the years preceding 2023’s devastating wildfire. Some of the lowest annual rainfall totals since 1920 occurred in the last few years, drying out the region and priming it for a severe wildfire.

December 14, 2023 at 4:59 PM
Today’s ClimateDataVisualizer example for AGU is annual rainfall for Western Maui in the years preceding 2023’s devastating wildfire. Some of the lowest annual rainfall totals since 1920 occurred in the last few years, drying out the region and priming it for a severe wildfire.
Today’s ClimateDataVisualizer example for AGU is the near-record 2023 cumulative rainfall year in Southern Vermont, which includes an extreme rainfall event on July 10-11. The lines are colored by year and show that as the climate warms, total annual rainfall tends to increase.

December 13, 2023 at 3:30 PM
Today’s ClimateDataVisualizer example for AGU is the near-record 2023 cumulative rainfall year in Southern Vermont, which includes an extreme rainfall event on July 10-11. The lines are colored by year and show that as the climate warms, total annual rainfall tends to increase.
Today’s ClimateDataVizualizer example for AGU is the 2021 Pacific NW heat dome as shown in Portland, OR. NOAA ACIS observations show daily high temps on June 26-28, 2021 up to 9°F higher than any previous day since 1874. In fact, the Portland-wide avg from 4 stations topped out at 115°F on June 28!

December 12, 2023 at 3:43 PM
Today’s ClimateDataVizualizer example for AGU is the 2021 Pacific NW heat dome as shown in Portland, OR. NOAA ACIS observations show daily high temps on June 26-28, 2021 up to 9°F higher than any previous day since 1874. In fact, the Portland-wide avg from 4 stations topped out at 115°F on June 28!
This storm inspired me to create this web tool and I am also excited to share that I will be presenting a poster at the virtual AGU session in January on a new study of mine that analyzes the historical context of this event's rainfall! Hope to see you there! (6/6)

December 11, 2023 at 2:52 PM
This storm inspired me to create this web tool and I am also excited to share that I will be presenting a poster at the virtual AGU session in January on a new study of mine that analyzes the historical context of this event's rainfall! Hope to see you there! (6/6)
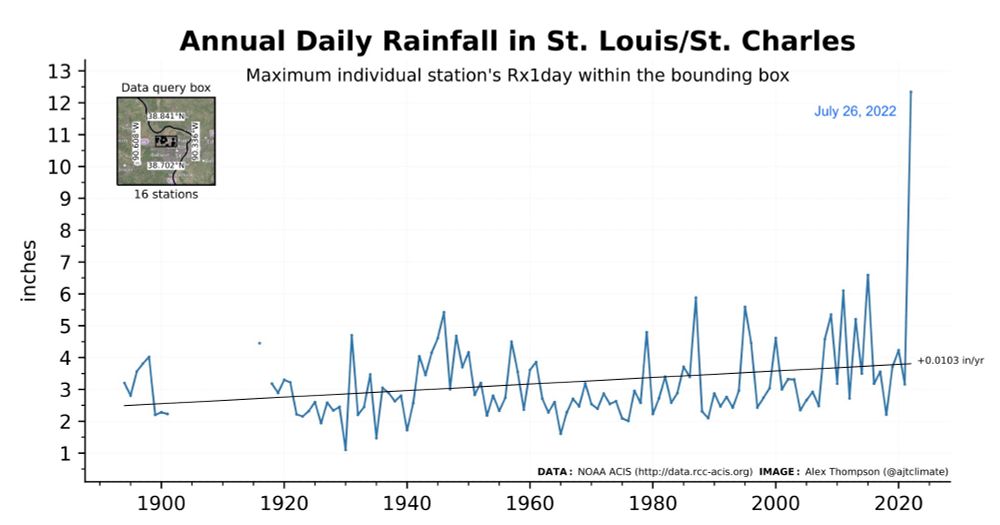
This week, I'll share a few examples of recent extreme climate events and how you can use the web tool to explore them. First up is the extreme rainfall event on July 26, 2022 in St. Louis. Check out how extreme this event was relative to previous yearly max rain events! (5/6)
December 11, 2023 at 2:51 PM
This week, I'll share a few examples of recent extreme climate events and how you can use the web tool to explore them. First up is the extreme rainfall event on July 26, 2022 in St. Louis. Check out how extreme this event was relative to previous yearly max rain events! (5/6)
Although I am attending AGU virtually this year with a newborn at home, I wanted to share a climate data web tool I have been working on over the past several months called Climate Data Visualizer. Give it a try at climate-data-viz.com! A quick 🧵(1/6)

December 11, 2023 at 2:50 PM
Although I am attending AGU virtually this year with a newborn at home, I wanted to share a climate data web tool I have been working on over the past several months called Climate Data Visualizer. Give it a try at climate-data-viz.com! A quick 🧵(1/6)
This storm inspired me to create this web tool and I am also excited to share that I will be presenting a poster at the virtual #AGU session in January on a new study of mine that analyzes the historical context of this event's rainfall! Hope to see you there!
December 11, 2023 at 2:46 PM
This storm inspired me to create this web tool and I am also excited to share that I will be presenting a poster at the virtual #AGU session in January on a new study of mine that analyzes the historical context of this event's rainfall! Hope to see you there!
This week, I'll share a few examples of recent extreme climate events and how you can use the web tool to explore them. First up is the extreme rainfall event on July 26, 2022 in St. Louis. Check out how extreme this event was relative to previous yearly max rain events!
December 11, 2023 at 2:45 PM
This week, I'll share a few examples of recent extreme climate events and how you can use the web tool to explore them. First up is the extreme rainfall event on July 26, 2022 in St. Louis. Check out how extreme this event was relative to previous yearly max rain events!
Here's what yesterday looks like against the entire 70+ year history of rainfall data from JFK

September 30, 2023 at 6:21 PM
Here's what yesterday looks like against the entire 70+ year history of rainfall data from JFK
Time series of annual daily max rainfall (rx1 day) from JFK Airport. Yesterday's 24 total of 8.05 inches beat the previous record from 2011 by about 0.25 inches!

September 30, 2023 at 6:17 PM
Time series of annual daily max rainfall (rx1 day) from JFK Airport. Yesterday's 24 total of 8.05 inches beat the previous record from 2011 by about 0.25 inches!
For my first post on 🟦 I want to share a Python-based app I am making that visualizes the complete climate history of any place in the US. It's a work-in-progress, but I plan to make it a standalone website in the near future! The current app can be accessed here: sites.google.com/view/ajtclim...

September 15, 2023 at 9:18 PM
For my first post on 🟦 I want to share a Python-based app I am making that visualizes the complete climate history of any place in the US. It's a work-in-progress, but I plan to make it a standalone website in the near future! The current app can be accessed here: sites.google.com/view/ajtclim...