


Alex Thompson, PhD
@ajtclimate.bsky.social
Research Scientist studying extreme precipitation | CIRES - CU Boulder | NOAA Affiliate - Physical Sciences Laboratory | PhD 2021 - University of Michigan
Pinned
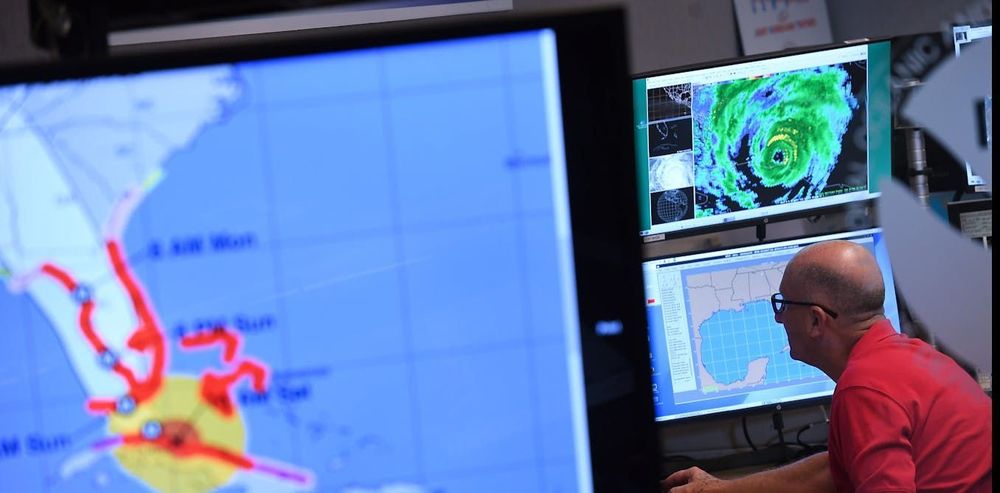
🌧️ Science Alert 🌧️ I am pleased to share newly published work that blends precipitation from both observations and climate models to more precisely assess an extreme precipitation event that took place in July 2022 and caused major flooding across St. Louis, MO and eastern Kentucky (1/6)
I had a career first this week - I was on the news! I talked about the extreme rain event in St. Louis in July 2022 and how my recent publication estimates that it is about twice as likely as we previously thought.
YouTube link to the interview: www.youtube.com/watch?v=MZ7n...
YouTube link to the interview: www.youtube.com/watch?v=MZ7n...

Weather Extra: St. Louis' historic 2022 flooding
YouTube video by FOX 2 St. Louis
www.youtube.com
May 13, 2025 at 2:37 PM
I had a career first this week - I was on the news! I talked about the extreme rain event in St. Louis in July 2022 and how my recent publication estimates that it is about twice as likely as we previously thought.
YouTube link to the interview: www.youtube.com/watch?v=MZ7n...
YouTube link to the interview: www.youtube.com/watch?v=MZ7n...
A new twist to science communication: AI-generated articles trained on science press releases.
One of these was written about my recently published study on extreme precipitation in the Central US.
The training prompt must have been, um, interesting...
One of these was written about my recently published study on extreme precipitation in the Central US.
The training prompt must have been, um, interesting...
May 9, 2025 at 5:17 PM
A new twist to science communication: AI-generated articles trained on science press releases.
One of these was written about my recently published study on extreme precipitation in the Central US.
The training prompt must have been, um, interesting...
One of these was written about my recently published study on extreme precipitation in the Central US.
The training prompt must have been, um, interesting...
WashU press release discussing my recent publication in Journal of Climate
source.washu.edu/2025/04/what...
source.washu.edu/2025/04/what...

What makes a 1-in-1000-year storm, really?
Thunderstorms that swept the central U.S. in 2022 were unprecedented, but their extreme precipitation may not be that rare — especially with global warming, according to a new analysis from researcher...
source.washu.edu
April 4, 2025 at 8:55 PM
WashU press release discussing my recent publication in Journal of Climate
source.washu.edu/2025/04/what...
source.washu.edu/2025/04/what...
Reposted by Alex Thompson, PhD

"NOAA is taxpayer-funded, so it is a public good – its services provide safety and security for everyone, not just those who can pay for it." CIRES' @cwiedinm.bsky.social and Kari Bowen explain @noaa.gov's role in U.S. weather forecasts. @us.theconversation.com @colorado.edu
NOAA’s vast public weather data powers the local forecasts on your phone and TV – a private company alone couldn’t match it
NOAA operates fleets of satellites, sensors on airplanes and ocean-going buoys, as well as radar, providing the data used by weather forecasters nationwide – and freely available to anyone.
buff.ly
February 11, 2025 at 4:15 PM
"NOAA is taxpayer-funded, so it is a public good – its services provide safety and security for everyone, not just those who can pay for it." CIRES' @cwiedinm.bsky.social and Kari Bowen explain @noaa.gov's role in U.S. weather forecasts. @us.theconversation.com @colorado.edu
🌧️ Science Alert 🌧️ I am pleased to share newly published work that blends precipitation from both observations and climate models to more precisely assess an extreme precipitation event that took place in July 2022 and caused major flooding across St. Louis, MO and eastern Kentucky (1/6)
February 10, 2025 at 5:04 PM
🌧️ Science Alert 🌧️ I am pleased to share newly published work that blends precipitation from both observations and climate models to more precisely assess an extreme precipitation event that took place in July 2022 and caused major flooding across St. Louis, MO and eastern Kentucky (1/6)
Year-end report for 2024 daily high temperature from the station at Boulder's NOAA lab: days warmer than the historical mean (1893-2023) outnumbered colder days by ~2.3 to 1

January 16, 2025 at 11:54 PM
Year-end report for 2024 daily high temperature from the station at Boulder's NOAA lab: days warmer than the historical mean (1893-2023) outnumbered colder days by ~2.3 to 1
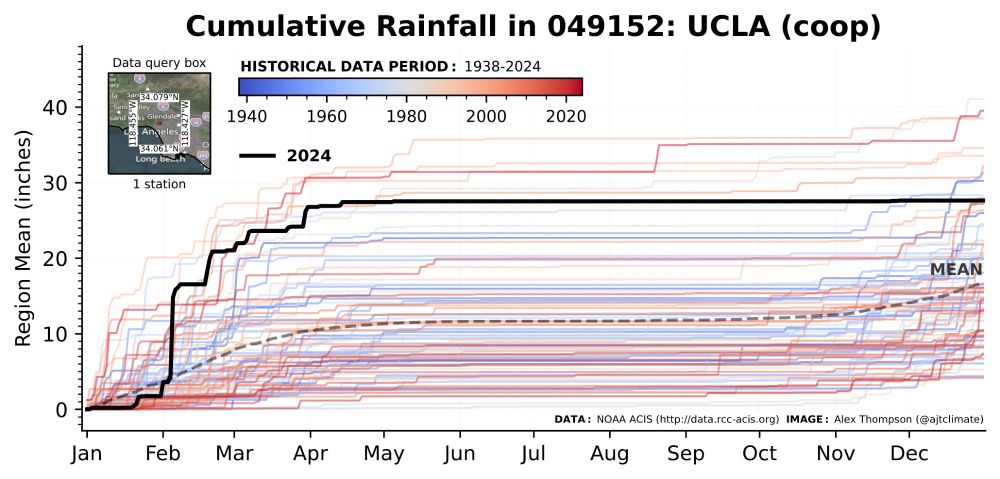
In the lead up to the #PalisadesFire and #EatonFire (using data from a nearby station at UCLA), Southern California experienced one of its wettest periods on record during Jan-Apr 2024 and has not had meaningful rainfall since 🤯 Mindblowingly favorable meteorological conditions for large wildfires
January 10, 2025 at 5:57 PM
In the lead up to the #PalisadesFire and #EatonFire (using data from a nearby station at UCLA), Southern California experienced one of its wettest periods on record during Jan-Apr 2024 and has not had meaningful rainfall since 🤯 Mindblowingly favorable meteorological conditions for large wildfires
The last ClimateDataVisualizer example for AGU is the August 20, 2023 rainfall event in Death Valley NP from remnants of Hurricane Hilary. This event was the single highest recorded day since 1912 and accounted for an entire year's worth of 🌧️ in a single day

December 15, 2023 at 3:52 PM
The last ClimateDataVisualizer example for AGU is the August 20, 2023 rainfall event in Death Valley NP from remnants of Hurricane Hilary. This event was the single highest recorded day since 1912 and accounted for an entire year's worth of 🌧️ in a single day
Today’s ClimateDataVisualizer example for AGU is annual rainfall for Western Maui in the years preceding 2023’s devastating wildfire. Some of the lowest annual rainfall totals since 1920 occurred in the last few years, drying out the region and priming it for a severe wildfire.

December 14, 2023 at 4:59 PM
Today’s ClimateDataVisualizer example for AGU is annual rainfall for Western Maui in the years preceding 2023’s devastating wildfire. Some of the lowest annual rainfall totals since 1920 occurred in the last few years, drying out the region and priming it for a severe wildfire.
Today’s ClimateDataVisualizer example for AGU is the near-record 2023 cumulative rainfall year in Southern Vermont, which includes an extreme rainfall event on July 10-11. The lines are colored by year and show that as the climate warms, total annual rainfall tends to increase.

December 13, 2023 at 3:30 PM
Today’s ClimateDataVisualizer example for AGU is the near-record 2023 cumulative rainfall year in Southern Vermont, which includes an extreme rainfall event on July 10-11. The lines are colored by year and show that as the climate warms, total annual rainfall tends to increase.
Today’s ClimateDataVizualizer example for AGU is the 2021 Pacific NW heat dome as shown in Portland, OR. NOAA ACIS observations show daily high temps on June 26-28, 2021 up to 9°F higher than any previous day since 1874. In fact, the Portland-wide avg from 4 stations topped out at 115°F on June 28!

December 12, 2023 at 3:43 PM
Today’s ClimateDataVizualizer example for AGU is the 2021 Pacific NW heat dome as shown in Portland, OR. NOAA ACIS observations show daily high temps on June 26-28, 2021 up to 9°F higher than any previous day since 1874. In fact, the Portland-wide avg from 4 stations topped out at 115°F on June 28!
Although I am attending AGU virtually this year with a newborn at home, I wanted to share a climate data web tool I have been working on over the past several months called Climate Data Visualizer. Give it a try at climate-data-viz.com! A quick 🧵(1/6)

December 11, 2023 at 2:50 PM
Although I am attending AGU virtually this year with a newborn at home, I wanted to share a climate data web tool I have been working on over the past several months called Climate Data Visualizer. Give it a try at climate-data-viz.com! A quick 🧵(1/6)
Time series of annual daily max rainfall (rx1 day) from JFK Airport. Yesterday's 24 total of 8.05 inches beat the previous record from 2011 by about 0.25 inches!

September 30, 2023 at 6:17 PM
Time series of annual daily max rainfall (rx1 day) from JFK Airport. Yesterday's 24 total of 8.05 inches beat the previous record from 2011 by about 0.25 inches!
For my first post on 🟦 I want to share a Python-based app I am making that visualizes the complete climate history of any place in the US. It's a work-in-progress, but I plan to make it a standalone website in the near future! The current app can be accessed here: sites.google.com/view/ajtclim...

September 15, 2023 at 9:18 PM
For my first post on 🟦 I want to share a Python-based app I am making that visualizes the complete climate history of any place in the US. It's a work-in-progress, but I plan to make it a standalone website in the near future! The current app can be accessed here: sites.google.com/view/ajtclim...