


Sickandtiredaus Jordan Crane
@sickandtiredaus.bsky.social
Pinned
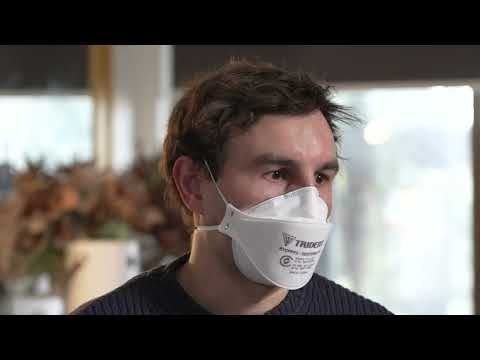
Jordan’s long COVID story
YouTube video by Department of Health Victoria
youtu.be
You can protect yourself & your loved ones from COVID with these 6 steps:
😷 Wear a respirator mask
🏠 Stay home if sick
⏰ Test if you have symptoms
🌳 Let fresh air in or meet outdoors
💉 Stay up to date with your vaccinations
💡 Talk to your GP about COVID medicines.
youtu.be/FlBfq22nxt8?...
😷 Wear a respirator mask
🏠 Stay home if sick
⏰ Test if you have symptoms
🌳 Let fresh air in or meet outdoors
💉 Stay up to date with your vaccinations
💡 Talk to your GP about COVID medicines.
youtu.be/FlBfq22nxt8?...
Australian C19 Weekly Update - 14th November 2025
Note: Cases recorded are from PCR testing only. Actual cases are significantly higher.
Data from: nindss.health.gov.au/pbi-dashboard/
Thanks to @angiecibisdesign for the design!
1/4
Note: Cases recorded are from PCR testing only. Actual cases are significantly higher.
Data from: nindss.health.gov.au/pbi-dashboard/
Thanks to @angiecibisdesign for the design!
1/4

November 14, 2025 at 7:04 AM
Australian C19 Weekly Update - 14th November 2025
Note: Cases recorded are from PCR testing only. Actual cases are significantly higher.
Data from: nindss.health.gov.au/pbi-dashboard/
Thanks to @angiecibisdesign for the design!
1/4
Note: Cases recorded are from PCR testing only. Actual cases are significantly higher.
Data from: nindss.health.gov.au/pbi-dashboard/
Thanks to @angiecibisdesign for the design!
1/4

November 14, 2025 at 4:29 AM
Channel 9 News report on Australian Centre for Disease Control, with some important notes.
November 14, 2025 at 12:22 AM
Channel 9 News report on Australian Centre for Disease Control, with some important notes.
Reposted by Sickandtiredaus Jordan Crane

Aus Human Rights Commission - Disability Discrimination Act survey
CLOSING DATE: Friday 14th November, 2025 - TODAY!
consultations.ag.gov.au/rights-and-p...
Survey submission guide in next post.
1/2
CLOSING DATE: Friday 14th November, 2025 - TODAY!
consultations.ag.gov.au/rights-and-p...
Survey submission guide in next post.
1/2
Disability Discrimination Act Review – Community Survey
- Attorney-General's Department
- Citizen Space
Find and participate in consultations run by Attorney General's Department
consultations.ag.gov.au
November 13, 2025 at 11:43 PM
Aus Human Rights Commission - Disability Discrimination Act survey
CLOSING DATE: Friday 14th November, 2025 - TODAY!
consultations.ag.gov.au/rights-and-p...
Survey submission guide in next post.
1/2
CLOSING DATE: Friday 14th November, 2025 - TODAY!
consultations.ag.gov.au/rights-and-p...
Survey submission guide in next post.
1/2
For anyone in Victoria that goes to the Leaf Bookshop, they have new owners and staff will no longer be masking.

November 13, 2025 at 9:18 PM
For anyone in Victoria that goes to the Leaf Bookshop, they have new owners and staff will no longer be masking.
Reposted by Sickandtiredaus Jordan Crane

Ethan at Breathe Safe Air is giving away an AirSpot!
All you need to do is head across to the Breathe Safe Air Forum:
forum.breathesafeair.com/t/win-an-air...
And answer the below question before midnight November 23rd (GMT +5)
When did you first realize how important indoor air quality is?
All you need to do is head across to the Breathe Safe Air Forum:
forum.breathesafeair.com/t/win-an-air...
And answer the below question before midnight November 23rd (GMT +5)
When did you first realize how important indoor air quality is?

Win an AirSpot CO2 Monitor! (Week 3)
In collaboration with AirSpotHealth, we have already given away four monitors over the past couple of weeks. Now we are giving away two more! You can find the thread to the previous giveaways here: W...
forum.breathesafeair.com
November 13, 2025 at 4:03 AM
Ethan at Breathe Safe Air is giving away an AirSpot!
All you need to do is head across to the Breathe Safe Air Forum:
forum.breathesafeair.com/t/win-an-air...
And answer the below question before midnight November 23rd (GMT +5)
When did you first realize how important indoor air quality is?
All you need to do is head across to the Breathe Safe Air Forum:
forum.breathesafeair.com/t/win-an-air...
And answer the below question before midnight November 23rd (GMT +5)
When did you first realize how important indoor air quality is?
Reposted by Sickandtiredaus Jordan Crane

🧵(1/3) NSW respiratory surveillance reports: Week ending 8 November 2025
🔸COVID positivity rate: 2.4% (Stable)
🔸Number of laboratories reporting COVID: 3 out of 4
🔹COVID: 715 (+13.9%)
🔹Influenza: 3,029 (+33.3%)
🔹RSV: 445 (+14.7%)
@NSWHealth
Source: health.nsw.gov.au/Infectious/c...
🔸COVID positivity rate: 2.4% (Stable)
🔸Number of laboratories reporting COVID: 3 out of 4
🔹COVID: 715 (+13.9%)
🔹Influenza: 3,029 (+33.3%)
🔹RSV: 445 (+14.7%)
@NSWHealth
Source: health.nsw.gov.au/Infectious/c...


November 13, 2025 at 12:39 AM
🧵(1/3) NSW respiratory surveillance reports: Week ending 8 November 2025
🔸COVID positivity rate: 2.4% (Stable)
🔸Number of laboratories reporting COVID: 3 out of 4
🔹COVID: 715 (+13.9%)
🔹Influenza: 3,029 (+33.3%)
🔹RSV: 445 (+14.7%)
@NSWHealth
Source: health.nsw.gov.au/Infectious/c...
🔸COVID positivity rate: 2.4% (Stable)
🔸Number of laboratories reporting COVID: 3 out of 4
🔹COVID: 715 (+13.9%)
🔹Influenza: 3,029 (+33.3%)
🔹RSV: 445 (+14.7%)
@NSWHealth
Source: health.nsw.gov.au/Infectious/c...
Reposted by Sickandtiredaus Jordan Crane
COMING SOON to your AIRSPOT!
Notifications will soon let you know when CO2 PPM Thresholds have been reached, making it easier for you to quickly take action to keep yourself safe!
Notifications will soon let you know when CO2 PPM Thresholds have been reached, making it easier for you to quickly take action to keep yourself safe!
November 12, 2025 at 5:37 AM
COMING SOON to your AIRSPOT!
Notifications will soon let you know when CO2 PPM Thresholds have been reached, making it easier for you to quickly take action to keep yourself safe!
Notifications will soon let you know when CO2 PPM Thresholds have been reached, making it easier for you to quickly take action to keep yourself safe!
Reposted by Sickandtiredaus Jordan Crane
Queensland Weekly Respiratory Surveillance Report: 4 Nov to 10 Nov 2025
Reported cases:
🔹COVID: 297 (+16.9%)
🔹Influenza: 1,298 (+17.4%)
🔹RSV: 413 (-2.5%)
Hospitalisations:
🔸COVID: 21 (+31.2%)
🔸Influenza: 69 (+21.0%)
🔸RSV: 24 (-22.5%)
Source: health.qld.gov.au/clinical-pra...
Reported cases:
🔹COVID: 297 (+16.9%)
🔹Influenza: 1,298 (+17.4%)
🔹RSV: 413 (-2.5%)
Hospitalisations:
🔸COVID: 21 (+31.2%)
🔸Influenza: 69 (+21.0%)
🔸RSV: 24 (-22.5%)
Source: health.qld.gov.au/clinical-pra...

November 11, 2025 at 6:43 AM
Queensland Weekly Respiratory Surveillance Report: 4 Nov to 10 Nov 2025
Reported cases:
🔹COVID: 297 (+16.9%)
🔹Influenza: 1,298 (+17.4%)
🔹RSV: 413 (-2.5%)
Hospitalisations:
🔸COVID: 21 (+31.2%)
🔸Influenza: 69 (+21.0%)
🔸RSV: 24 (-22.5%)
Source: health.qld.gov.au/clinical-pra...
Reported cases:
🔹COVID: 297 (+16.9%)
🔹Influenza: 1,298 (+17.4%)
🔹RSV: 413 (-2.5%)
Hospitalisations:
🔸COVID: 21 (+31.2%)
🔸Influenza: 69 (+21.0%)
🔸RSV: 24 (-22.5%)
Source: health.qld.gov.au/clinical-pra...
Reposted by Sickandtiredaus Jordan Crane
COMING SOON to your AIRSPOT!
Want to see how much time you are spending in the CO2 Green Zone (Below 800ppm) each day?
You will soon be able to see this using our Pie Chart Analyser.
Want to see how much time you are spending in the CO2 Green Zone (Below 800ppm) each day?
You will soon be able to see this using our Pie Chart Analyser.
November 11, 2025 at 5:39 AM
COMING SOON to your AIRSPOT!
Want to see how much time you are spending in the CO2 Green Zone (Below 800ppm) each day?
You will soon be able to see this using our Pie Chart Analyser.
Want to see how much time you are spending in the CO2 Green Zone (Below 800ppm) each day?
You will soon be able to see this using our Pie Chart Analyser.
Life Expectancy Australia 2022-2024, released today.
www.abs.gov.au/statistics/p...
Remains steady across Australia, for Females and Males when compared to 2021-2023, the first time it has not dropped in 3 years.
1/3
www.abs.gov.au/statistics/p...
Remains steady across Australia, for Females and Males when compared to 2021-2023, the first time it has not dropped in 3 years.
1/3


November 11, 2025 at 1:22 AM
Life Expectancy Australia 2022-2024, released today.
www.abs.gov.au/statistics/p...
Remains steady across Australia, for Females and Males when compared to 2021-2023, the first time it has not dropped in 3 years.
1/3
www.abs.gov.au/statistics/p...
Remains steady across Australia, for Females and Males when compared to 2021-2023, the first time it has not dropped in 3 years.
1/3
Reposted by Sickandtiredaus Jordan Crane
Tern is right. It’s great having an informed online community that’s adapted to the ongoing pandemic reality and is doing everything possible to stay safe.
I know it’s been a tough ride, but please know you are not alone.
Source: x.com/1goodtern/st...
I know it’s been a tough ride, but please know you are not alone.
Source: x.com/1goodtern/st...

November 10, 2025 at 6:25 AM
Tern is right. It’s great having an informed online community that’s adapted to the ongoing pandemic reality and is doing everything possible to stay safe.
I know it’s been a tough ride, but please know you are not alone.
Source: x.com/1goodtern/st...
I know it’s been a tough ride, but please know you are not alone.
Source: x.com/1goodtern/st...
Reposted by Sickandtiredaus Jordan Crane
Image 1: Flying home
Image 2: AirSpot Health CO2 Map, now with listings around Canberra
Image 3: Pie Graph showing time spent in Green Zone (Below 800ppm CO2) for each day in Canberra
1/2
Image 2: AirSpot Health CO2 Map, now with listings around Canberra
Image 3: Pie Graph showing time spent in Green Zone (Below 800ppm CO2) for each day in Canberra
1/2


November 10, 2025 at 5:03 AM
Image 1: Flying home
Image 2: AirSpot Health CO2 Map, now with listings around Canberra
Image 3: Pie Graph showing time spent in Green Zone (Below 800ppm CO2) for each day in Canberra
1/2
Image 2: AirSpot Health CO2 Map, now with listings around Canberra
Image 3: Pie Graph showing time spent in Green Zone (Below 800ppm CO2) for each day in Canberra
1/2
Reposted by Sickandtiredaus Jordan Crane
Image 4: @sickandtiredaus.bsky.social at Canberra Airport
Image 5: Bar Graph showing CO2 over time in Canberra
2/2
Image 5: Bar Graph showing CO2 over time in Canberra
2/2


November 10, 2025 at 5:04 AM
Image 4: @sickandtiredaus.bsky.social at Canberra Airport
Image 5: Bar Graph showing CO2 over time in Canberra
2/2
Image 5: Bar Graph showing CO2 over time in Canberra
2/2
Australian C19 Weekly Update - 7th November 2025
Note: Cases recorded are from PCR testing only. Actual cases are significantly higher.
Data from: nindss.health.gov.au/pbi-dashboard/
Thanks to @angiecibisdesign for the design!
1/4
Note: Cases recorded are from PCR testing only. Actual cases are significantly higher.
Data from: nindss.health.gov.au/pbi-dashboard/
Thanks to @angiecibisdesign for the design!
1/4

November 7, 2025 at 9:10 PM
Australian C19 Weekly Update - 7th November 2025
Note: Cases recorded are from PCR testing only. Actual cases are significantly higher.
Data from: nindss.health.gov.au/pbi-dashboard/
Thanks to @angiecibisdesign for the design!
1/4
Note: Cases recorded are from PCR testing only. Actual cases are significantly higher.
Data from: nindss.health.gov.au/pbi-dashboard/
Thanks to @angiecibisdesign for the design!
1/4
Reposted by Sickandtiredaus Jordan Crane
Image 5: Safer Air Project lanyard and Air Club badge

November 7, 2025 at 5:29 AM
Image 5: Safer Air Project lanyard and Air Club badge
Reposted by Sickandtiredaus Jordan Crane
Image 1: @sickandtiredaus.bsky.social at @saferairproject.bsky.social conference.
Image 2: Parliament House CO2 reading on AirSpot CO2 Map.
Image 3: CO2 reading at The Shine Dome, Canberra, Making the Invisible, Visible Campaign.
Image 4: Safer Air Project Conference
Image 2: Parliament House CO2 reading on AirSpot CO2 Map.
Image 3: CO2 reading at The Shine Dome, Canberra, Making the Invisible, Visible Campaign.
Image 4: Safer Air Project Conference


November 7, 2025 at 5:28 AM
Image 1: @sickandtiredaus.bsky.social at @saferairproject.bsky.social conference.
Image 2: Parliament House CO2 reading on AirSpot CO2 Map.
Image 3: CO2 reading at The Shine Dome, Canberra, Making the Invisible, Visible Campaign.
Image 4: Safer Air Project Conference
Image 2: Parliament House CO2 reading on AirSpot CO2 Map.
Image 3: CO2 reading at The Shine Dome, Canberra, Making the Invisible, Visible Campaign.
Image 4: Safer Air Project Conference
Reposted by Sickandtiredaus Jordan Crane
Video: Turning on flight mode on AirSpot app
November 5, 2025 at 10:10 AM
Video: Turning on flight mode on AirSpot app
Reposted by Sickandtiredaus Jordan Crane
Image 1: @sickandtiredaus.bsky.social at Airport
Image 2: @sickandtiredaus.bsky.social in plane
Image 3: AirSpot readings for the day (can you tell when I was on the plane?)
Image 2: @sickandtiredaus.bsky.social in plane
Image 3: AirSpot readings for the day (can you tell when I was on the plane?)


November 5, 2025 at 10:08 AM
Image 1: @sickandtiredaus.bsky.social at Airport
Image 2: @sickandtiredaus.bsky.social in plane
Image 3: AirSpot readings for the day (can you tell when I was on the plane?)
Image 2: @sickandtiredaus.bsky.social in plane
Image 3: AirSpot readings for the day (can you tell when I was on the plane?)
Reposted by Sickandtiredaus Jordan Crane
@saferairproject.bsky.social setting up an environment to keep us all safe for tomorrow's Safer Shared Air Conference.
- @sickandtiredaus.bsky.social
- @sickandtiredaus.bsky.social

November 4, 2025 at 11:25 PM
@saferairproject.bsky.social setting up an environment to keep us all safe for tomorrow's Safer Shared Air Conference.
- @sickandtiredaus.bsky.social
- @sickandtiredaus.bsky.social
Reposted by Sickandtiredaus Jordan Crane
I am flying to Canberra tomorrow for the @saferairproject.bsky.social Conference and am just packing now. What am I missing!?
- @sickandtiredaus.bsky.social
- @sickandtiredaus.bsky.social

November 4, 2025 at 6:48 AM
I am flying to Canberra tomorrow for the @saferairproject.bsky.social Conference and am just packing now. What am I missing!?
- @sickandtiredaus.bsky.social
- @sickandtiredaus.bsky.social
Reposted by Sickandtiredaus Jordan Crane
Australian scientist who alerted world that COVID is airborne wins top science prize
When the WHO falsely claimed in March 2020 that COVID wasn’t airborne, Professor Lidia Morawska took action—organising 239 scientists worldwide to warn about SARS-CoV-2 airborne spread and urge global recognition.
When the WHO falsely claimed in March 2020 that COVID wasn’t airborne, Professor Lidia Morawska took action—organising 239 scientists worldwide to warn about SARS-CoV-2 airborne spread and urge global recognition.

Australian scientist who alerted world that Covid is airborne wins top science prize
Prof Lidia Morawska says recognition of her research comes at a fraught time – an ‘age of anti-science’
www.theguardian.com
November 4, 2025 at 12:02 AM
Australian scientist who alerted world that COVID is airborne wins top science prize
When the WHO falsely claimed in March 2020 that COVID wasn’t airborne, Professor Lidia Morawska took action—organising 239 scientists worldwide to warn about SARS-CoV-2 airborne spread and urge global recognition.
When the WHO falsely claimed in March 2020 that COVID wasn’t airborne, Professor Lidia Morawska took action—organising 239 scientists worldwide to warn about SARS-CoV-2 airborne spread and urge global recognition.
Reposted by Sickandtiredaus Jordan Crane
Session 3 - Making indoor air safer for everyone to breathe
We’re delighted to announce the speakers in our final session for our Making the invisible visible conference this week.
We’re delighted to announce the speakers in our final session for our Making the invisible visible conference this week.

November 3, 2025 at 4:17 AM
Session 3 - Making indoor air safer for everyone to breathe
We’re delighted to announce the speakers in our final session for our Making the invisible visible conference this week.
We’re delighted to announce the speakers in our final session for our Making the invisible visible conference this week.
Reposted by Sickandtiredaus Jordan Crane
“a global insurance firm that analyzes mortality risk pegged the # of excess deaths at 2% above the pre-pandemic annual mortality rate…that’s 120K unanticipated dead people per year in North America. That’s roughly 2 fully loaded standard commercial jets crashing & killing everyone aboard each day.”

This Physicist Says We Don’t Take COVID Seriously Enough | The Tyee
We downplay the virus at our peril, warns Yaneer Bar-Yam. And children are more at risk than we thought.
thetyee.ca
November 2, 2025 at 5:50 PM
“a global insurance firm that analyzes mortality risk pegged the # of excess deaths at 2% above the pre-pandemic annual mortality rate…that’s 120K unanticipated dead people per year in North America. That’s roughly 2 fully loaded standard commercial jets crashing & killing everyone aboard each day.”
Reposted by Sickandtiredaus Jordan Crane
"This Physicist Says We Don’t Take COVID Seriously Enough"
"We downplay the virus at our peril, warns Yaneer Bar-Yam. And children are more at risk than we thought."
Source: archive.li/Op73F
"We downplay the virus at our peril, warns Yaneer Bar-Yam. And children are more at risk than we thought."
Source: archive.li/Op73F

November 1, 2025 at 11:25 PM
"This Physicist Says We Don’t Take COVID Seriously Enough"
"We downplay the virus at our peril, warns Yaneer Bar-Yam. And children are more at risk than we thought."
Source: archive.li/Op73F
"We downplay the virus at our peril, warns Yaneer Bar-Yam. And children are more at risk than we thought."
Source: archive.li/Op73F