


Mike McGlone
@mikemcglone.bsky.social
Senior Commodity Strategist - Bloomberg Intelligence


21-million numbers on a screen tracking little of substance vs. one in 2009 -- cryptocurrencies may signal a bigger risk-assets bubble than internet stocks in 1999. The S&P 500 total return flatline vs. gold started in 1997 and in 2017 for the Bloomberg Galaxy Crypto Index vs. the store of value.

September 21, 2025 at 7:16 PM
21-million numbers on a screen tracking little of substance vs. one in 2009 -- cryptocurrencies may signal a bigger risk-assets bubble than internet stocks in 1999. The S&P 500 total return flatline vs. gold started in 1997 and in 2017 for the Bloomberg Galaxy Crypto Index vs. the store of value.
The previous post highlighted Bitcoin leading indicator, Strategy Inc., rolling over and US T-Bond prices recovering. This 50-year chart shows the crocodile jaws ripe to bite that may signal normal deflation from inflation: expensive stocks vs. cheap bonds. Does record-setting gold get it?

September 21, 2025 at 6:49 PM
The previous post highlighted Bitcoin leading indicator, Strategy Inc., rolling over and US T-Bond prices recovering. This 50-year chart shows the crocodile jaws ripe to bite that may signal normal deflation from inflation: expensive stocks vs. cheap bonds. Does record-setting gold get it?
Double-dog daring the market gods and doubling down on a 10x -- what could go wrong? Strategy Inc. has bounced back up to its 200-day moving average, which has rolled over. Nov. 2021 was the last time it did that, on Bitcoin's path to the 2022 low near $15.500 from 2021's high around $68,900.

September 21, 2025 at 6:32 PM
Double-dog daring the market gods and doubling down on a 10x -- what could go wrong? Strategy Inc. has bounced back up to its 200-day moving average, which has rolled over. Nov. 2021 was the last time it did that, on Bitcoin's path to the 2022 low near $15.500 from 2021's high around $68,900.
Platinum's long consolidation period at around $1,000 may have formed a solid foundation to revisit $2,000. My graphic shows a key factor favoring the unique industrial, precious and chemical-catalyst metal: On April 21, the platinum/gold cross hit 0.28, the lowest level in our database since 1987.

September 21, 2025 at 5:53 PM
Platinum's long consolidation period at around $1,000 may have formed a solid foundation to revisit $2,000. My graphic shows a key factor favoring the unique industrial, precious and chemical-catalyst metal: On April 21, the platinum/gold cross hit 0.28, the lowest level in our database since 1987.
Following five months of consolidation below $3,500 an ounce after first trading there in April, gold's breakout may have shifted the threshold to support from resistance. The next round number resistance is $4,000, which might be a matter of time, particularly if risk assets weaken.

September 21, 2025 at 5:48 PM
Following five months of consolidation below $3,500 an ounce after first trading there in April, gold's breakout may have shifted the threshold to support from resistance. The next round number resistance is $4,000, which might be a matter of time, particularly if risk assets weaken.
Fed's cutting, stocks go up is a fallacy
milkroad.com/podcast/what...
milkroad.com/podcast/what...

What Do Fed Rate Cuts Mean For Markets w/ Mike McGlone
In this episode, Bloomberg Intelligence Senior Macro Strategist Mike McGlone joins us to break down what the latest 25bps rate ...
milkroad.com
September 20, 2025 at 3:48 PM
Fed's cutting, stocks go up is a fallacy
milkroad.com/podcast/what...
milkroad.com/podcast/what...
Silver May Be on a Mission Toward $50 -
What was silver resistance around $35 an ounce has likely transitioned to support, with the metal on track to revisit its 2011 peak near $50. A key question from my graphic is: what might disrupt this upward trajectory?
What was silver resistance around $35 an ounce has likely transitioned to support, with the metal on track to revisit its 2011 peak near $50. A key question from my graphic is: what might disrupt this upward trajectory?

September 20, 2025 at 3:41 PM
Silver May Be on a Mission Toward $50 -
What was silver resistance around $35 an ounce has likely transitioned to support, with the metal on track to revisit its 2011 peak near $50. A key question from my graphic is: what might disrupt this upward trajectory?
What was silver resistance around $35 an ounce has likely transitioned to support, with the metal on track to revisit its 2011 peak near $50. A key question from my graphic is: what might disrupt this upward trajectory?
This year's downtrend in the S&P 500 (SPX) vs. gold may be front-running the resumption of Fed easing and a recession. What's notable from my graphic is the tendency for the stock index, in ounces of the metal, to decline when the central bank cuts rates -- and the room to the downside.

September 20, 2025 at 3:34 PM
This year's downtrend in the S&P 500 (SPX) vs. gold may be front-running the resumption of Fed easing and a recession. What's notable from my graphic is the tendency for the stock index, in ounces of the metal, to decline when the central bank cuts rates -- and the room to the downside.
Gold ETFs Going Crypto-Like?
Bloomberg's measure of total gold ETF holdings jumped to a three-year high. At 95.8 million ounces on Aug. 19, my graphic shows this metric surpassing the 92 million threshold first reached in 2020, but with a big difference -- stock market volatility was rising then.
Bloomberg's measure of total gold ETF holdings jumped to a three-year high. At 95.8 million ounces on Aug. 19, my graphic shows this metric surpassing the 92 million threshold first reached in 2020, but with a big difference -- stock market volatility was rising then.

September 20, 2025 at 3:26 PM
Gold ETFs Going Crypto-Like?
Bloomberg's measure of total gold ETF holdings jumped to a three-year high. At 95.8 million ounces on Aug. 19, my graphic shows this metric surpassing the 92 million threshold first reached in 2020, but with a big difference -- stock market volatility was rising then.
Bloomberg's measure of total gold ETF holdings jumped to a three-year high. At 95.8 million ounces on Aug. 19, my graphic shows this metric surpassing the 92 million threshold first reached in 2020, but with a big difference -- stock market volatility was rising then.
If markets finish 3Q near Sept. 19 levels, the last US stock-to-GDP comparison would be 1936, and for WTI barrels gold, 2020 and 1934. How much further can they extend, and what might spark some reversion are key takeaways from my quarterly chart showing S&P 500/GDP at 2.2x and gold/crude at 57

September 20, 2025 at 3:02 PM
If markets finish 3Q near Sept. 19 levels, the last US stock-to-GDP comparison would be 1936, and for WTI barrels gold, 2020 and 1934. How much further can they extend, and what might spark some reversion are key takeaways from my quarterly chart showing S&P 500/GDP at 2.2x and gold/crude at 57
Besides a breakout chart pattern akin to cocoa before its parabolic rise in 2024, platinum's underpinnings could stem from reaching a record low vs. gold in April. Platinum's 2025 high near $1,500 may be a speed bump on the way to $2,000 and potentially a new record.

September 19, 2025 at 1:10 PM
Besides a breakout chart pattern akin to cocoa before its parabolic rise in 2024, platinum's underpinnings could stem from reaching a record low vs. gold in April. Platinum's 2025 high near $1,500 may be a speed bump on the way to $2,000 and potentially a new record.
Breakout Underpinnings and Leading Rabbit - Gold
Roughly 25 years of platinum trading have created a solid breakout base from the mean, median and mode around $1,000 an ounce. This may now be transitioning toward $2,000, supported by gold's strength.
#platinum #gold #technicalanalysis
Roughly 25 years of platinum trading have created a solid breakout base from the mean, median and mode around $1,000 an ounce. This may now be transitioning toward $2,000, supported by gold's strength.
#platinum #gold #technicalanalysis

September 19, 2025 at 1:06 PM
Breakout Underpinnings and Leading Rabbit - Gold
Roughly 25 years of platinum trading have created a solid breakout base from the mean, median and mode around $1,000 an ounce. This may now be transitioning toward $2,000, supported by gold's strength.
#platinum #gold #technicalanalysis
Roughly 25 years of platinum trading have created a solid breakout base from the mean, median and mode around $1,000 an ounce. This may now be transitioning toward $2,000, supported by gold's strength.
#platinum #gold #technicalanalysis

What had been gold resistance near $3,500 since April has flipped to support, leaving $4,000 as the next key target. Additional rally fuel may be required, and a top candidate is a decline in the US stocks. Gold ETFs and hedge fund positions don't show the typical extremes that can mark price peaks

September 18, 2025 at 10:38 AM
What had been gold resistance near $3,500 since April has flipped to support, leaving $4,000 as the next key target. Additional rally fuel may be required, and a top candidate is a decline in the US stocks. Gold ETFs and hedge fund positions don't show the typical extremes that can mark price peaks
Bull markets get extended and often achieve thresholds that can cap prices for enduring periods, and $4,000 gold appears to be good resistance. Aligned with 70% above its 16-quarter moving average, a move to $4,000 would match the extremes that capped rallies in 2006, 2008 and, most recently, 2011.
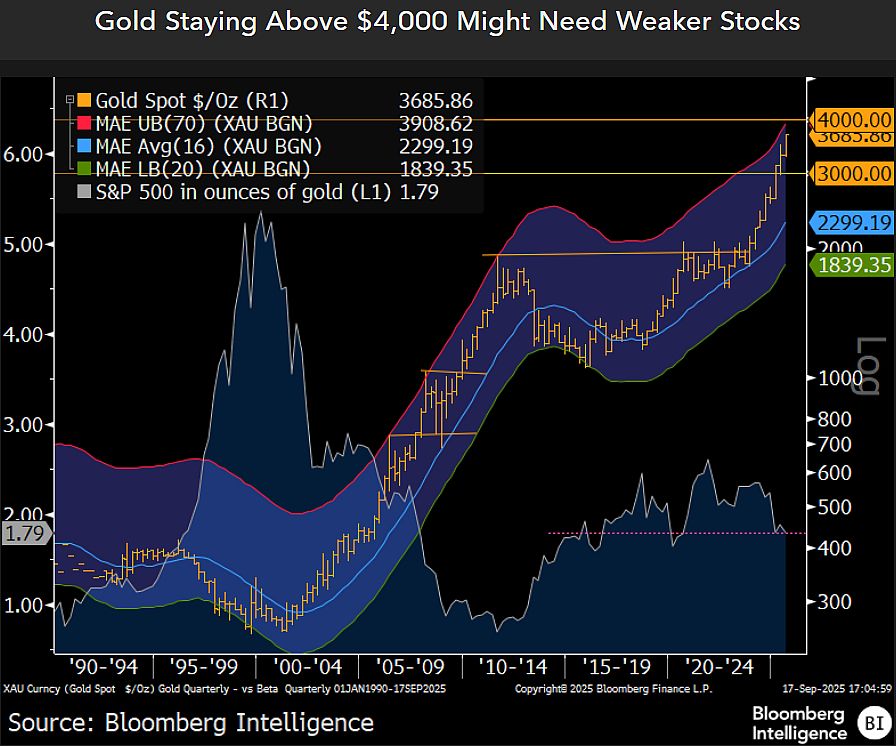
September 18, 2025 at 10:34 AM
Bull markets get extended and often achieve thresholds that can cap prices for enduring periods, and $4,000 gold appears to be good resistance. Aligned with 70% above its 16-quarter moving average, a move to $4,000 would match the extremes that capped rallies in 2006, 2008 and, most recently, 2011.
After being contained between $20-$35 from 2021-24, silver now appears to be transitioning former resistance into support as it advances toward its peak near $50. The gold-to-silver ratio's April high near 105 reflected a steep discount to gold, tilting relative value in favor of the white metal.

September 18, 2025 at 10:28 AM
After being contained between $20-$35 from 2021-24, silver now appears to be transitioning former resistance into support as it advances toward its peak near $50. The gold-to-silver ratio's April high near 105 reflected a steep discount to gold, tilting relative value in favor of the white metal.
Silver's support and resistance goal posts have likely shifted to $35-$50 an ounce, from the $20-$35 that contained the metal from 2021-24. On an annual chart, silver appears to be retracing its candlestick extension from 2011, potentially toward that year's peak of $49.80
#silver
#silver

September 18, 2025 at 10:24 AM
Silver's support and resistance goal posts have likely shifted to $35-$50 an ounce, from the $20-$35 that contained the metal from 2021-24. On an annual chart, silver appears to be retracing its candlestick extension from 2011, potentially toward that year's peak of $49.80
#silver
#silver
Record-setting gold might be signaling a third drawdown of about 50% in the US stock market since 2000. Expectations that equity prices will rise on the back of Federal Reserve easing could be a fallacy when considering the initial rate cuts in 2001 and 2007.
September 17, 2025 at 10:45 AM
Record-setting gold might be signaling a third drawdown of about 50% in the US stock market since 2000. Expectations that equity prices will rise on the back of Federal Reserve easing could be a fallacy when considering the initial rate cuts in 2001 and 2007.
Stocks Declining vs. Gold Isn't a Good Sign -
The lowest S&P 500 12-month dividend yield since 2001 may signal reversion risks that outperforming gold is sniffing out. My annual chart shows an ominous rollover pattern in the stock index measured in terms of the metal.
The lowest S&P 500 12-month dividend yield since 2001 may signal reversion risks that outperforming gold is sniffing out. My annual chart shows an ominous rollover pattern in the stock index measured in terms of the metal.

September 17, 2025 at 10:44 AM
Stocks Declining vs. Gold Isn't a Good Sign -
The lowest S&P 500 12-month dividend yield since 2001 may signal reversion risks that outperforming gold is sniffing out. My annual chart shows an ominous rollover pattern in the stock index measured in terms of the metal.
The lowest S&P 500 12-month dividend yield since 2001 may signal reversion risks that outperforming gold is sniffing out. My annual chart shows an ominous rollover pattern in the stock index measured in terms of the metal.
Reversion Can Be Profound -- Bonds/Gold vs. Stocks
The lowest US Treasury-note prices since 1983 vs. gold and highest stock-market capitalization-to-GDP in about 100 years are ripe for reversion. A bit of pickup in stock-market volatility in 4Q could be a spark.
The lowest US Treasury-note prices since 1983 vs. gold and highest stock-market capitalization-to-GDP in about 100 years are ripe for reversion. A bit of pickup in stock-market volatility in 4Q could be a spark.
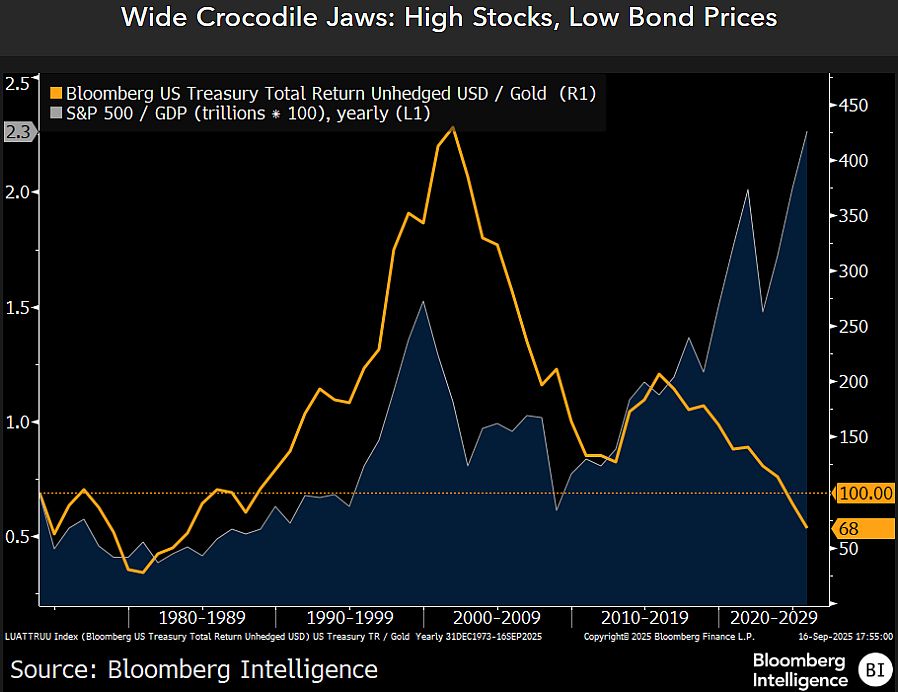
September 17, 2025 at 10:35 AM
Reversion Can Be Profound -- Bonds/Gold vs. Stocks
The lowest US Treasury-note prices since 1983 vs. gold and highest stock-market capitalization-to-GDP in about 100 years are ripe for reversion. A bit of pickup in stock-market volatility in 4Q could be a spark.
The lowest US Treasury-note prices since 1983 vs. gold and highest stock-market capitalization-to-GDP in about 100 years are ripe for reversion. A bit of pickup in stock-market volatility in 4Q could be a spark.
Gold is outperforming the stock market on the eve of the Fed resuming its easing cycle, a dynamic that has in the past signaled recessions. This leads to the question: Why are equities, which typically rise when the central bank cuts rates, going down against gold?

September 16, 2025 at 12:11 PM
Gold is outperforming the stock market on the eve of the Fed resuming its easing cycle, a dynamic that has in the past signaled recessions. This leads to the question: Why are equities, which typically rise when the central bank cuts rates, going down against gold?
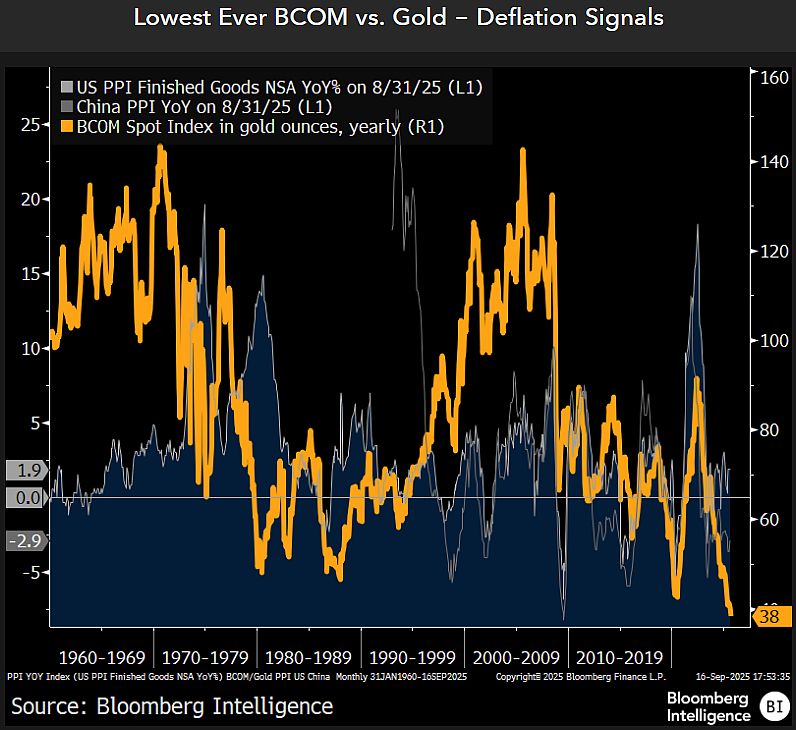
Deflation Often Follows Inflation; Gold May Get It -
The stock market can become the economy when its capitalization increases to over 2x GDP, which may explain why gold's 40% gain in 2025 to Sept. 15 was last matched in 1979.
The stock market can become the economy when its capitalization increases to over 2x GDP, which may explain why gold's 40% gain in 2025 to Sept. 15 was last matched in 1979.

September 16, 2025 at 12:10 PM
Deflation Often Follows Inflation; Gold May Get It -
The stock market can become the economy when its capitalization increases to over 2x GDP, which may explain why gold's 40% gain in 2025 to Sept. 15 was last matched in 1979.
The stock market can become the economy when its capitalization increases to over 2x GDP, which may explain why gold's 40% gain in 2025 to Sept. 15 was last matched in 1979.
Can Leading Indicator Bitcoin-to-Gold Recover in 4Q? It's almost the end of 3Q and despite risk assets on a tear, gold is outperforming almost everything, notably on a risk-adjusted basis. What stops this track, or what might accelerate it?

September 16, 2025 at 12:08 PM
Can Leading Indicator Bitcoin-to-Gold Recover in 4Q? It's almost the end of 3Q and despite risk assets on a tear, gold is outperforming almost everything, notably on a risk-adjusted basis. What stops this track, or what might accelerate it?