

milkroad.com/podcast/what...

milkroad.com/podcast/what...
What was silver resistance around $35 an ounce has likely transitioned to support, with the metal on track to revisit its 2011 peak near $50. A key question from my graphic is: what might disrupt this upward trajectory?

What was silver resistance around $35 an ounce has likely transitioned to support, with the metal on track to revisit its 2011 peak near $50. A key question from my graphic is: what might disrupt this upward trajectory?

Bloomberg's measure of total gold ETF holdings jumped to a three-year high. At 95.8 million ounces on Aug. 19, my graphic shows this metric surpassing the 92 million threshold first reached in 2020, but with a big difference -- stock market volatility was rising then.

Bloomberg's measure of total gold ETF holdings jumped to a three-year high. At 95.8 million ounces on Aug. 19, my graphic shows this metric surpassing the 92 million threshold first reached in 2020, but with a big difference -- stock market volatility was rising then.


Roughly 25 years of platinum trading have created a solid breakout base from the mean, median and mode around $1,000 an ounce. This may now be transitioning toward $2,000, supported by gold's strength.
#platinum #gold #technicalanalysis

Roughly 25 years of platinum trading have created a solid breakout base from the mean, median and mode around $1,000 an ounce. This may now be transitioning toward $2,000, supported by gold's strength.
#platinum #gold #technicalanalysis


#silver

#silver

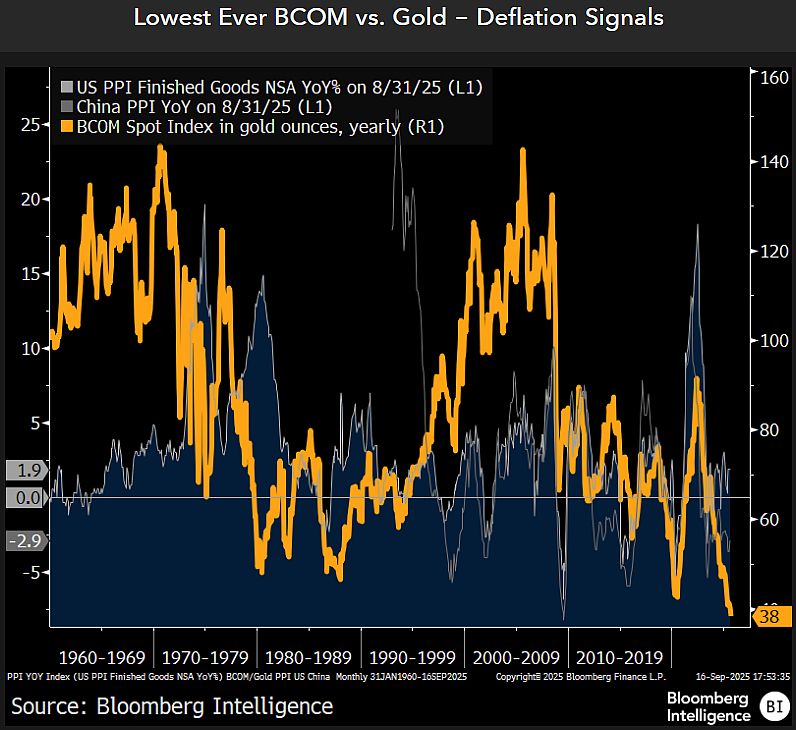
The lowest S&P 500 12-month dividend yield since 2001 may signal reversion risks that outperforming gold is sniffing out. My annual chart shows an ominous rollover pattern in the stock index measured in terms of the metal.

The lowest S&P 500 12-month dividend yield since 2001 may signal reversion risks that outperforming gold is sniffing out. My annual chart shows an ominous rollover pattern in the stock index measured in terms of the metal.
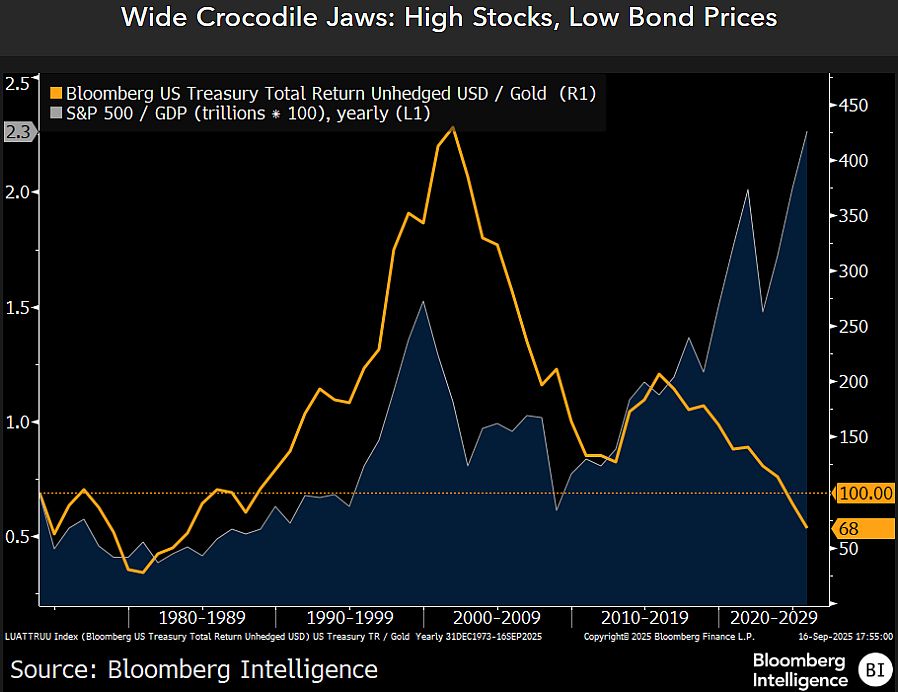
The lowest US Treasury-note prices since 1983 vs. gold and highest stock-market capitalization-to-GDP in about 100 years are ripe for reversion. A bit of pickup in stock-market volatility in 4Q could be a spark.

The lowest US Treasury-note prices since 1983 vs. gold and highest stock-market capitalization-to-GDP in about 100 years are ripe for reversion. A bit of pickup in stock-market volatility in 4Q could be a spark.

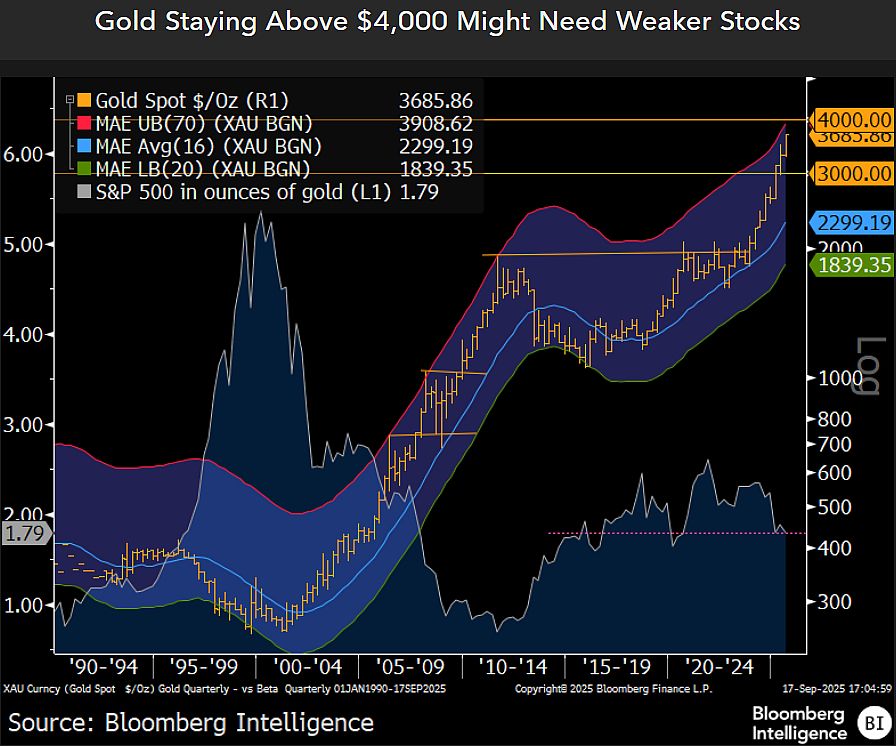
The stock market can become the economy when its capitalization increases to over 2x GDP, which may explain why gold's 40% gain in 2025 to Sept. 15 was last matched in 1979.

The stock market can become the economy when its capitalization increases to over 2x GDP, which may explain why gold's 40% gain in 2025 to Sept. 15 was last matched in 1979.


