


Luisa von Albedyll
@luisavonalbedyll.bsky.social
ESA CCI Research fellow and PostDoc in climate physics at the Alfred Wegener Institute with a focus on sea ice and Earth Observation
Reposted by Luisa von Albedyll

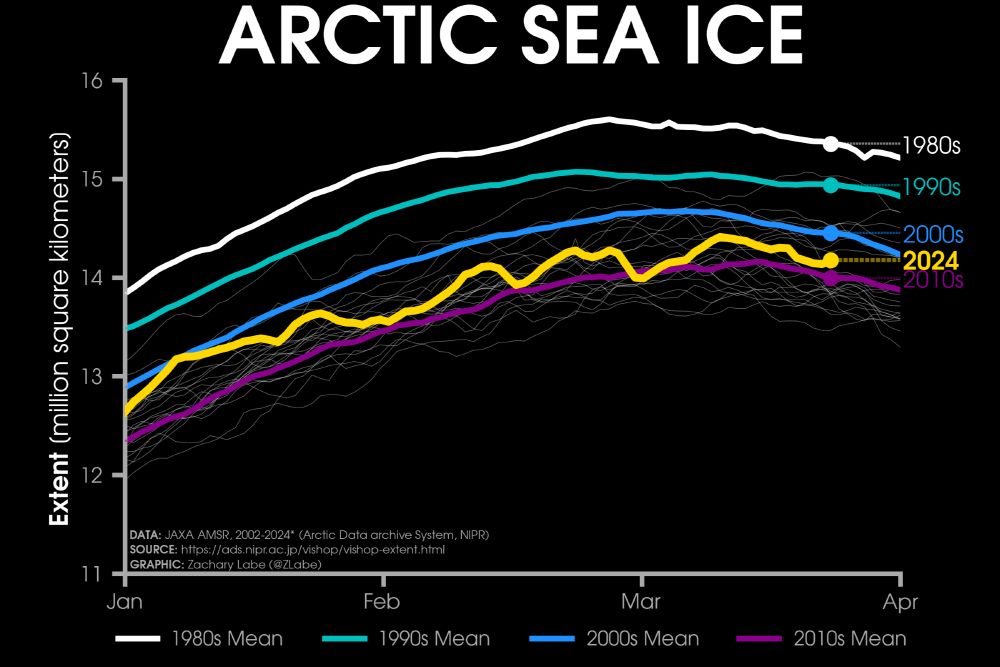
Monday ice update - #Arctic sea ice extent is currently the 15th lowest on record (JAXA data)
• about 180,000 km² above the 2010s mean
• about 280,000 km² below the 2000s mean
• about 760,000 km² below the 1990s mean
• about 1,180,000 km² below the 1980s mean
Plots zacklabe.com/arctic-sea-i... 🧪⚒️
• about 180,000 km² above the 2010s mean
• about 280,000 km² below the 2000s mean
• about 760,000 km² below the 1990s mean
• about 1,180,000 km² below the 1980s mean
Plots zacklabe.com/arctic-sea-i... 🧪⚒️
March 25, 2024 at 1:39 PM
Monday ice update - #Arctic sea ice extent is currently the 15th lowest on record (JAXA data)
• about 180,000 km² above the 2010s mean
• about 280,000 km² below the 2000s mean
• about 760,000 km² below the 1990s mean
• about 1,180,000 km² below the 1980s mean
Plots zacklabe.com/arctic-sea-i... 🧪⚒️
• about 180,000 km² above the 2010s mean
• about 280,000 km² below the 2000s mean
• about 760,000 km² below the 1990s mean
• about 1,180,000 km² below the 1980s mean
Plots zacklabe.com/arctic-sea-i... 🧪⚒️
Reposted by Luisa von Albedyll

📰ESA is developing an #AI bot like #ChatGPT for Earth observation data.
#eo #earthobservation #remotesensing
www.esa.int/Applications...
#eo #earthobservation #remotesensing
www.esa.int/Applications...

Building ChatGPT-style tools with Earth observation
Imagine being able to ask a chatbot, “Can you make me an extremely accurate classification map of crop cultivation in Kenya?” or “Are buildings subsiding in my street?” And imagine that the informatio...
www.esa.int
March 25, 2024 at 4:39 PM
📰ESA is developing an #AI bot like #ChatGPT for Earth observation data.
#eo #earthobservation #remotesensing
www.esa.int/Applications...
#eo #earthobservation #remotesensing
www.esa.int/Applications...
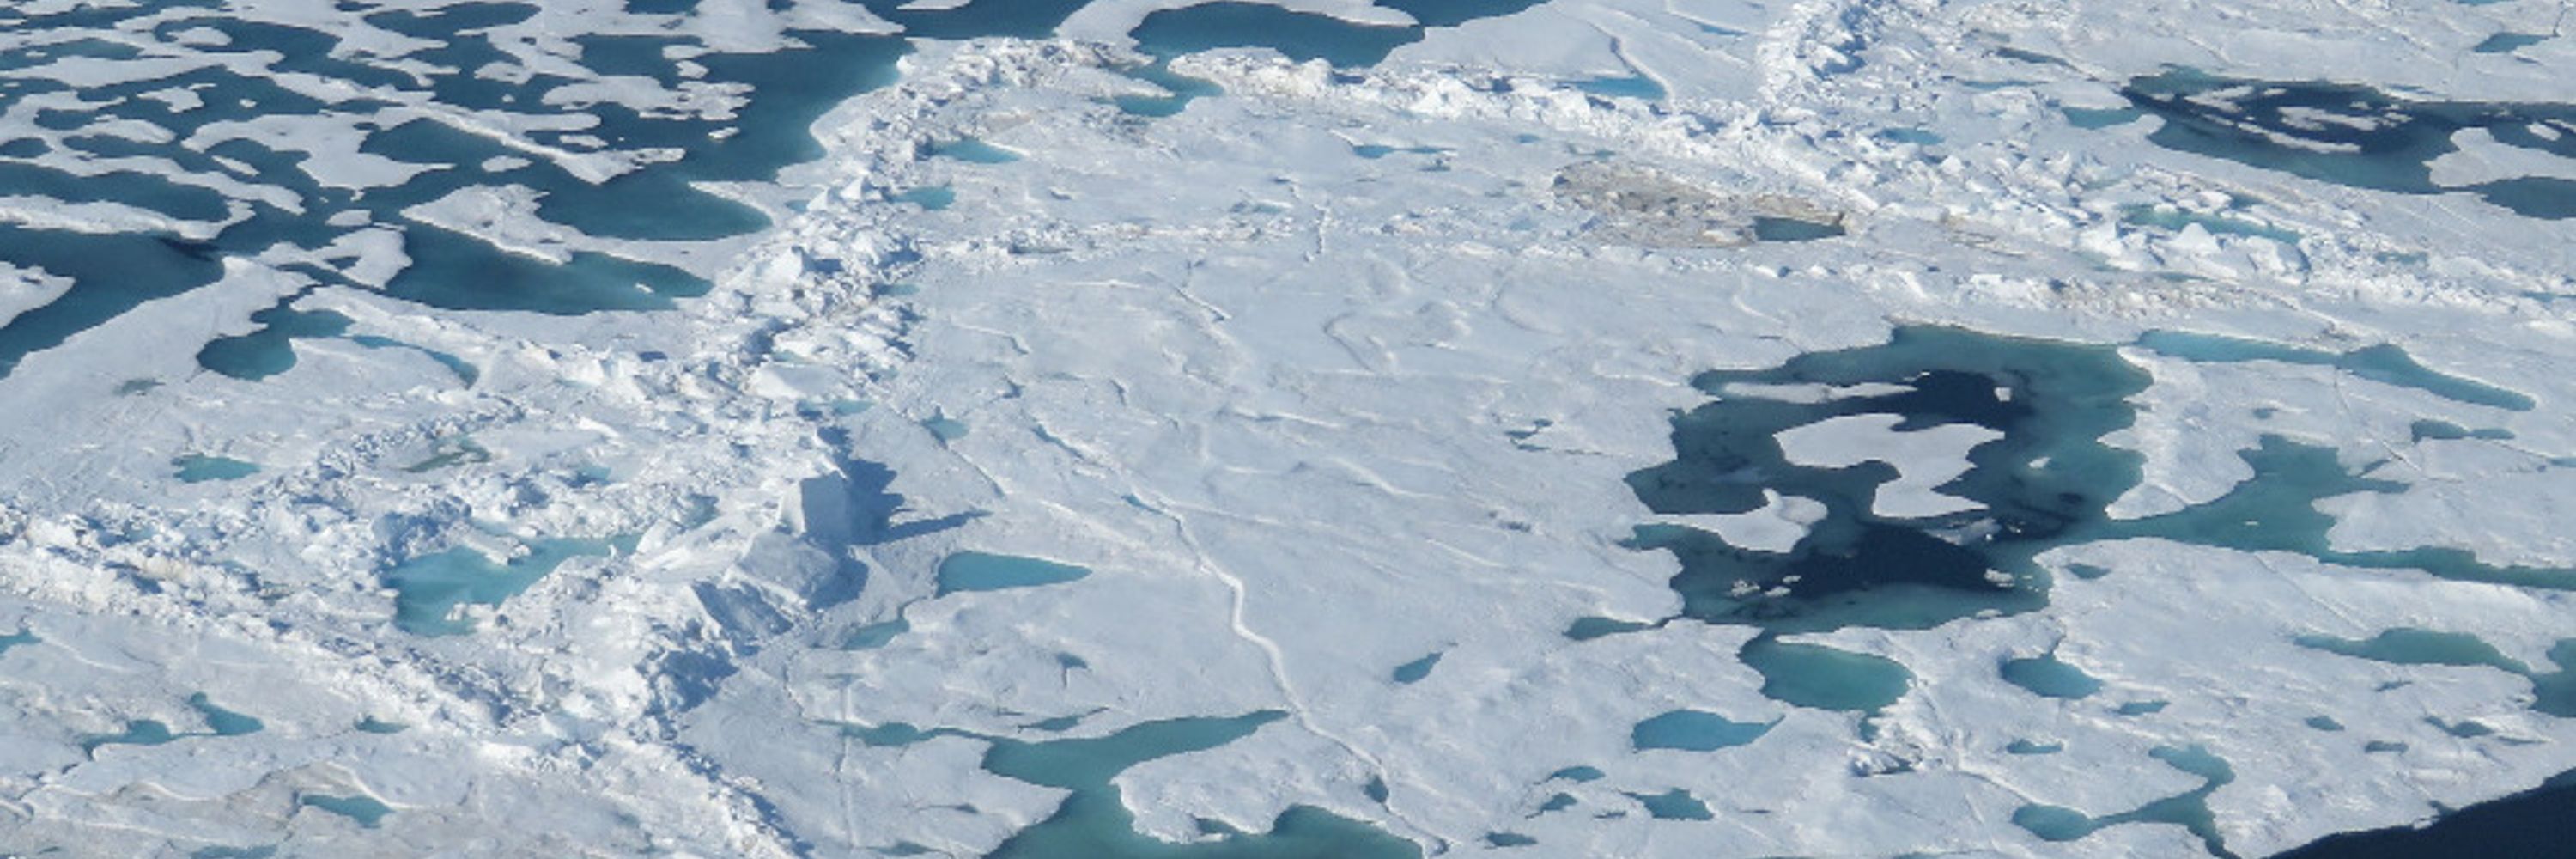
🌊❄️ 💔Curious about wintertime leads in the Arctic sea ice?
➡️ Sea ice dynamics can tell you much more!
🛰️ We have used divergence derived from SAR satellite data to study the presence and formation history of leads.
Where-when-how wide are leads?
Read more here: tc.copernicus.org/articles/18/...
➡️ Sea ice dynamics can tell you much more!
🛰️ We have used divergence derived from SAR satellite data to study the presence and formation history of leads.
Where-when-how wide are leads?
Read more here: tc.copernicus.org/articles/18/...
March 19, 2024 at 4:05 PM
🌊❄️ 💔Curious about wintertime leads in the Arctic sea ice?
➡️ Sea ice dynamics can tell you much more!
🛰️ We have used divergence derived from SAR satellite data to study the presence and formation history of leads.
Where-when-how wide are leads?
Read more here: tc.copernicus.org/articles/18/...
➡️ Sea ice dynamics can tell you much more!
🛰️ We have used divergence derived from SAR satellite data to study the presence and formation history of leads.
Where-when-how wide are leads?
Read more here: tc.copernicus.org/articles/18/...
Reposted by Luisa von Albedyll
Under the hypothesis that water vapor transport links the sea ice🔛cloud's complex interaction, we found "Asymmetries in cloud microphysical properties ascribed to sea ice leads… in the central Arctic" #MOSAiC #expedition #polar #atmospheric #science #leipzig #AC3 acp.copernicus.org/articles/23/...
November 27, 2023 at 6:12 PM
Under the hypothesis that water vapor transport links the sea ice🔛cloud's complex interaction, we found "Asymmetries in cloud microphysical properties ascribed to sea ice leads… in the central Arctic" #MOSAiC #expedition #polar #atmospheric #science #leipzig #AC3 acp.copernicus.org/articles/23/...
Reposted by Luisa von Albedyll
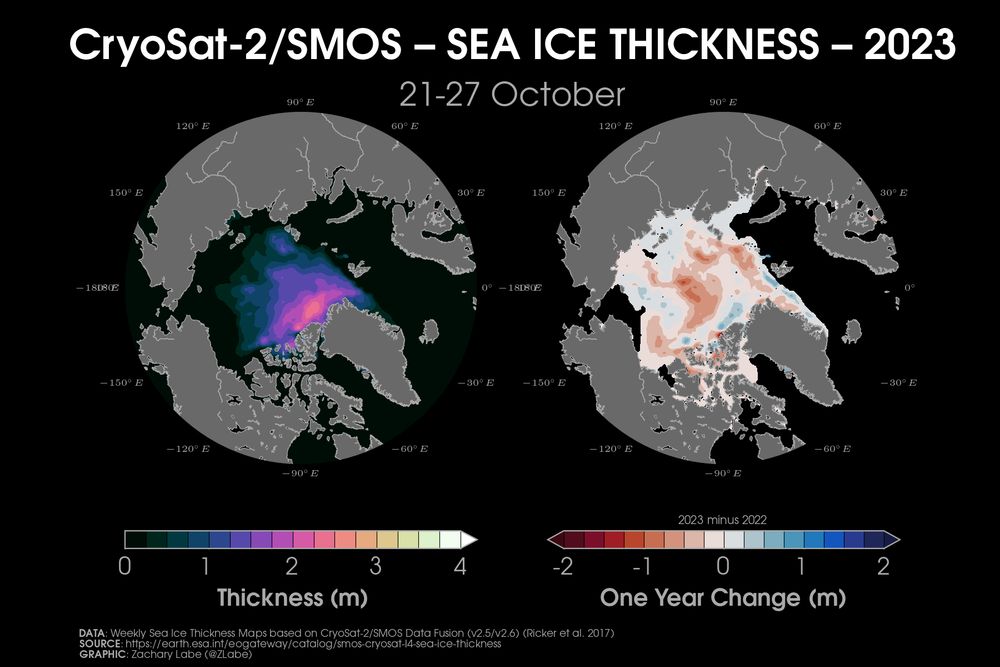
A first look at the CryoSat-2/SMOS merged product for Arctic sea ice thickness this fall - sea ice is thinner than last year across most of the ice pack
This graphic will now be updated weekly at zacklabe.com/arctic-sea-i...
This graphic will now be updated weekly at zacklabe.com/arctic-sea-i...
October 29, 2023 at 7:12 PM
A first look at the CryoSat-2/SMOS merged product for Arctic sea ice thickness this fall - sea ice is thinner than last year across most of the ice pack
This graphic will now be updated weekly at zacklabe.com/arctic-sea-i...
This graphic will now be updated weekly at zacklabe.com/arctic-sea-i...
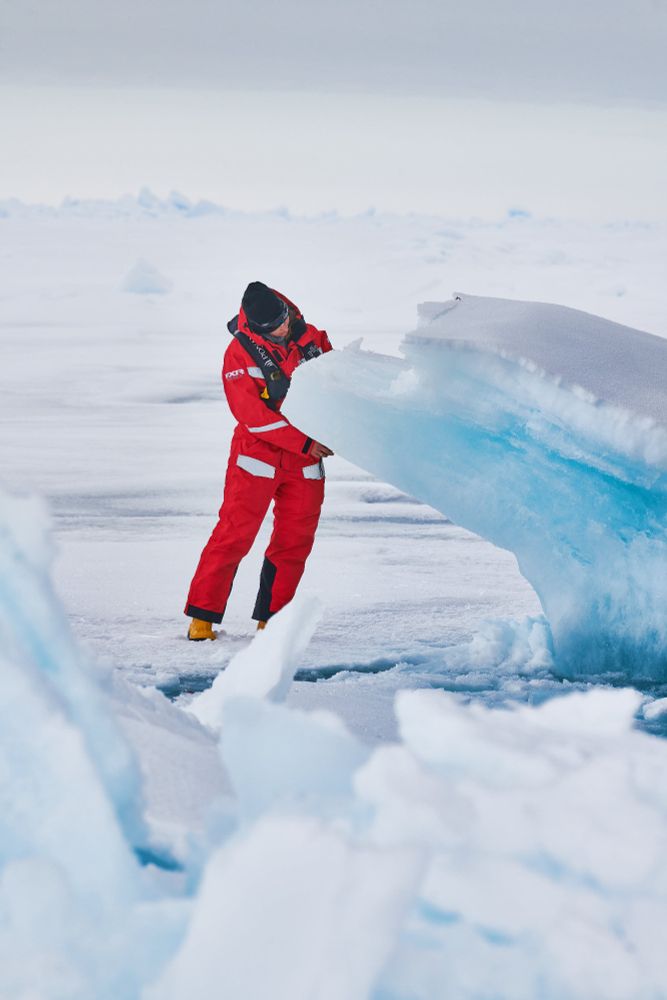
Hi Bluesky community 👋 - I am happy to have joined you :) Looking forward to connecting with fellow 🧊Cryosphere and 🛰️ Earth Observation Enthusiasts and Science Communicators! Can't wait to share my work, images, ideas, and passion for the ice with you all.
Picture: Mike Louagie
Picture: Mike Louagie
October 23, 2023 at 7:51 AM
Hi Bluesky community 👋 - I am happy to have joined you :) Looking forward to connecting with fellow 🧊Cryosphere and 🛰️ Earth Observation Enthusiasts and Science Communicators! Can't wait to share my work, images, ideas, and passion for the ice with you all.
Picture: Mike Louagie
Picture: Mike Louagie