


Julian Hoffmann Anton
@julianhoffmann.bsky.social
Spatial Data Scientist • Artist • Economist | #ClimateRisk #Dataviz #Maps #DigitalArt #3D in London | X: Julian_H0ffmann
Portfolio: https://www.julian-hoffmann-anton.com/
Portfolio: https://www.julian-hoffmann-anton.com/
Pinned
The Geology of the Moon | Lunalogy
A concept visualization highlighting a wide variety of geological features on our celestial neighbor. Created for the #30DayMapChallenge - Space and Time. Made in Blender, some #rstats, Illustrator & DaVinci Resolve. #GIS
A concept visualization highlighting a wide variety of geological features on our celestial neighbor. Created for the #30DayMapChallenge - Space and Time. Made in Blender, some #rstats, Illustrator & DaVinci Resolve. #GIS
Reposted by Julian Hoffmann Anton

Classic isotype infographic from the 1940s
(note: some data is now considered inaccurate. So here's an updated 'modern' version from Encyclopedia Brittanica. infographic.tv/data-visuali...)
(note: some data is now considered inaccurate. So here's an updated 'modern' version from Encyclopedia Brittanica. infographic.tv/data-visuali...)

December 2, 2025 at 5:55 PM
Classic isotype infographic from the 1940s
(note: some data is now considered inaccurate. So here's an updated 'modern' version from Encyclopedia Brittanica. infographic.tv/data-visuali...)
(note: some data is now considered inaccurate. So here's an updated 'modern' version from Encyclopedia Brittanica. infographic.tv/data-visuali...)

December 3, 2025 at 4:09 PM
Bathymetry visualisation. Work in progress #30DayMapChallenge - Water #b3d - late but many things in the pipeline :)

November 12, 2025 at 11:11 AM
Bathymetry visualisation. Work in progress #30DayMapChallenge - Water #b3d - late but many things in the pipeline :)
1854 Cholera Outbreak in modern-day Soho, London. #30DayMapChallenge - Day 1 - Points.
You probably know Snow's foundational 2D map from GIS/Epidemiology class. Maybe you've walked past the landmark pump. I brought it back into present-day Soho.
You probably know Snow's foundational 2D map from GIS/Epidemiology class. Maybe you've walked past the landmark pump. I brought it back into present-day Soho.

November 3, 2025 at 9:37 AM
1854 Cholera Outbreak in modern-day Soho, London. #30DayMapChallenge - Day 1 - Points.
You probably know Snow's foundational 2D map from GIS/Epidemiology class. Maybe you've walked past the landmark pump. I brought it back into present-day Soho.
You probably know Snow's foundational 2D map from GIS/Epidemiology class. Maybe you've walked past the landmark pump. I brought it back into present-day Soho.
The #30DayMapChallenge 2025 begins soon, the categories are out! Completing all 30 maps is not the objective, just create a few. Here is a selection from the ones I made last year!


October 28, 2025 at 11:45 AM
The #30DayMapChallenge 2025 begins soon, the categories are out! Completing all 30 maps is not the objective, just create a few. Here is a selection from the ones I made last year!
3D map dream project alert!!

This has been in the making for a while, and it's coming soon:
An interactive 3D viewer for my virtual reconstruction of Tenochtitlan, right in your browser.
More details to follow. Stay tuned!
#tenochtitlan #blender #threejs
An interactive 3D viewer for my virtual reconstruction of Tenochtitlan, right in your browser.
More details to follow. Stay tuned!
#tenochtitlan #blender #threejs
October 6, 2025 at 9:25 AM
3D map dream project alert!!


Reposted by Julian Hoffmann Anton
March 26, 2025 at 9:03 AM


fantastic project/data/idea!
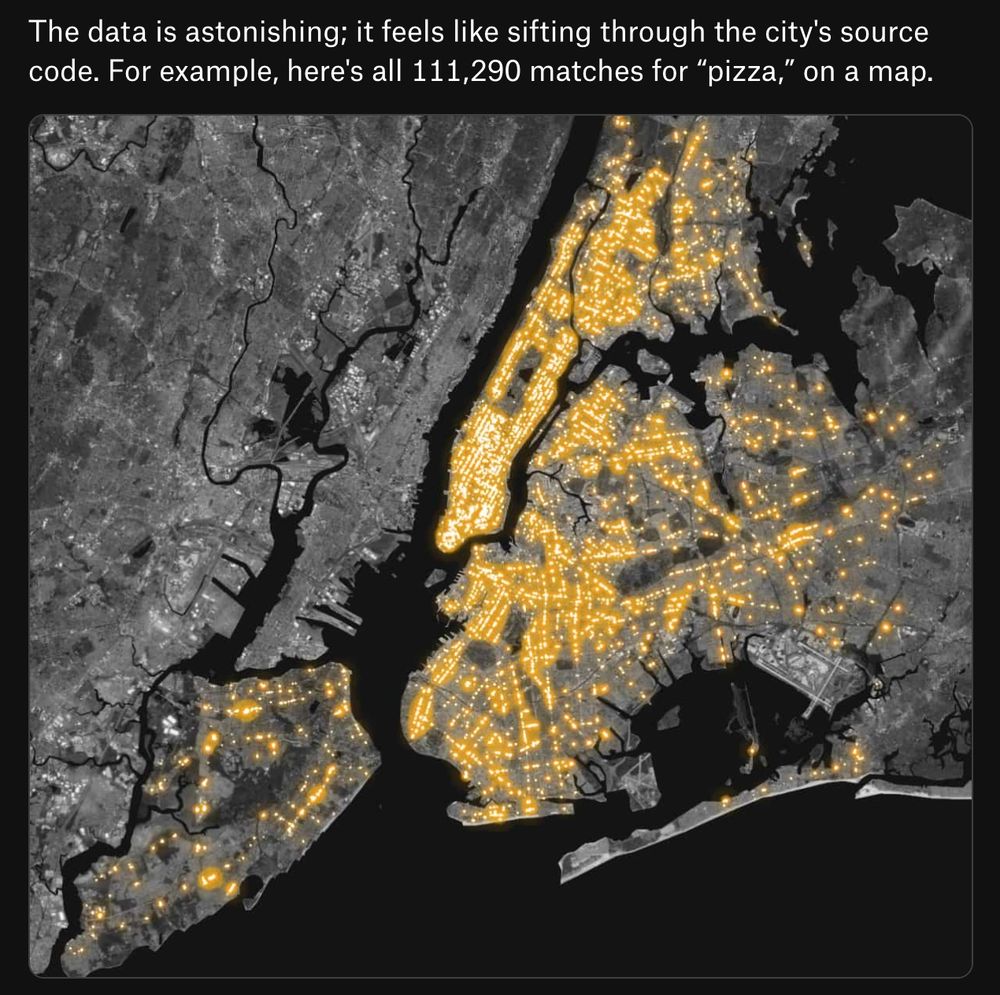
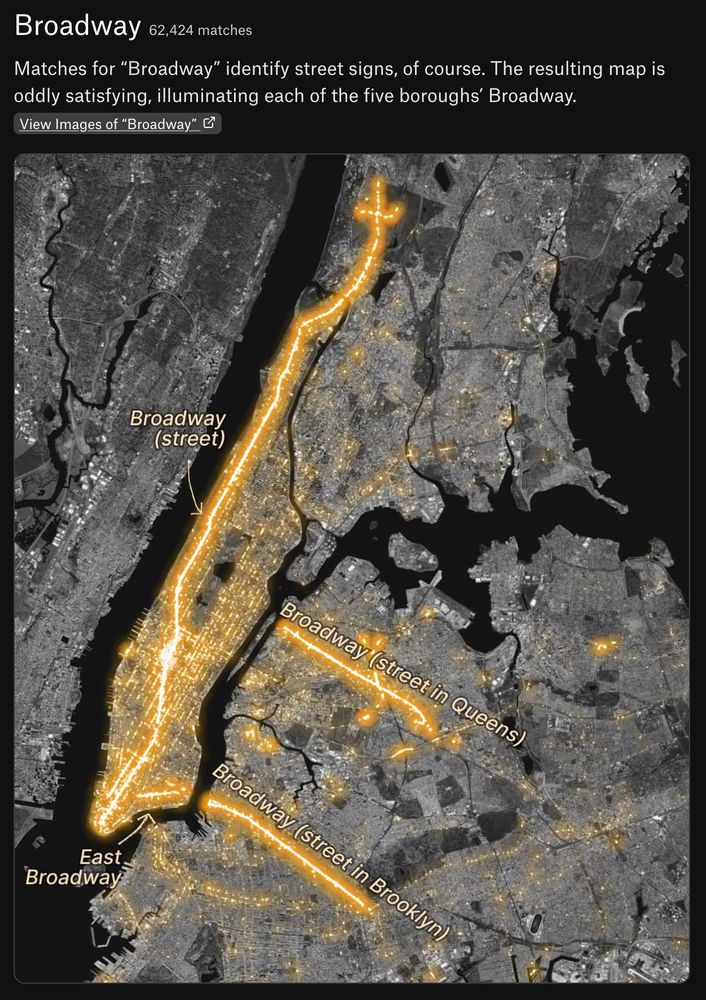
Love these maps of "street-text sightings" in the Pudding's latest piece
pudding.cool/2025/07/stre...
pudding.cool/2025/07/stre...
July 28, 2025 at 3:25 PM
fantastic project/data/idea!
Reposted by Julian Hoffmann Anton

A mesmerizing time-lapse of the Sun in ultraviolet light, captured by the Solar Dynamics Observatory spacecraft over a month.
-Credits: NASA
-Credits: NASA
July 27, 2025 at 4:05 PM
A mesmerizing time-lapse of the Sun in ultraviolet light, captured by the Solar Dynamics Observatory spacecraft over a month.
-Credits: NASA
-Credits: NASA

Reposted by Julian Hoffmann Anton
“The Batmap” | An experiment with New York City data. #Day26 of sharing work-in-progress. A playful twist on “the bad map” that inspired this cinematic rendering, created in #Blender3D with Google 3D Map Tiles from late 2023. #batman
May 13, 2025 at 9:59 AM
“The Batmap” | An experiment with New York City data. #Day26 of sharing work-in-progress. A playful twist on “the bad map” that inspired this cinematic rendering, created in #Blender3D with Google 3D Map Tiles from late 2023. #batman
Reposted by Julian Hoffmann Anton

One of my favourite data discoveries this year: Google's mind-blowing ARCO-ERA5 dataset: hourly data for ~300 climate variables, available globally from 1940! 🤯
Loadable with a single line of Python code from a single cloud-friendly Zarr file! Below: a month of wind waves + swell: 🌊
Loadable with a single line of Python code from a single cloud-friendly Zarr file! Below: a month of wind waves + swell: 🌊
November 27, 2024 at 4:02 AM
One of my favourite data discoveries this year: Google's mind-blowing ARCO-ERA5 dataset: hourly data for ~300 climate variables, available globally from 1940! 🤯
Loadable with a single line of Python code from a single cloud-friendly Zarr file! Below: a month of wind waves + swell: 🌊
Loadable with a single line of Python code from a single cloud-friendly Zarr file! Below: a month of wind waves + swell: 🌊
Reposted by Julian Hoffmann Anton

Charts that will be studied by historians, an occasional series


May 20, 2025 at 5:23 PM
Charts that will be studied by historians, an occasional series
Reposted by Julian Hoffmann Anton
Sea Surface Wind: January 10-12th 2025. Exploring innovative ways to display climate data of our beautiful planet. Globe & map visualisation made for @copernicusmarine.bsky.social #Day22 of sharing work in progress 🌍 🔊 #b3d
April 29, 2025 at 9:37 AM
Sea Surface Wind: January 10-12th 2025. Exploring innovative ways to display climate data of our beautiful planet. Globe & map visualisation made for @copernicusmarine.bsky.social #Day22 of sharing work in progress 🌍 🔊 #b3d
“The Batmap” | An experiment with New York City data. #Day26 of sharing work-in-progress. A playful twist on “the bad map” that inspired this cinematic rendering, created in #Blender3D with Google 3D Map Tiles from late 2023. #batman
May 13, 2025 at 9:59 AM
“The Batmap” | An experiment with New York City data. #Day26 of sharing work-in-progress. A playful twist on “the bad map” that inspired this cinematic rendering, created in #Blender3D with Google 3D Map Tiles from late 2023. #batman
Reposted by Julian Hoffmann Anton

This map shows the hour of sunrise globally through the year. It reveals time zones following national and, sometimes, regional boundaries, and slicing through the oceans.
May 12, 2025 at 1:25 PM
This map shows the hour of sunrise globally through the year. It reveals time zones following national and, sometimes, regional boundaries, and slicing through the oceans.