


Chen-Chia Ku, Ph.D
@jjakon11.bsky.social
Forest ecologist focused on the biomass change and ecological processes in the forest. I love doing data visualization, taking some photography, and using #rstats a lot.
Forest ecology | Taiwan | #ggplot2 | he/him 🏳️🌈
https://www.chenchiaku.com
Forest ecology | Taiwan | #ggplot2 | he/him 🏳️🌈
https://www.chenchiaku.com
We published! I am very excited to share this story. Our study shows that Taxus mortality is not caused by competition. Many deaths began with mechanical damage from fallen trees more than a decade ago, starting a long decline that led to recent mortality.
Ku and Lutz (2025) doi.org/10.1186/s137...
Ku and Lutz (2025) doi.org/10.1186/s137...

Death and Taxus: the contribution of mechanical damage to the multiple factors associated with Taxus brevifolia mortality - Ecological Processes
Background Recent increases in tree mortality are often attributed to climate, but climate extremes may just be the last of many stressors that have unfolded over many years resulting in tree death. P...
doi.org
November 14, 2025 at 1:02 AM
We published! I am very excited to share this story. Our study shows that Taxus mortality is not caused by competition. Many deaths began with mechanical damage from fallen trees more than a decade ago, starting a long decline that led to recent mortality.
Ku and Lutz (2025) doi.org/10.1186/s137...
Ku and Lutz (2025) doi.org/10.1186/s137...
Reposted by Chen-Chia Ku, Ph.D

Always a pleasure to see others recognize the value of our network.
"[The LTER Network] has enabled scientists to get answers that have led to key policy decisions, from amending the Clean Air Act to prevent acid rain to preserving old-growth forests."
Lynda Mapes for the @seattletimes.com
"[The LTER Network] has enabled scientists to get answers that have led to key policy decisions, from amending the Clean Air Act to prevent acid rain to preserving old-growth forests."
Lynda Mapes for the @seattletimes.com

Trump wants to cut research centers like the one in this PNW forest
Congress will take up Trump's proposed budget cuts, which target 26 long-term ecological research centers like the H.J. Andrews Experimental Forest in Oregon.
www.seattletimes.com
July 10, 2025 at 9:39 PM
Always a pleasure to see others recognize the value of our network.
"[The LTER Network] has enabled scientists to get answers that have led to key policy decisions, from amending the Clean Air Act to prevent acid rain to preserving old-growth forests."
Lynda Mapes for the @seattletimes.com
"[The LTER Network] has enabled scientists to get answers that have led to key policy decisions, from amending the Clean Air Act to prevent acid rain to preserving old-growth forests."
Lynda Mapes for the @seattletimes.com
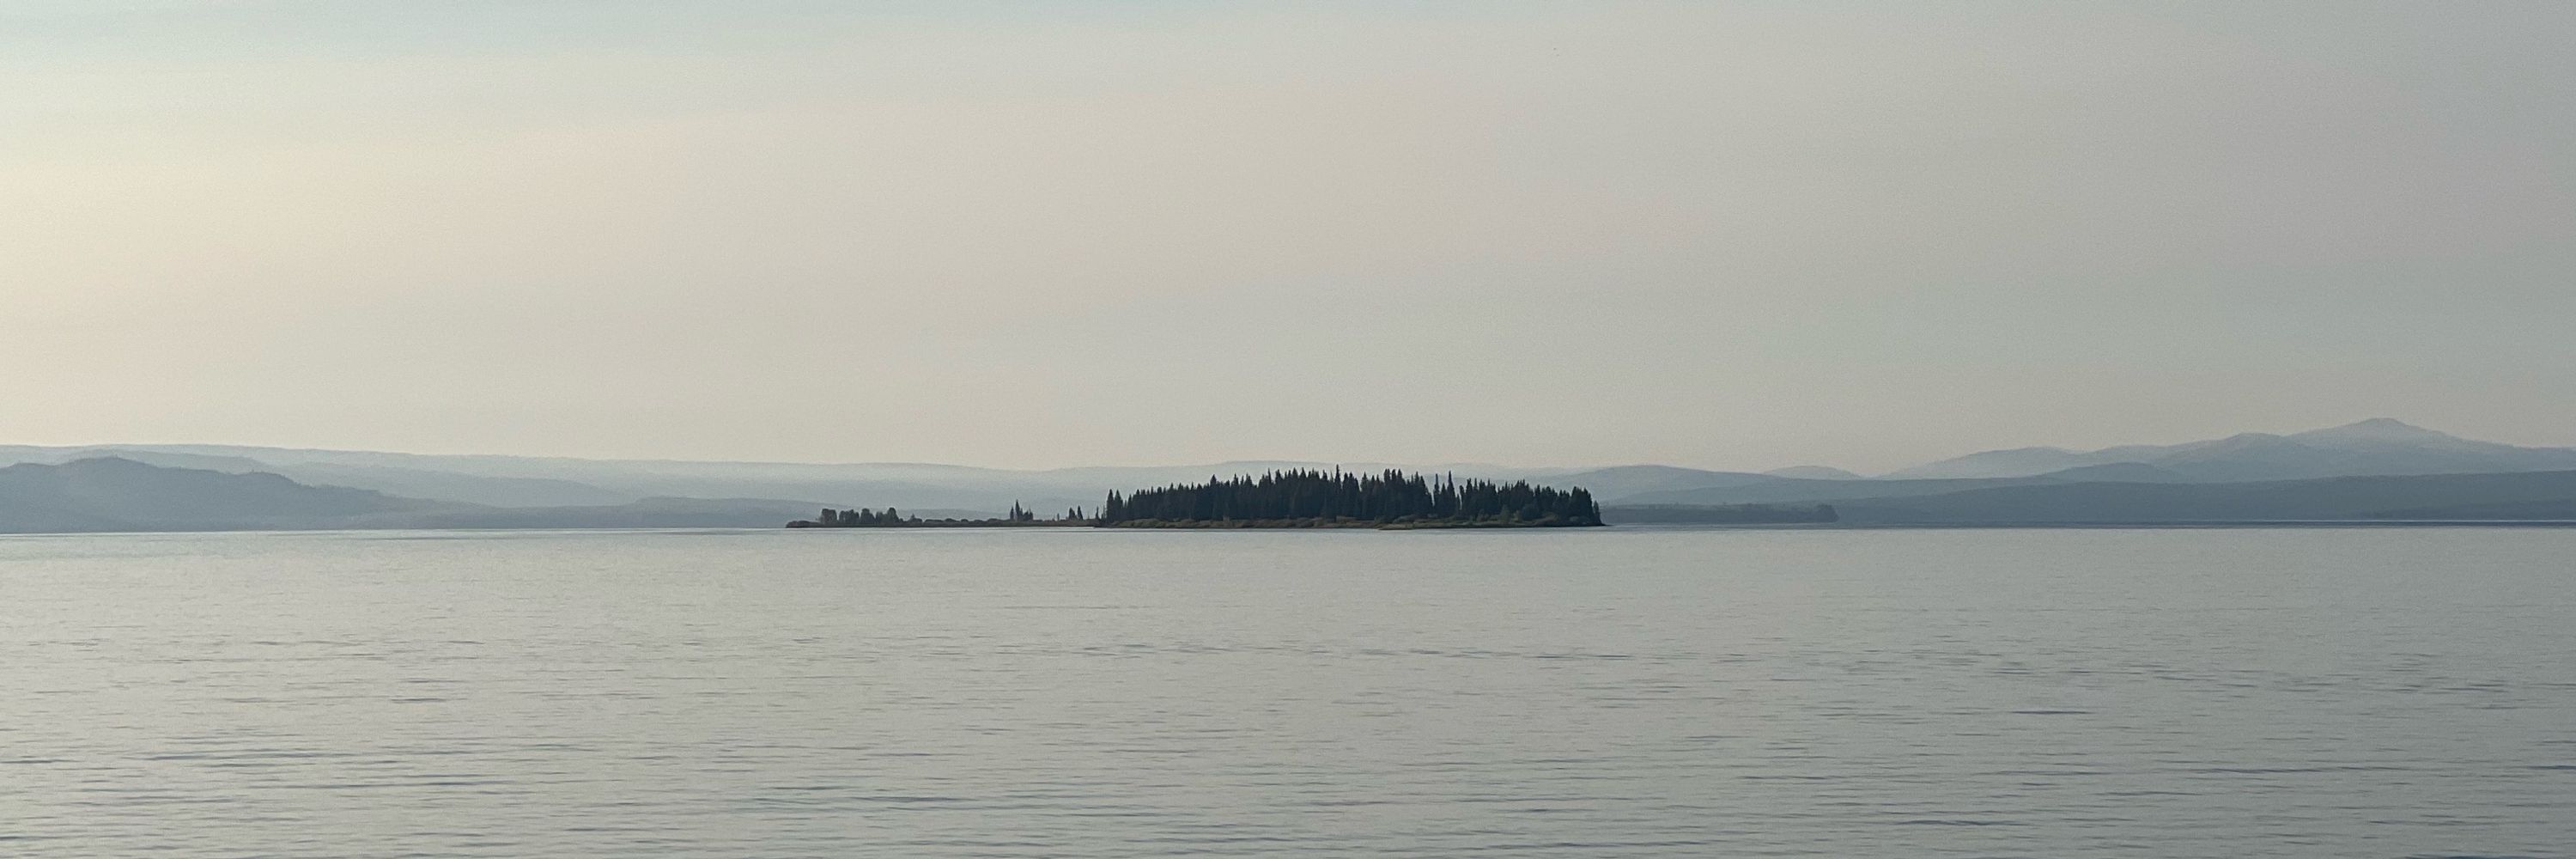
The big western hemlock at Cedar flat, WA, USA

July 16, 2025 at 2:18 AM
The big western hemlock at Cedar flat, WA, USA
Reposted by Chen-Chia Ku, Ph.D

India said early Wednesday that it had conducted several airstrikes on Pakistan after 26 civilians were killed in a terrorist attack in Kashmir. But evidence is growing that the Indian forces may have taken heavy losses during the operation. nyti.ms/4dbIwei
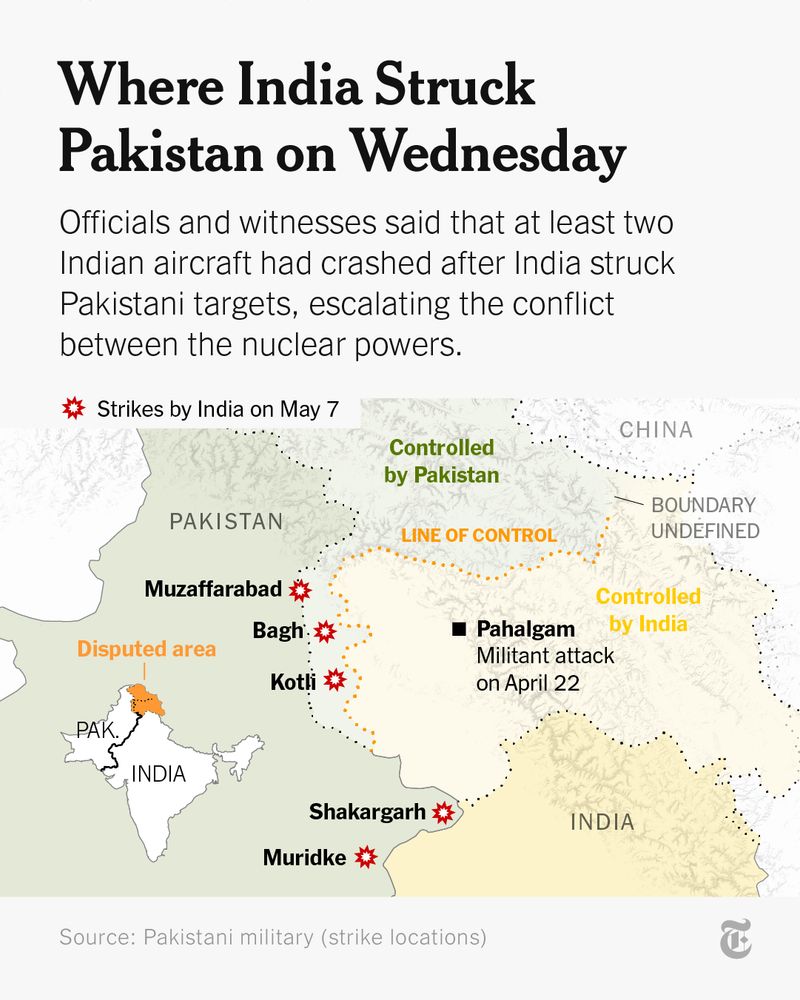
May 7, 2025 at 6:34 PM
India said early Wednesday that it had conducted several airstrikes on Pakistan after 26 civilians were killed in a terrorist attack in Kashmir. But evidence is growing that the Indian forces may have taken heavy losses during the operation. nyti.ms/4dbIwei
TERN X LTSER 2025
A tree height research presentation @ TERN
A tree height research presentation @ TERN
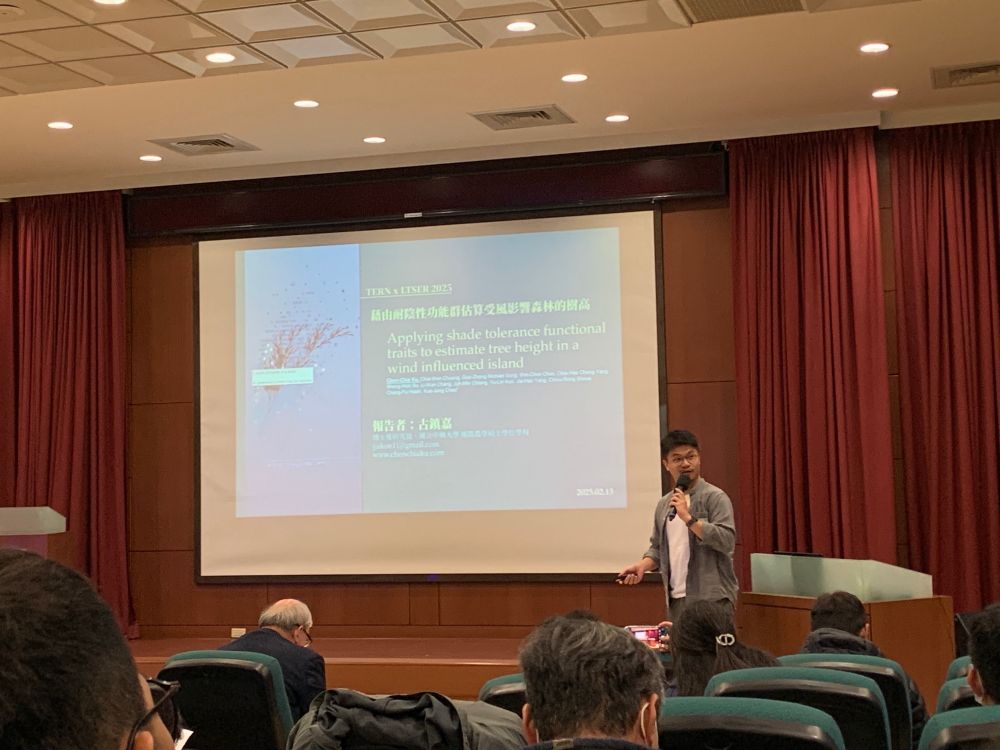

February 14, 2025 at 4:30 AM
TERN X LTSER 2025
A tree height research presentation @ TERN
A tree height research presentation @ TERN
Reposted by Chen-Chia Ku, Ph.D

New #lidar images of the #Enchantments for the Washington Geological Survey. #PNW #Maps #CascadeRange


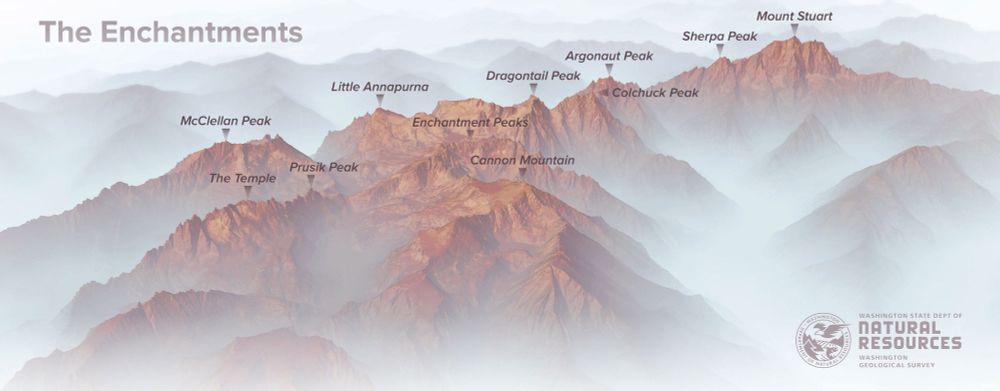
December 8, 2024 at 12:58 AM
New #lidar images of the #Enchantments for the Washington Geological Survey. #PNW #Maps #CascadeRange
No forest, no map but Happy Lunar New Year today!

January 29, 2025 at 1:05 PM
No forest, no map but Happy Lunar New Year today!
Doing the mortality survey in tropical monsoon forest at Nanjenshan, Taiwan.

January 18, 2025 at 3:03 PM
Doing the mortality survey in tropical monsoon forest at Nanjenshan, Taiwan.
See you next year! I am going back to my warm country.

November 14, 2024 at 1:18 AM
See you next year! I am going back to my warm country.
#30DayMapChallenge
#Day12_Time_and_Space
Taiwan's 30-Year Average Temperature and Precipitation Pattern
This map, inspired by @tterence.bsky.social, uses climate data from Climate AP to illustrate Taiwan's 30-year distribution of temperature and precipitation.
Inspired by: @tterence.bsky.social
#Day12_Time_and_Space
Taiwan's 30-Year Average Temperature and Precipitation Pattern
This map, inspired by @tterence.bsky.social, uses climate data from Climate AP to illustrate Taiwan's 30-year distribution of temperature and precipitation.
Inspired by: @tterence.bsky.social

November 12, 2024 at 9:15 PM
#30DayMapChallenge
#Day12_Time_and_Space
Taiwan's 30-Year Average Temperature and Precipitation Pattern
This map, inspired by @tterence.bsky.social, uses climate data from Climate AP to illustrate Taiwan's 30-year distribution of temperature and precipitation.
Inspired by: @tterence.bsky.social
#Day12_Time_and_Space
Taiwan's 30-Year Average Temperature and Precipitation Pattern
This map, inspired by @tterence.bsky.social, uses climate data from Climate AP to illustrate Taiwan's 30-year distribution of temperature and precipitation.
Inspired by: @tterence.bsky.social
#30DayMapChallenge
#Day11_Arctic
Arctic
I used Arctic ocean DEM data to sneak in some marine DEM, mapping out the land areas. By stacking the same dataset three times, I was able to highlight the ocean, flat area, and mountainous regions.
#rstats
#Day11_Arctic
Arctic
I used Arctic ocean DEM data to sneak in some marine DEM, mapping out the land areas. By stacking the same dataset three times, I was able to highlight the ocean, flat area, and mountainous regions.
#rstats

November 12, 2024 at 2:16 AM
#30DayMapChallenge
#Day11_Arctic
Arctic
I used Arctic ocean DEM data to sneak in some marine DEM, mapping out the land areas. By stacking the same dataset three times, I was able to highlight the ocean, flat area, and mountainous regions.
#rstats
#Day11_Arctic
Arctic
I used Arctic ocean DEM data to sneak in some marine DEM, mapping out the land areas. By stacking the same dataset three times, I was able to highlight the ocean, flat area, and mountainous regions.
#rstats
Oh gosh man! How did you do that?

November 11, 2024 at 4:24 PM
Oh gosh man! How did you do that?
#30DayMapChallenge
#Day10_Pen_and_Paper
Mudouyu Lighthouse
Having not sketched in years, I simply created a basic map of Mudou Island in Penghu, Taiwan.
Inspired by: my photo
#Day10_Pen_and_Paper
Mudouyu Lighthouse
Having not sketched in years, I simply created a basic map of Mudou Island in Penghu, Taiwan.
Inspired by: my photo

November 10, 2024 at 11:26 PM
#30DayMapChallenge
#Day10_Pen_and_Paper
Mudouyu Lighthouse
Having not sketched in years, I simply created a basic map of Mudou Island in Penghu, Taiwan.
Inspired by: my photo
#Day10_Pen_and_Paper
Mudouyu Lighthouse
Having not sketched in years, I simply created a basic map of Mudou Island in Penghu, Taiwan.
Inspired by: my photo
#30DayMapChallenge
#Day9_AI_only
AI generate a vintage map of Taiwan-Not Always Right.
A dumpster AI! I'd rather write the code myself. If any information is incorrect, that's not on me!
Inspired by: Me
no code today
#Day9_AI_only
AI generate a vintage map of Taiwan-Not Always Right.
A dumpster AI! I'd rather write the code myself. If any information is incorrect, that's not on me!
Inspired by: Me
no code today

November 10, 2024 at 5:53 AM
#30DayMapChallenge
#Day9_AI_only
AI generate a vintage map of Taiwan-Not Always Right.
A dumpster AI! I'd rather write the code myself. If any information is incorrect, that's not on me!
Inspired by: Me
no code today
#Day9_AI_only
AI generate a vintage map of Taiwan-Not Always Right.
A dumpster AI! I'd rather write the code myself. If any information is incorrect, that's not on me!
Inspired by: Me
no code today
#30DayMapChallenge
#Day8_Data_HDX
Earthquake in Taiwan
I used earthquake data from 1990 to 2024, combined with land and ocean DEM, to illustrate how these mountains were uplifted by thousands times of plates collisions.
Inspired by: @tterence.bsky.social
#Day8_Data_HDX
Earthquake in Taiwan
I used earthquake data from 1990 to 2024, combined with land and ocean DEM, to illustrate how these mountains were uplifted by thousands times of plates collisions.
Inspired by: @tterence.bsky.social

November 9, 2024 at 1:45 AM
#30DayMapChallenge
#Day8_Data_HDX
Earthquake in Taiwan
I used earthquake data from 1990 to 2024, combined with land and ocean DEM, to illustrate how these mountains were uplifted by thousands times of plates collisions.
Inspired by: @tterence.bsky.social
#Day8_Data_HDX
Earthquake in Taiwan
I used earthquake data from 1990 to 2024, combined with land and ocean DEM, to illustrate how these mountains were uplifted by thousands times of plates collisions.
Inspired by: @tterence.bsky.social
#30DayMapChallenge
#Day7_VintageStyle
HET EYLAND FORMOSA
Today, I used a digital elevation model (DEM) to create a 2024 rendition inspired by Francois Valentijn's 1726 map of Formosa. Using modern data and techniques, I aimed to reimagine the map, not replicate it exactly.
#rstats
#Day7_VintageStyle
HET EYLAND FORMOSA
Today, I used a digital elevation model (DEM) to create a 2024 rendition inspired by Francois Valentijn's 1726 map of Formosa. Using modern data and techniques, I aimed to reimagine the map, not replicate it exactly.
#rstats

November 8, 2024 at 6:51 AM
#30DayMapChallenge
#Day7_VintageStyle
HET EYLAND FORMOSA
Today, I used a digital elevation model (DEM) to create a 2024 rendition inspired by Francois Valentijn's 1726 map of Formosa. Using modern data and techniques, I aimed to reimagine the map, not replicate it exactly.
#rstats
#Day7_VintageStyle
HET EYLAND FORMOSA
Today, I used a digital elevation model (DEM) to create a 2024 rendition inspired by Francois Valentijn's 1726 map of Formosa. Using modern data and techniques, I aimed to reimagine the map, not replicate it exactly.
#rstats
#30DayMapChallenge
#Day6_Raster
Forest Coverage in Taiwan
Taiwan is an island with 60.7% of its land covered by forests. I used forest coverage data, island DEM, and ocean DEM to create a map showcasing Taiwan as a lush and beautiful 'Formosa' island.
Inspired by @shinagawajp.bsky.social
#Day6_Raster
Forest Coverage in Taiwan
Taiwan is an island with 60.7% of its land covered by forests. I used forest coverage data, island DEM, and ocean DEM to create a map showcasing Taiwan as a lush and beautiful 'Formosa' island.
Inspired by @shinagawajp.bsky.social

November 6, 2024 at 10:21 PM
#30DayMapChallenge
#Day6_Raster
Forest Coverage in Taiwan
Taiwan is an island with 60.7% of its land covered by forests. I used forest coverage data, island DEM, and ocean DEM to create a map showcasing Taiwan as a lush and beautiful 'Formosa' island.
Inspired by @shinagawajp.bsky.social
#Day6_Raster
Forest Coverage in Taiwan
Taiwan is an island with 60.7% of its land covered by forests. I used forest coverage data, island DEM, and ocean DEM to create a map showcasing Taiwan as a lush and beautiful 'Formosa' island.
Inspired by @shinagawajp.bsky.social
#30DayMapChallenge
#Day5_A_Journey
My Summer Road Trip in USA
I mapped my summer road trip across the United States this year, which included a field survey and travel. The breathtaking landscapes are now unforgettable memories. I will treasure it.
Inspired by @andrew.heiss.phd
#Day5_A_Journey
My Summer Road Trip in USA
I mapped my summer road trip across the United States this year, which included a field survey and travel. The breathtaking landscapes are now unforgettable memories. I will treasure it.
Inspired by @andrew.heiss.phd

November 5, 2024 at 10:40 PM
#30DayMapChallenge
#Day5_A_Journey
My Summer Road Trip in USA
I mapped my summer road trip across the United States this year, which included a field survey and travel. The breathtaking landscapes are now unforgettable memories. I will treasure it.
Inspired by @andrew.heiss.phd
#Day5_A_Journey
My Summer Road Trip in USA
I mapped my summer road trip across the United States this year, which included a field survey and travel. The breathtaking landscapes are now unforgettable memories. I will treasure it.
Inspired by @andrew.heiss.phd
#30DayMapChallenge
#Day4_Hexagons
Rain
Today, I indirectly used a 30 m x 30 m DEM and input it into Climate AP to obtain the average rainfall for each grid over 30 years, from 1991 to 2020. I then created a hexbin map to show the rainfall density.
Inspired by @kennethkhw.bsky.social
#Day4_Hexagons
Rain
Today, I indirectly used a 30 m x 30 m DEM and input it into Climate AP to obtain the average rainfall for each grid over 30 years, from 1991 to 2020. I then created a hexbin map to show the rainfall density.
Inspired by @kennethkhw.bsky.social

November 4, 2024 at 9:01 PM
#30DayMapChallenge
#Day4_Hexagons
Rain
Today, I indirectly used a 30 m x 30 m DEM and input it into Climate AP to obtain the average rainfall for each grid over 30 years, from 1991 to 2020. I then created a hexbin map to show the rainfall density.
Inspired by @kennethkhw.bsky.social
#Day4_Hexagons
Rain
Today, I indirectly used a 30 m x 30 m DEM and input it into Climate AP to obtain the average rainfall for each grid over 30 years, from 1991 to 2020. I then created a hexbin map to show the rainfall density.
Inspired by @kennethkhw.bsky.social
Does anyone know how to remove Copilot from Microsoft Word? It's so annoying when I'm starting a new paragraph in my manuscript, and I can't find a way to disable it. What a disappointing apps.
#Microsoft365
#Microsoft365
November 4, 2024 at 5:40 PM
Does anyone know how to remove Copilot from Microsoft Word? It's so annoying when I'm starting a new paragraph in my manuscript, and I can't find a way to disable it. What a disappointing apps.
#Microsoft365
#Microsoft365
Great snow in Logan last night!

November 3, 2024 at 3:56 PM
Great snow in Logan last night!
I’d love to try it!
#30DayMapChallenge · Day 3 · Polygons. 50-year average temperature and precipitation of Japan.
Inspired and made possible by @mohsinramay_
Inspired and made possible by @mohsinramay_

November 3, 2024 at 3:48 PM
I’d love to try it!
#30DayMapChallenge
#Day3_Polygons
Yushan National Park, Taiwan
Yushan (Mt. Jade) National Park is the highest national park in Taiwan. I mapped the contour plot and clipped it to the park boundaries to showcase the beautiful elevation gradient of Yushan National Park, the Jade.
#Day3_Polygons
Yushan National Park, Taiwan
Yushan (Mt. Jade) National Park is the highest national park in Taiwan. I mapped the contour plot and clipped it to the park boundaries to showcase the beautiful elevation gradient of Yushan National Park, the Jade.

November 3, 2024 at 3:02 PM
#30DayMapChallenge
#Day3_Polygons
Yushan National Park, Taiwan
Yushan (Mt. Jade) National Park is the highest national park in Taiwan. I mapped the contour plot and clipped it to the park boundaries to showcase the beautiful elevation gradient of Yushan National Park, the Jade.
#Day3_Polygons
Yushan National Park, Taiwan
Yushan (Mt. Jade) National Park is the highest national park in Taiwan. I mapped the contour plot and clipped it to the park boundaries to showcase the beautiful elevation gradient of Yushan National Park, the Jade.
#30DayMapChallenge
#Day2_Lines
Mt. Jade, Taiwan
Mt. Jade, or Yushan, is the highest mountain in Taiwan. The lines on the map represent longitude, not contour lines. This truly captures the shape of Mt. Jade, the highest peak in Taiwan.
Inspired by @dickie_roper (Xwitter)
#rstats
#Day2_Lines
Mt. Jade, Taiwan
Mt. Jade, or Yushan, is the highest mountain in Taiwan. The lines on the map represent longitude, not contour lines. This truly captures the shape of Mt. Jade, the highest peak in Taiwan.
Inspired by @dickie_roper (Xwitter)
#rstats

November 2, 2024 at 6:52 AM
#30DayMapChallenge
#Day2_Lines
Mt. Jade, Taiwan
Mt. Jade, or Yushan, is the highest mountain in Taiwan. The lines on the map represent longitude, not contour lines. This truly captures the shape of Mt. Jade, the highest peak in Taiwan.
Inspired by @dickie_roper (Xwitter)
#rstats
#Day2_Lines
Mt. Jade, Taiwan
Mt. Jade, or Yushan, is the highest mountain in Taiwan. The lines on the map represent longitude, not contour lines. This truly captures the shape of Mt. Jade, the highest peak in Taiwan.
Inspired by @dickie_roper (Xwitter)
#rstats