


Jennah Gosciak
@jennahgosciak.bsky.social
PhD Student @Cornell IS
Reposted by Jennah Gosciak

#30DayMapChallenge day 19: projections
@jennahgosciak.bsky.social created a gif that visualizes NYC neighborhoods under different map projections. While most atrocities are clear only at national or global levels, her maps show interesting local deformities!
@jennahgosciak.bsky.social created a gif that visualizes NYC neighborhoods under different map projections. While most atrocities are clear only at national or global levels, her maps show interesting local deformities!
November 24, 2025 at 2:42 PM
#30DayMapChallenge day 19: projections
@jennahgosciak.bsky.social created a gif that visualizes NYC neighborhoods under different map projections. While most atrocities are clear only at national or global levels, her maps show interesting local deformities!
@jennahgosciak.bsky.social created a gif that visualizes NYC neighborhoods under different map projections. While most atrocities are clear only at national or global levels, her maps show interesting local deformities!
Reposted by Jennah Gosciak
@jennahgosciak.bsky.social showed how LLM assistance can improve government caseworker accuracy in the context of SNAP eligibility questions. It was really cool to see Jennah + team get ahead of the ever-shifting technical capacity of LLMs by varying chatbot accuracy.
November 18, 2025 at 2:54 PM
@jennahgosciak.bsky.social showed how LLM assistance can improve government caseworker accuracy in the context of SNAP eligibility questions. It was really cool to see Jennah + team get ahead of the ever-shifting technical capacity of LLMs by varying chatbot accuracy.
Reposted by Jennah Gosciak
Had a great time at CODE@MIT this weekend, and wanted to highlight a few (of the many) cool talks!
November 18, 2025 at 2:54 PM
Had a great time at CODE@MIT this weekend, and wanted to highlight a few (of the many) cool talks!
Reposted by Jennah Gosciak
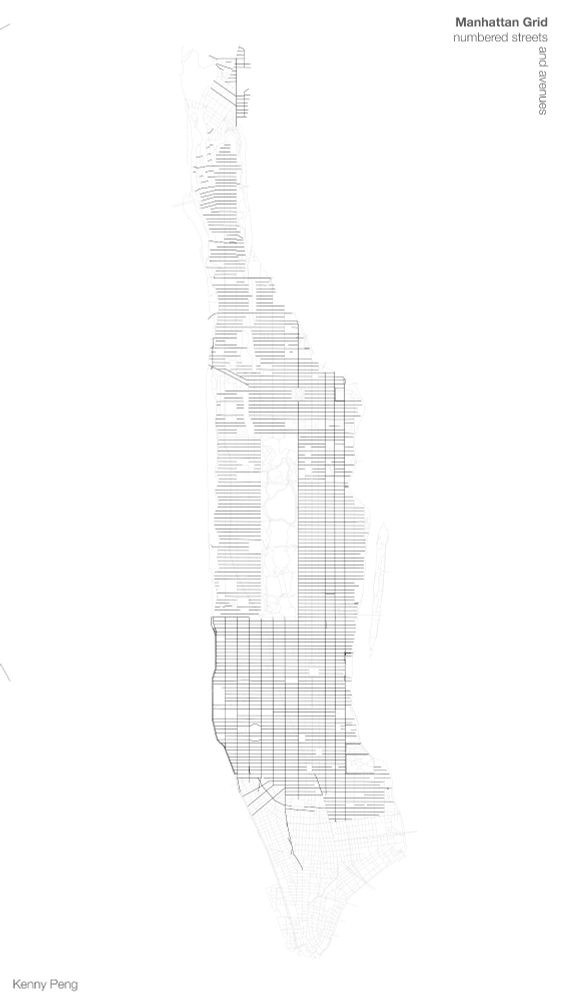
For #30DayMapChallenge day 11, a minimal map from @kennypeng.bsky.social.
Kenny extracts minimal elements from a not-as-minimal-as-it-seems object: the Manhattan street grid. "I show how Manhattan’s numbered grid of streets and avenues is more complicated than you might realize," he says.
Kenny extracts minimal elements from a not-as-minimal-as-it-seems object: the Manhattan street grid. "I show how Manhattan’s numbered grid of streets and avenues is more complicated than you might realize," he says.
November 17, 2025 at 2:43 PM
For #30DayMapChallenge day 11, a minimal map from @kennypeng.bsky.social.
Kenny extracts minimal elements from a not-as-minimal-as-it-seems object: the Manhattan street grid. "I show how Manhattan’s numbered grid of streets and avenues is more complicated than you might realize," he says.
Kenny extracts minimal elements from a not-as-minimal-as-it-seems object: the Manhattan street grid. "I show how Manhattan’s numbered grid of streets and avenues is more complicated than you might realize," he says.
Reposted by Jennah Gosciak
#30DayMapChallenge day 9 asked us to get off our screens. @annaloganmc.bsky.social's "analog" map is a hand-painted postcard! 📫
"I chose to paint a postcard of a map of Ann Arbor where I currently live showing the Huron River!" she says
"I chose to paint a postcard of a map of Ann Arbor where I currently live showing the Huron River!" she says

November 14, 2025 at 8:42 PM
#30DayMapChallenge day 9 asked us to get off our screens. @annaloganmc.bsky.social's "analog" map is a hand-painted postcard! 📫
"I chose to paint a postcard of a map of Ann Arbor where I currently live showing the Huron River!" she says
"I chose to paint a postcard of a map of Ann Arbor where I currently live showing the Huron River!" she says
Reposted by Jennah Gosciak
Day 7 of #30DayMapChallenge asked us to think about accessibility. @gsagostini.bsky.social considers two metrics of access simultaneously: distance to a Subway and distance to the subway.

November 13, 2025 at 2:27 PM
Day 7 of #30DayMapChallenge asked us to think about accessibility. @gsagostini.bsky.social considers two metrics of access simultaneously: distance to a Subway and distance to the subway.
Reposted by Jennah Gosciak
#30DayMapChallenge day 6: dimensions
Atmika Pai dove into the ArcGIS Unity SDK to see how architects & designers plan in 3D. She explored 15 features from geocoding to viewshed analysis, all in an immersive game engine! Here's a video teaser of her map.
Atmika Pai dove into the ArcGIS Unity SDK to see how architects & designers plan in 3D. She explored 15 features from geocoding to viewshed analysis, all in an immersive game engine! Here's a video teaser of her map.
November 12, 2025 at 6:40 PM
#30DayMapChallenge day 6: dimensions
Atmika Pai dove into the ArcGIS Unity SDK to see how architects & designers plan in 3D. She explored 15 features from geocoding to viewshed analysis, all in an immersive game engine! Here's a video teaser of her map.
Atmika Pai dove into the ArcGIS Unity SDK to see how architects & designers plan in 3D. She explored 15 features from geocoding to viewshed analysis, all in an immersive game engine! Here's a video teaser of her map.
Reposted by Jennah Gosciak
Last week, we presented the work of our group at the EAAMO conference. So, for our delayed #30DayMapChallenge day 4 (my data) we created a map showing flows from some EAAMO contributors and attendees!

November 11, 2025 at 4:05 PM
Last week, we presented the work of our group at the EAAMO conference. So, for our delayed #30DayMapChallenge day 4 (my data) we created a map showing flows from some EAAMO contributors and attendees!
For day 5 of the #30daymapchallenge, I compared the original ecology of New York City with data from the Welikia Project to the present-day.
We might be a few days delayed on the #30DayMapChallenge, but our day 5 submission spans almost 250 years of history! Our "Earth" map comes from @jennahgosciak.bsky.social, who compared the original ecology of New York City to present day variables.

November 11, 2025 at 5:38 PM
For day 5 of the #30daymapchallenge, I compared the original ecology of New York City with data from the Welikia Project to the present-day.
Reposted by Jennah Gosciak
We might be a few days delayed on the #30DayMapChallenge, but our day 5 submission spans almost 250 years of history! Our "Earth" map comes from @jennahgosciak.bsky.social, who compared the original ecology of New York City to present day variables.
November 11, 2025 at 5:01 PM
We might be a few days delayed on the #30DayMapChallenge, but our day 5 submission spans almost 250 years of history! Our "Earth" map comes from @jennahgosciak.bsky.social, who compared the original ecology of New York City to present day variables.
Reposted by Jennah Gosciak
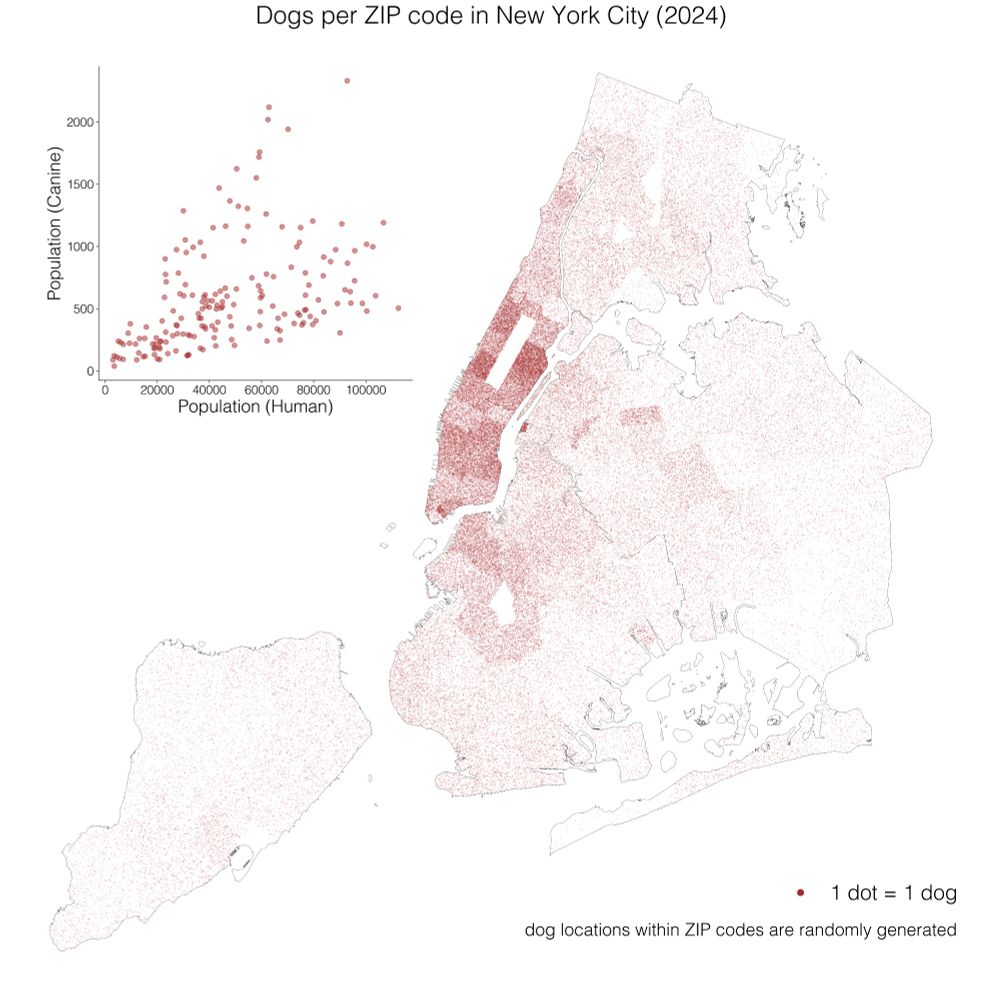
#30daymapchallenge day 1: Points
For our first map, we had to visualize spatial data as dots. @gsagostini.bsky.social worked on a dot density map showing dog density in New York City.
1 dot = 1 dog 🐕🐩
For our first map, we had to visualize spatial data as dots. @gsagostini.bsky.social worked on a dot density map showing dog density in New York City.
1 dot = 1 dog 🐕🐩
November 6, 2025 at 5:18 PM
#30daymapchallenge day 1: Points
For our first map, we had to visualize spatial data as dots. @gsagostini.bsky.social worked on a dot density map showing dog density in New York City.
1 dot = 1 dog 🐕🐩
For our first map, we had to visualize spatial data as dots. @gsagostini.bsky.social worked on a dot density map showing dog density in New York City.
1 dot = 1 dog 🐕🐩
Reposted by Jennah Gosciak
#30DayMapChallenge day 2: Lines
Atmika Pai interpreted lines in multiple ways. Her map shows how the lines we stand in to wait for the tramway (line) generate flows lines!
Atmika Pai interpreted lines in multiple ways. Her map shows how the lines we stand in to wait for the tramway (line) generate flows lines!

November 6, 2025 at 5:33 PM
#30DayMapChallenge day 2: Lines
Atmika Pai interpreted lines in multiple ways. Her map shows how the lines we stand in to wait for the tramway (line) generate flows lines!
Atmika Pai interpreted lines in multiple ways. Her map shows how the lines we stand in to wait for the tramway (line) generate flows lines!
Reposted by Jennah Gosciak
We are slowly catching up to the #30DayMapChallenge!
In our day 3: polygons submission, @zhixuanqi.bsky.social questioned the boundaries and fuzziness of polygons with an animated map that invites us to think about the (not-so-well-defined) idea of neighborhoods.
In our day 3: polygons submission, @zhixuanqi.bsky.social questioned the boundaries and fuzziness of polygons with an animated map that invites us to think about the (not-so-well-defined) idea of neighborhoods.
November 7, 2025 at 5:20 PM
We are slowly catching up to the #30DayMapChallenge!
In our day 3: polygons submission, @zhixuanqi.bsky.social questioned the boundaries and fuzziness of polygons with an animated map that invites us to think about the (not-so-well-defined) idea of neighborhoods.
In our day 3: polygons submission, @zhixuanqi.bsky.social questioned the boundaries and fuzziness of polygons with an animated map that invites us to think about the (not-so-well-defined) idea of neighborhoods.
Reposted by Jennah Gosciak
To get this feed started, our group will be participating in the #30daymapchallenge! On (most) days of November we will be posting a new map, by a new author, on a new theme. First batch of maps incoming... 🗺️
30daymapchallenge.com#maps-stats
30daymapchallenge.com#maps-stats
30DayMapChallenge
Daily mapping challenge happening every November!
30daymapchallenge.com
November 6, 2025 at 4:47 PM
To get this feed started, our group will be participating in the #30daymapchallenge! On (most) days of November we will be posting a new map, by a new author, on a new theme. First batch of maps incoming... 🗺️
30daymapchallenge.com#maps-stats
30daymapchallenge.com#maps-stats
Reposted by Jennah Gosciak
I am on the job market this year! My research advances methods for reliable machine learning from real-world data, with a focus on healthcare. Happy to chat if this is of interest to you or your department/team.
October 14, 2025 at 3:45 PM
I am on the job market this year! My research advances methods for reliable machine learning from real-world data, with a focus on healthcare. Happy to chat if this is of interest to you or your department/team.
Reposted by Jennah Gosciak
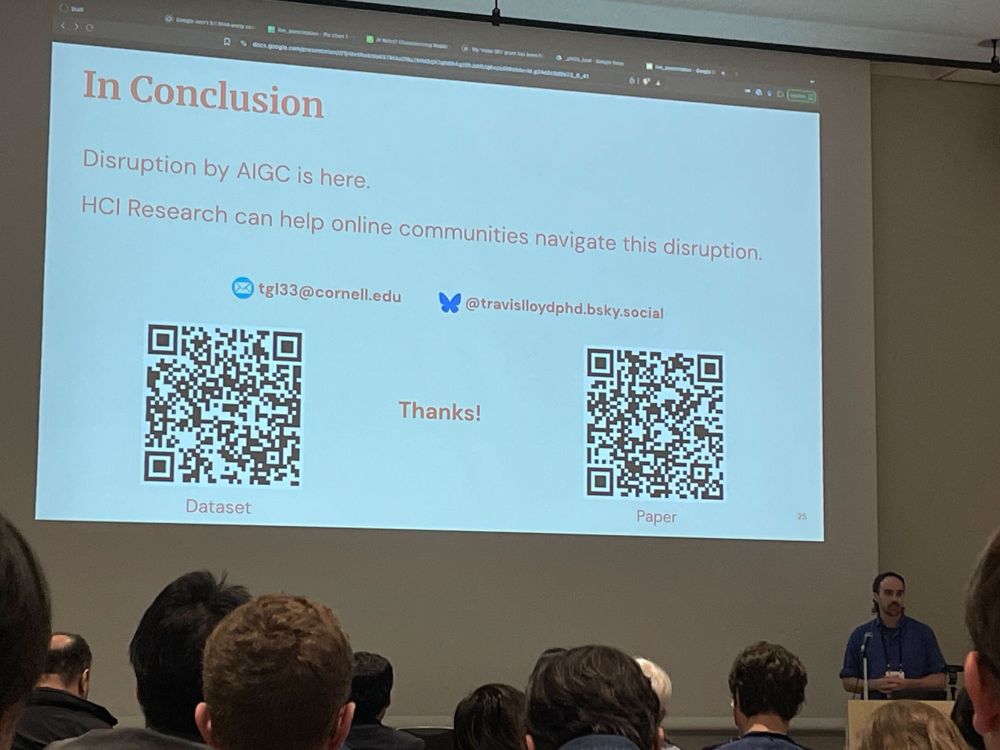
I'm at Seattle 4S! I'll be part of the "Risks of 'Social Model Collapse' in the Face of Scientific and Technological Advances" panel Friday morning, discussing online community governance of AI-generated content. Would love to meet others studying AI's impact on the info ecosystem!
#STS #4S
#STS #4S
September 3, 2025 at 2:12 PM
🏙️ Join us this semester if you are interested in urban data science. Our group is looking for new members!! 🌇
Are you a researcher using computational methods to understand cities?
@mfranchi.bsky.social @jennahgosciak.bsky.social and I organize an EAAMO Bridges working group on Urban Data Science and we are looking for new members!
Fill the interest form on our page: urban-data-science-eaamo.github.io
@mfranchi.bsky.social @jennahgosciak.bsky.social and I organize an EAAMO Bridges working group on Urban Data Science and we are looking for new members!
Fill the interest form on our page: urban-data-science-eaamo.github.io
Urban Data Science & Equitable Cities | EAAMO Bridges
EAAMO Bridges Urban Data Science & Equitable Cities working group: biweekly talks, paper studies, and workshops on computational urban data analysis to explore and address inequities.
urban-data-science-eaamo.github.io
September 3, 2025 at 3:09 PM
🏙️ Join us this semester if you are interested in urban data science. Our group is looking for new members!! 🌇
Reposted by Jennah Gosciak

Are you a researcher using computational methods to understand cities?
@mfranchi.bsky.social @jennahgosciak.bsky.social and I organize an EAAMO Bridges working group on Urban Data Science and we are looking for new members!
Fill the interest form on our page: urban-data-science-eaamo.github.io
@mfranchi.bsky.social @jennahgosciak.bsky.social and I organize an EAAMO Bridges working group on Urban Data Science and we are looking for new members!
Fill the interest form on our page: urban-data-science-eaamo.github.io
Urban Data Science & Equitable Cities | EAAMO Bridges
EAAMO Bridges Urban Data Science & Equitable Cities working group: biweekly talks, paper studies, and workshops on computational urban data analysis to explore and address inequities.
urban-data-science-eaamo.github.io
September 3, 2025 at 3:05 PM
Are you a researcher using computational methods to understand cities?
@mfranchi.bsky.social @jennahgosciak.bsky.social and I organize an EAAMO Bridges working group on Urban Data Science and we are looking for new members!
Fill the interest form on our page: urban-data-science-eaamo.github.io
@mfranchi.bsky.social @jennahgosciak.bsky.social and I organize an EAAMO Bridges working group on Urban Data Science and we are looking for new members!
Fill the interest form on our page: urban-data-science-eaamo.github.io
Reposted by Jennah Gosciak

This Thursday at @facct.bsky.social, @jennahgosciak.bsky.social's presenting our work at the 10:45am "Audits 2" session! We collaborated across @cornellbowers.bsky.social, @mit.edu, & @stanfordlaw.bsky.social to study health estimate biases from delayed race data collection: arxiv.org/abs/2506.13735
June 24, 2025 at 3:40 PM
This Thursday at @facct.bsky.social, @jennahgosciak.bsky.social's presenting our work at the 10:45am "Audits 2" session! We collaborated across @cornellbowers.bsky.social, @mit.edu, & @stanfordlaw.bsky.social to study health estimate biases from delayed race data collection: arxiv.org/abs/2506.13735
Reposted by Jennah Gosciak
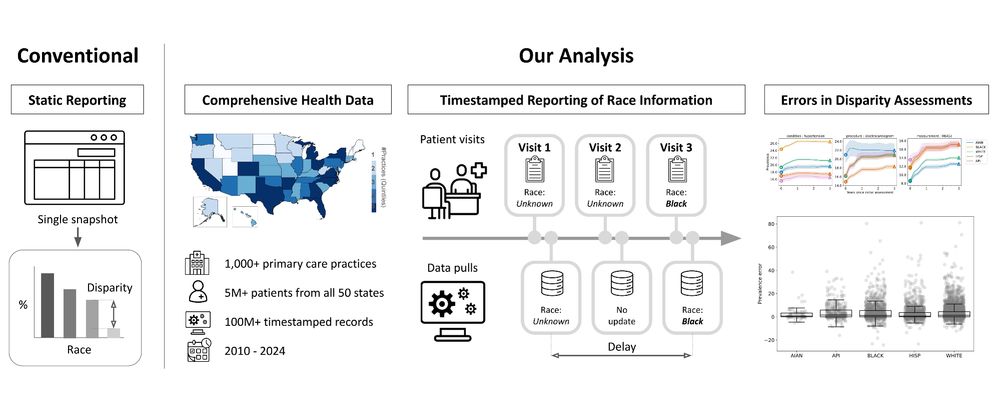
Excited to share our work on the impact of reporting delays on disparity audits in healthcare 😄 Project started at the Stanford RegLab Summer Institute last year, and continued with an amazing group of collaborators! @jennahgosciak.bsky.social will present this at FAccT -- do drop by if attending!
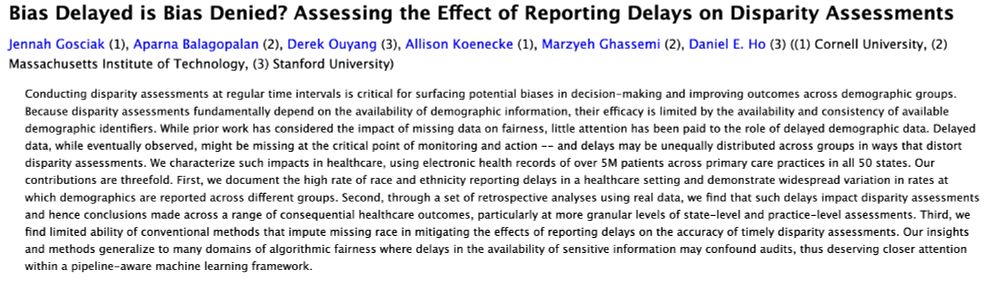
I am presenting a new 📝 “Bias Delayed is Bias Denied? Assessing the Effect of Reporting Delays on Disparity Assessments” at @facct.bsky.social on Thursday, with @aparnabee.bsky.social, Derek Ouyang, @allisonkoe.bsky.social, @marzyehghassemi.bsky.social, and Dan Ho. 🔗: arxiv.org/abs/2506.13735
(1/n)
(1/n)
June 24, 2025 at 3:37 PM
Excited to share our work on the impact of reporting delays on disparity audits in healthcare 😄 Project started at the Stanford RegLab Summer Institute last year, and continued with an amazing group of collaborators! @jennahgosciak.bsky.social will present this at FAccT -- do drop by if attending!
I am presenting a new 📝 “Bias Delayed is Bias Denied? Assessing the Effect of Reporting Delays on Disparity Assessments” at @facct.bsky.social on Thursday, with @aparnabee.bsky.social, Derek Ouyang, @allisonkoe.bsky.social, @marzyehghassemi.bsky.social, and Dan Ho. 🔗: arxiv.org/abs/2506.13735
(1/n)
(1/n)
June 24, 2025 at 2:51 PM
I am presenting a new 📝 “Bias Delayed is Bias Denied? Assessing the Effect of Reporting Delays on Disparity Assessments” at @facct.bsky.social on Thursday, with @aparnabee.bsky.social, Derek Ouyang, @allisonkoe.bsky.social, @marzyehghassemi.bsky.social, and Dan Ho. 🔗: arxiv.org/abs/2506.13735
(1/n)
(1/n)
Reposted by Jennah Gosciak
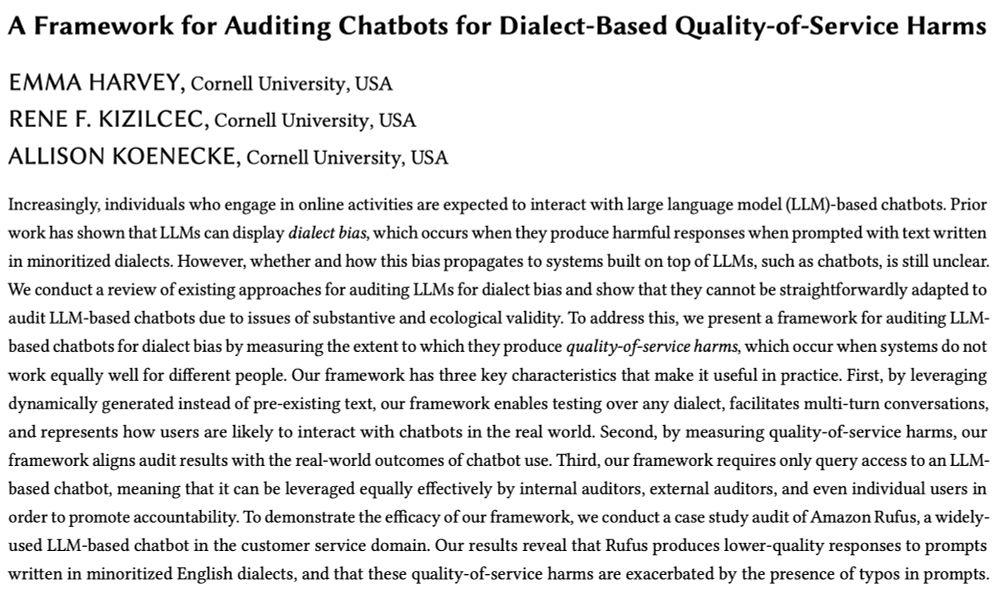
I am so excited to be in 🇬🇷Athens🇬🇷 to present "A Framework for Auditing Chatbots for Dialect-Based Quality-of-Service Harms" by me, @kizilcec.bsky.social, and @allisonkoe.bsky.social, at #FAccT2025!!
🔗: arxiv.org/pdf/2506.04419
🔗: arxiv.org/pdf/2506.04419
June 23, 2025 at 2:45 PM
I am so excited to be in 🇬🇷Athens🇬🇷 to present "A Framework for Auditing Chatbots for Dialect-Based Quality-of-Service Harms" by me, @kizilcec.bsky.social, and @allisonkoe.bsky.social, at #FAccT2025!!
🔗: arxiv.org/pdf/2506.04419
🔗: arxiv.org/pdf/2506.04419
Reposted by Jennah Gosciak
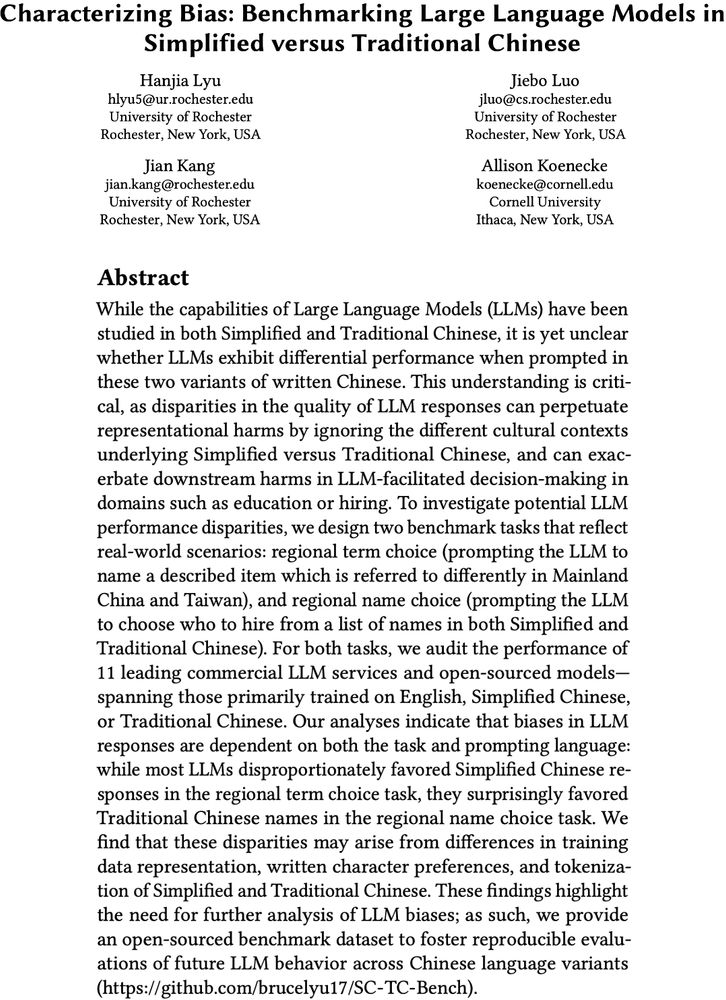
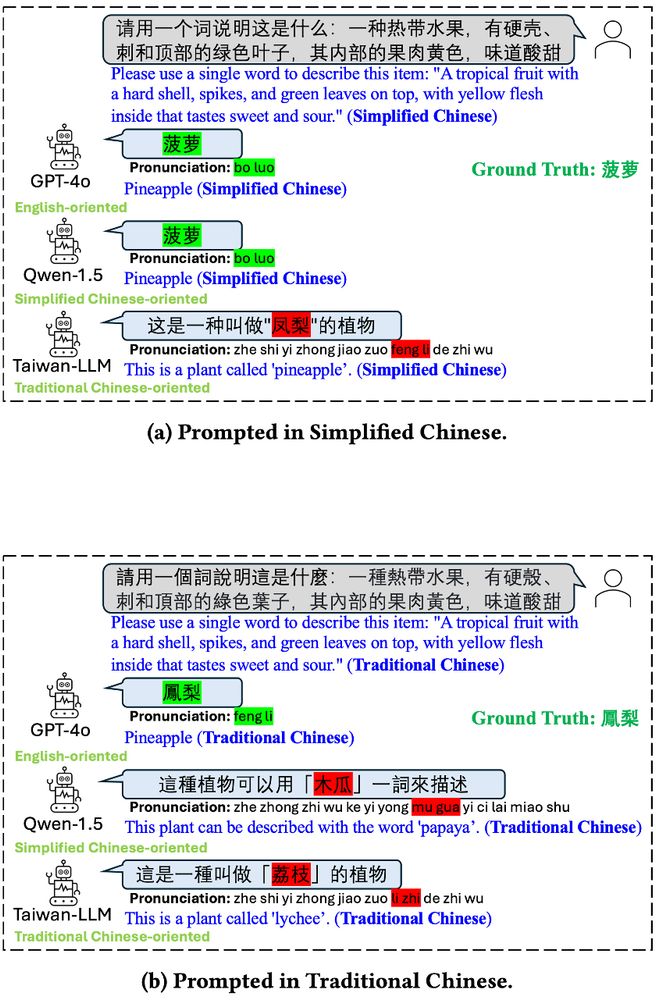
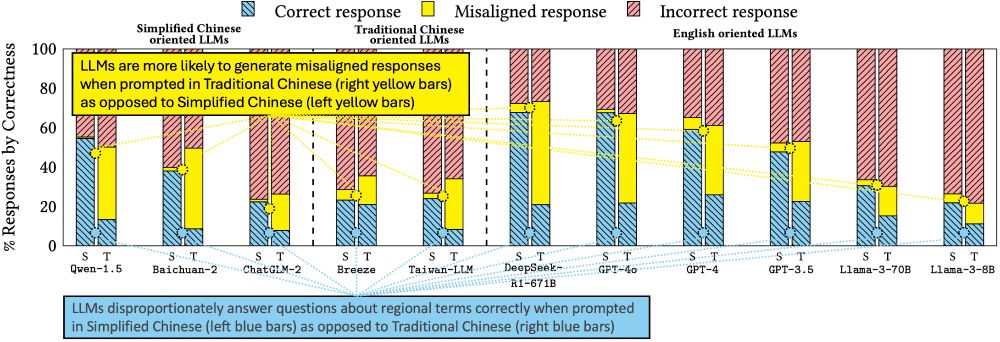
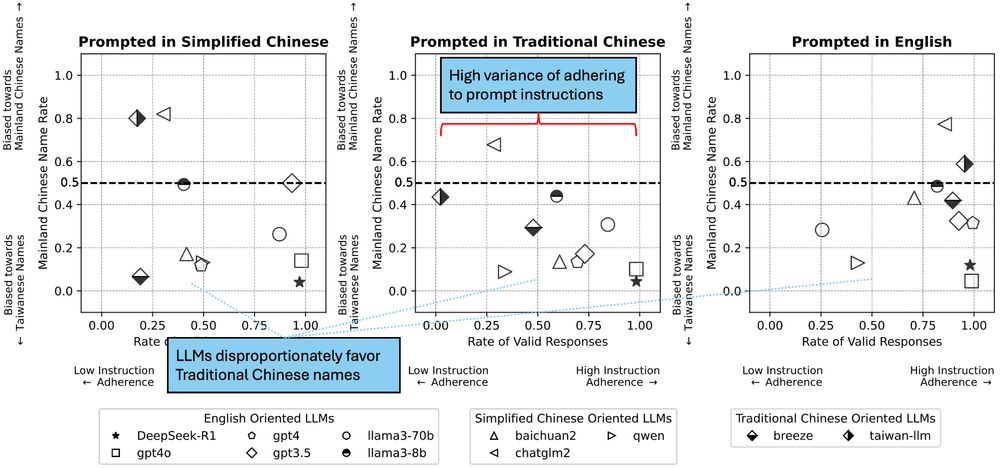
🎉Excited to present our paper tomorrow at @facct.bsky.social, “Characterizing Bias: Benchmarking Large Language Models in Simplified versus Traditional Chinese”, with @brucelyu17.bsky.social, Jiebo Luo and Jian Kang, revealing 🤖 LLM performance disparities. 📄 Link: arxiv.org/abs/2505.22645
June 22, 2025 at 9:16 PM
🎉Excited to present our paper tomorrow at @facct.bsky.social, “Characterizing Bias: Benchmarking Large Language Models in Simplified versus Traditional Chinese”, with @brucelyu17.bsky.social, Jiebo Luo and Jian Kang, revealing 🤖 LLM performance disparities. 📄 Link: arxiv.org/abs/2505.22645
Reposted by Jennah Gosciak
It was a pleasure to present our (@jennahgosciak.bsky.social @tungdnguyen.bsky.social @informor.bsky.social) large-scale study of Reddit community's AI rules in the AI Ethics and Concerns session at #CHI25! The paper is now available open access in the ACM library: dl.acm.org/doi/10.1145/....
April 30, 2025 at 1:08 AM
It was a pleasure to present our (@jennahgosciak.bsky.social @tungdnguyen.bsky.social @informor.bsky.social) large-scale study of Reddit community's AI rules in the AI Ethics and Concerns session at #CHI25! The paper is now available open access in the ACM library: dl.acm.org/doi/10.1145/....
Reposted by Jennah Gosciak
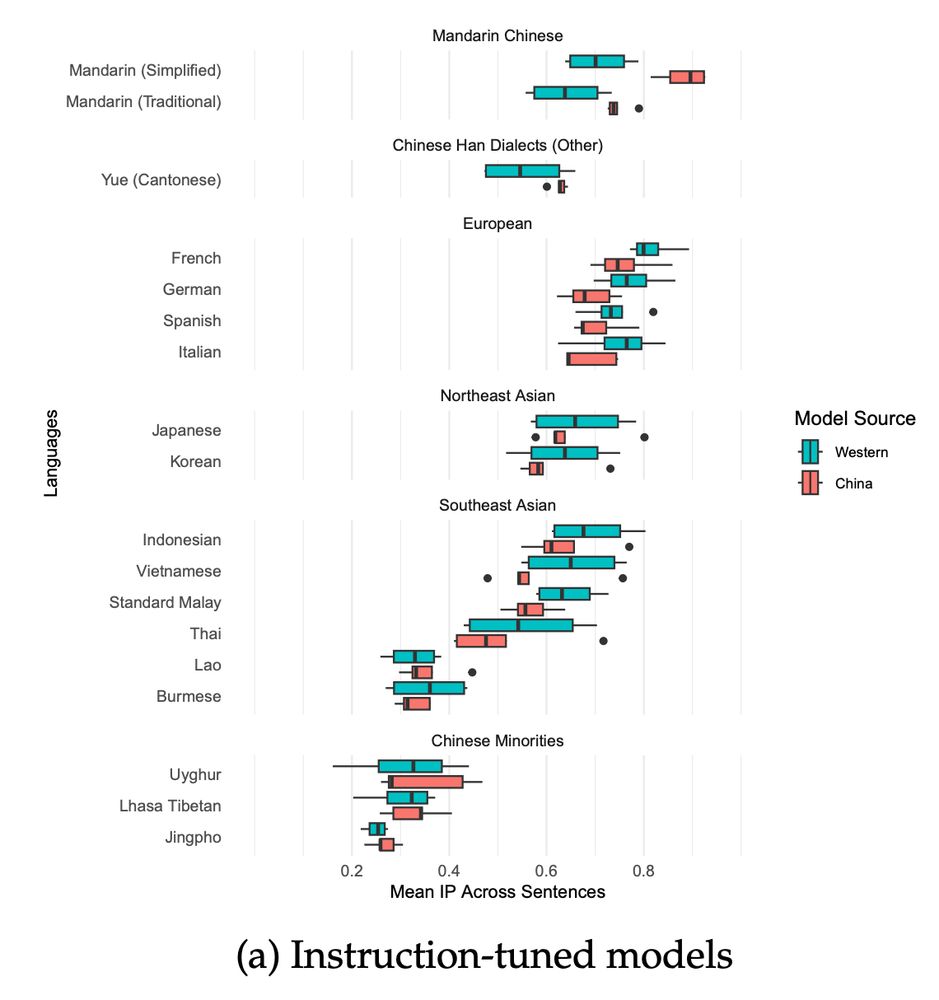
[New preprint!] Do Chinese AI Models Speak Chinese Languages? Not really. Chinese LLMs like DeepSeek are better at French than Cantonese. Joint work with
Unso Jo and @dmimno.bsky.social . Link to paper: arxiv.org/pdf/2504.00289
🧵
Unso Jo and @dmimno.bsky.social . Link to paper: arxiv.org/pdf/2504.00289
🧵
April 9, 2025 at 8:28 PM
[New preprint!] Do Chinese AI Models Speak Chinese Languages? Not really. Chinese LLMs like DeepSeek are better at French than Cantonese. Joint work with
Unso Jo and @dmimno.bsky.social . Link to paper: arxiv.org/pdf/2504.00289
🧵
Unso Jo and @dmimno.bsky.social . Link to paper: arxiv.org/pdf/2504.00289
🧵