


Jorge A. Giraldo
@jagiral1.bsky.social
Interested in ecology, dendrochronology, and plant physiology.
Reposted by Jorge A. Giraldo

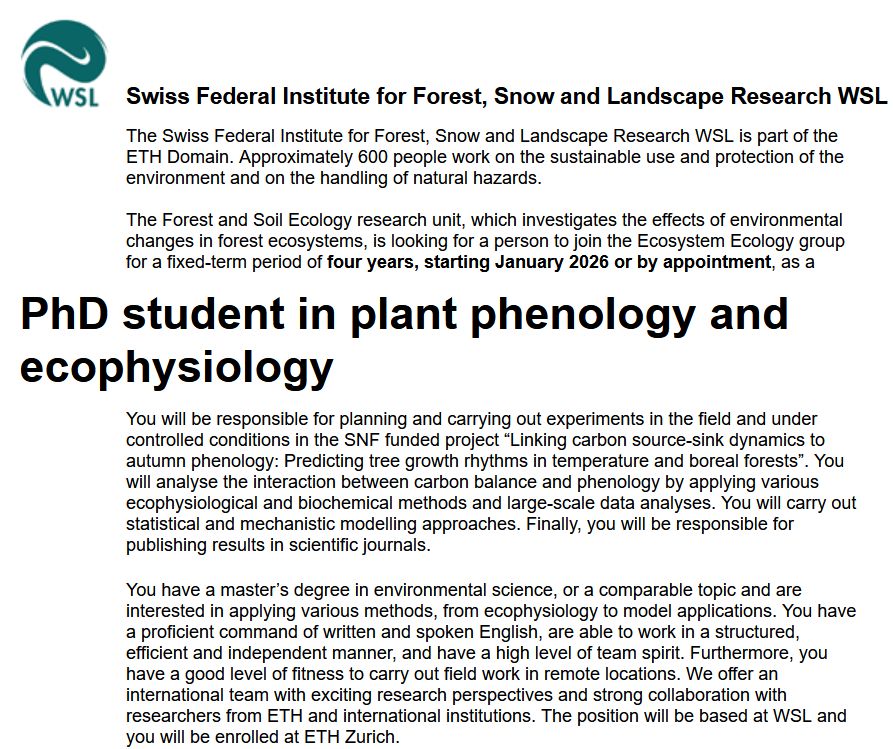
🍂🌳 #PhDAlert! MSc in #EnvironmentalSciences or a related field and interested in plant #phenology and #ecophysiology? Good level of fitness to carry out field work in remote locations? Our #Ecosystem #Ecology group offers a #PhD position: apply.refline.ch/273855/1789/... #ScienceJobs
October 21, 2025 at 8:56 AM
🍂🌳 #PhDAlert! MSc in #EnvironmentalSciences or a related field and interested in plant #phenology and #ecophysiology? Good level of fitness to carry out field work in remote locations? Our #Ecosystem #Ecology group offers a #PhD position: apply.refline.ch/273855/1789/... #ScienceJobs
Reposted by Jorge A. Giraldo

🪵 Diameter drives short-term biomass gains, but long-term carbon storage hinges on wood density, especially in humid forests. To improve accuracy, biomass models should account for radial wood density variation and climate ☁️
🔎 Find out more: buff.ly/kZFoh9B
🔎 Find out more: buff.ly/kZFoh9B

October 19, 2025 at 4:03 PM
🪵 Diameter drives short-term biomass gains, but long-term carbon storage hinges on wood density, especially in humid forests. To improve accuracy, biomass models should account for radial wood density variation and climate ☁️
🔎 Find out more: buff.ly/kZFoh9B
🔎 Find out more: buff.ly/kZFoh9B
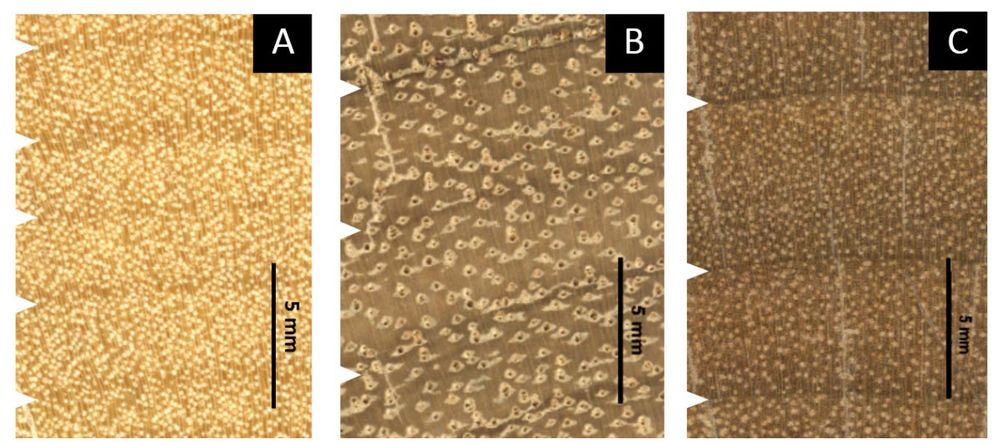
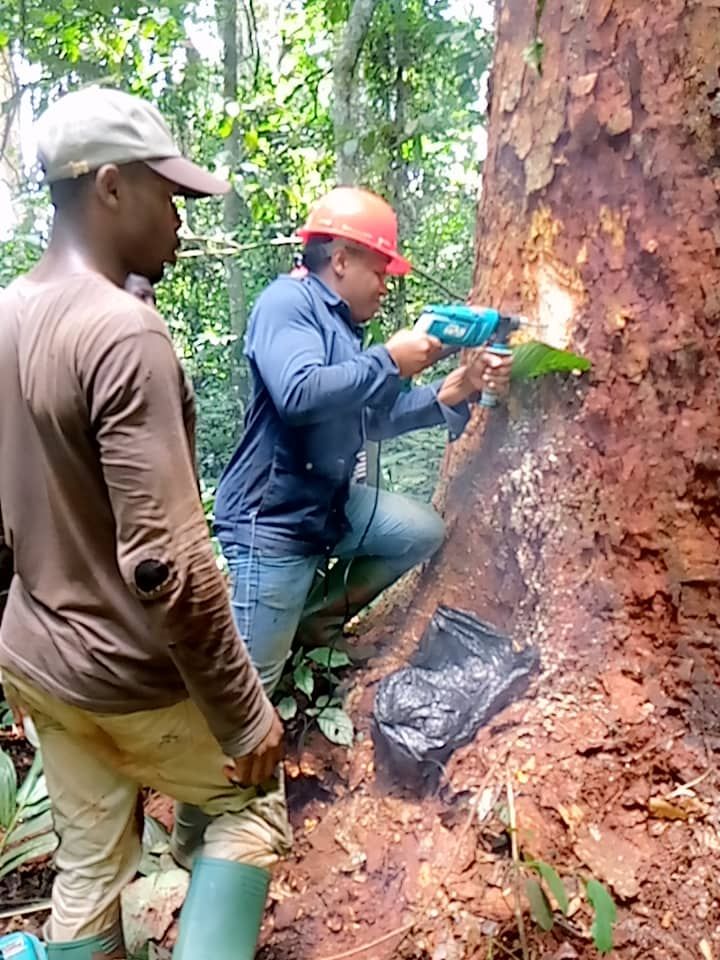
New undergraduate research explores the anatomy of three native tree species from Colombia’s Chocó biogeographic region.
revistas.humboldt.org.co/index.php/bi...
revistas.humboldt.org.co/index.php/bi...
October 12, 2025 at 5:11 PM
New undergraduate research explores the anatomy of three native tree species from Colombia’s Chocó biogeographic region.
revistas.humboldt.org.co/index.php/bi...
revistas.humboldt.org.co/index.php/bi...
Transverse section of Weinmannia pubescens.

September 13, 2025 at 9:41 PM
Transverse section of Weinmannia pubescens.
Reposted by Jorge A. Giraldo
#Tree stems accumulate biomass by adding volume of certain density. Which factor is more important?
Using tropical #treering data we found: diameter increment explains biomass growth at short term; wood density at long term.🌎🌐🍁
#dendrochronology
besjournals.onlinelibrary.wiley.com/doi/10.1111/...
Using tropical #treering data we found: diameter increment explains biomass growth at short term; wood density at long term.🌎🌐🍁
#dendrochronology
besjournals.onlinelibrary.wiley.com/doi/10.1111/...

Biomass production of tropical trees across space and time: The shifting roles of diameter growth and wood density
Diameter growth is an important and good indicator of forest carbon production. However, size-related changes in wood density, which are usually neglected, are critical for accurate short- and long-t...
besjournals.onlinelibrary.wiley.com
August 29, 2025 at 9:19 PM
#Tree stems accumulate biomass by adding volume of certain density. Which factor is more important?
Using tropical #treering data we found: diameter increment explains biomass growth at short term; wood density at long term.🌎🌐🍁
#dendrochronology
besjournals.onlinelibrary.wiley.com/doi/10.1111/...
Using tropical #treering data we found: diameter increment explains biomass growth at short term; wood density at long term.🌎🌐🍁
#dendrochronology
besjournals.onlinelibrary.wiley.com/doi/10.1111/...
Reposted by Jorge A. Giraldo
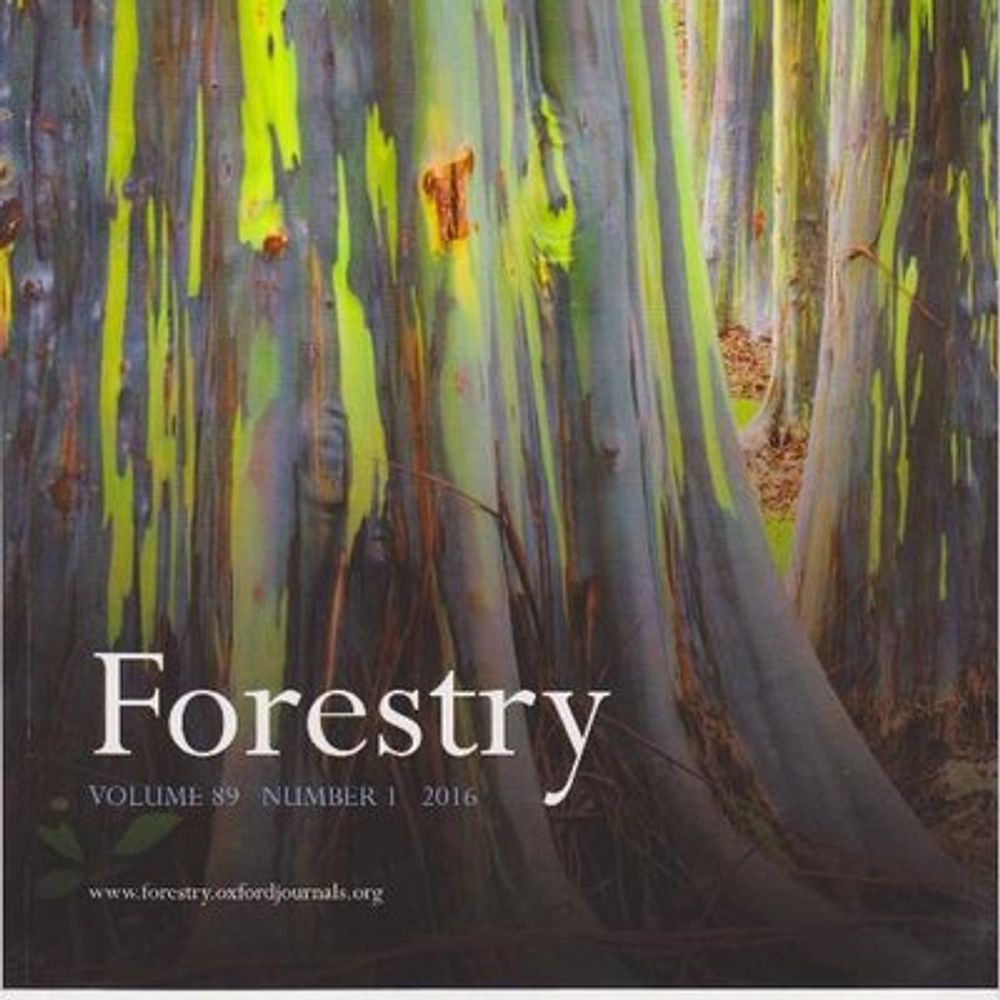
Have you seen our collection of high-impact articles?
Take a look at the most read and cited papers of the last two years at Forestry with topics ranging from:
🌳 Forest monitoring
💻 Deep learning
🍂 Ash dieback and more!
academic.oup.com/forestry/pag...
Take a look at the most read and cited papers of the last two years at Forestry with topics ranging from:
🌳 Forest monitoring
💻 Deep learning
🍂 Ash dieback and more!
academic.oup.com/forestry/pag...
August 27, 2025 at 4:28 PM
Have you seen our collection of high-impact articles?
Take a look at the most read and cited papers of the last two years at Forestry with topics ranging from:
🌳 Forest monitoring
💻 Deep learning
🍂 Ash dieback and more!
academic.oup.com/forestry/pag...
Take a look at the most read and cited papers of the last two years at Forestry with topics ranging from:
🌳 Forest monitoring
💻 Deep learning
🍂 Ash dieback and more!
academic.oup.com/forestry/pag...
Reposted by Jorge A. Giraldo

🚀 New Feature in Leafmap – Interactive Time-Series Visualization! 🌍🛰️
Leafmap now supports time sliders for visualizing large collections of remote sensing images.
Try it out
Web App: huggingface.co/spaces/giswq...
Notebook: leafmap.org/maplibre/tim...
#geospatial #leafmap #opensource #mapping
Leafmap now supports time sliders for visualizing large collections of remote sensing images.
Try it out
Web App: huggingface.co/spaces/giswq...
Notebook: leafmap.org/maplibre/tim...
#geospatial #leafmap #opensource #mapping
August 10, 2025 at 8:08 PM
🚀 New Feature in Leafmap – Interactive Time-Series Visualization! 🌍🛰️
Leafmap now supports time sliders for visualizing large collections of remote sensing images.
Try it out
Web App: huggingface.co/spaces/giswq...
Notebook: leafmap.org/maplibre/tim...
#geospatial #leafmap #opensource #mapping
Leafmap now supports time sliders for visualizing large collections of remote sensing images.
Try it out
Web App: huggingface.co/spaces/giswq...
Notebook: leafmap.org/maplibre/tim...
#geospatial #leafmap #opensource #mapping
Reposted by Jorge A. Giraldo
How do tropical #trees deal with droughts? The answer is published today in @science.org
Our pantropical #treering analysis revealed 2.5% growth reduction during #drought years. Yet, growth declined by >10% in 1/4 of 500 study sites, and in hotter & drier regions.
doi.org/10.1126/scie...
🌍🍁🌐
(1/4)
Our pantropical #treering analysis revealed 2.5% growth reduction during #drought years. Yet, growth declined by >10% in 1/4 of 500 study sites, and in hotter & drier regions.
doi.org/10.1126/scie...
🌍🍁🌐
(1/4)
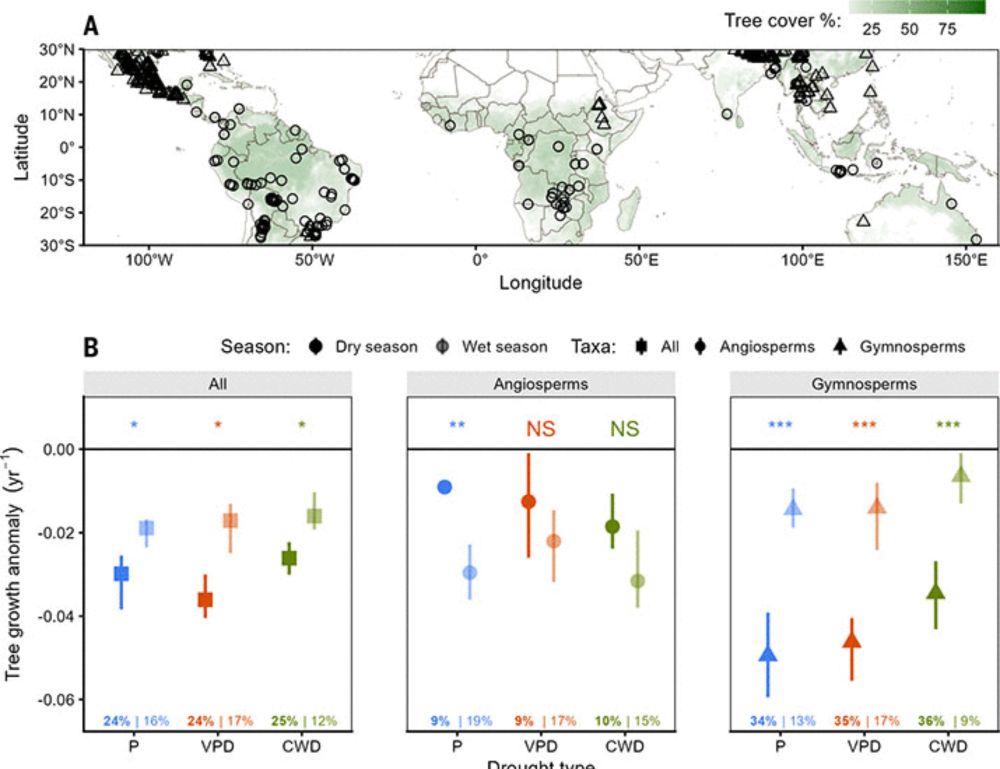
Pantropical tree rings show small effects of drought on stem growth
Increasing drought pressure under anthropogenic climate change may jeopardize the potential of tropical forests to capture carbon in woody biomass and act as a long-term carbon dioxide sink. To evalua...
doi.org
July 31, 2025 at 6:37 PM
How do tropical #trees deal with droughts? The answer is published today in @science.org
Our pantropical #treering analysis revealed 2.5% growth reduction during #drought years. Yet, growth declined by >10% in 1/4 of 500 study sites, and in hotter & drier regions.
doi.org/10.1126/scie...
🌍🍁🌐
(1/4)
Our pantropical #treering analysis revealed 2.5% growth reduction during #drought years. Yet, growth declined by >10% in 1/4 of 500 study sites, and in hotter & drier regions.
doi.org/10.1126/scie...
🌍🍁🌐
(1/4)
Reposted by Jorge A. Giraldo
Nuestra propuesta para crear la Red Iberoamericana de Adaptación al cambio global de Bosques Amenazados - RIABA 🌎🌍 ha obtenido financiación del programa Lincglobal del @csic.es 1/2
June 28, 2025 at 11:00 AM
Nuestra propuesta para crear la Red Iberoamericana de Adaptación al cambio global de Bosques Amenazados - RIABA 🌎🌍 ha obtenido financiación del programa Lincglobal del @csic.es 1/2
Reposted by Jorge A. Giraldo
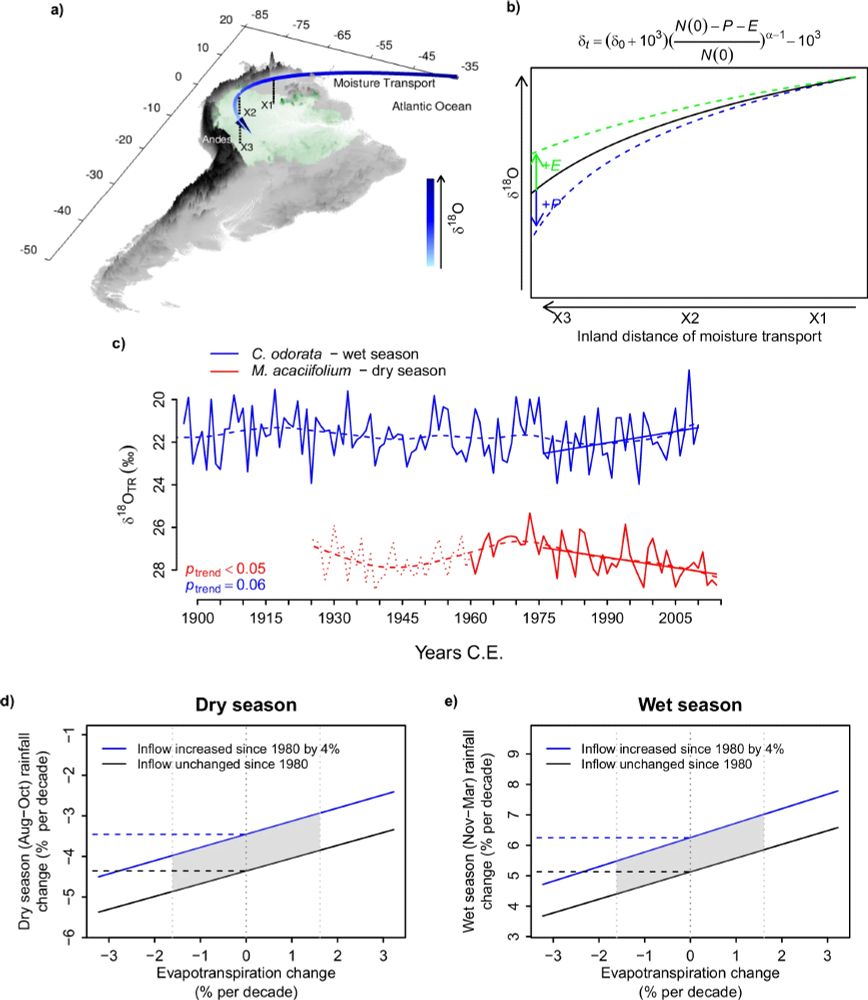
The seasonality of the Amazon water cycle is intensifying.
-> Bruno Cintra and colleagues use decades of oxygen isotopes in tree rings to show how the dry season has got drier, and the wet season wetter.
www.nature.com/articles/s43...
-> Bruno Cintra and colleagues use decades of oxygen isotopes in tree rings to show how the dry season has got drier, and the wet season wetter.
www.nature.com/articles/s43...
June 17, 2025 at 10:49 AM
The seasonality of the Amazon water cycle is intensifying.
-> Bruno Cintra and colleagues use decades of oxygen isotopes in tree rings to show how the dry season has got drier, and the wet season wetter.
www.nature.com/articles/s43...
-> Bruno Cintra and colleagues use decades of oxygen isotopes in tree rings to show how the dry season has got drier, and the wet season wetter.
www.nature.com/articles/s43...
Reposted by Jorge A. Giraldo
New paper on tropical #timber #tracing! We tested the use of wood oxygen stable isotopes (δ18O ) for tracing. We produced #isoscapes for 5 major tropical timbers. These isoscapes alone had limited utility. Combinations with other techniques may help. #timtrace
www.sciencedirect.com/science/arti...
www.sciencedirect.com/science/arti...
June 11, 2025 at 4:16 PM
New paper on tropical #timber #tracing! We tested the use of wood oxygen stable isotopes (δ18O ) for tracing. We produced #isoscapes for 5 major tropical timbers. These isoscapes alone had limited utility. Combinations with other techniques may help. #timtrace
www.sciencedirect.com/science/arti...
www.sciencedirect.com/science/arti...
Reposted by Jorge A. Giraldo

New in @sciencemagazine, a review on Scaling plant responses to heat (www.science.org/doi/10.1126/...). Increased temperature along with acute heat waves threaten the ability of terrestrial vegetation to act as a carbon sink, but predicting how plants will respond to heat is challenging.
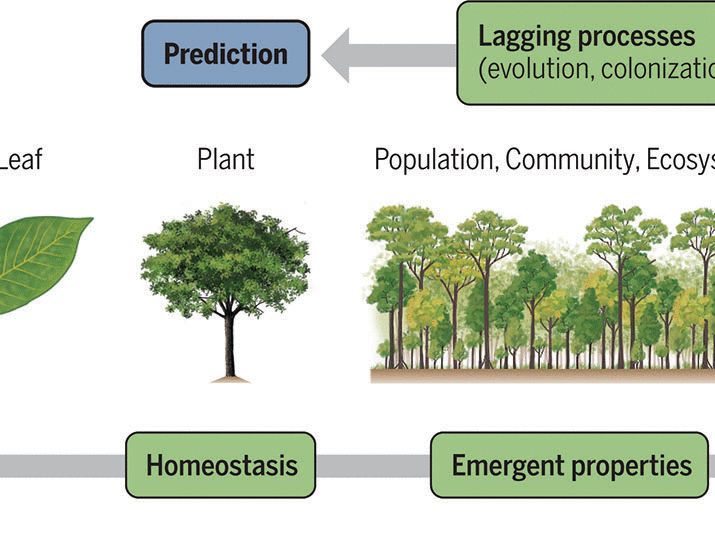
Scaling plant responses to heat: From molecules to the biosphere
Predicting plant responses to rising temperatures, including acute heat waves and hot droughts of varying intensity and duration, is central to addressing the climate and biodiversity crises. However,...
www.science.org
June 12, 2025 at 10:37 PM
New in @sciencemagazine, a review on Scaling plant responses to heat (www.science.org/doi/10.1126/...). Increased temperature along with acute heat waves threaten the ability of terrestrial vegetation to act as a carbon sink, but predicting how plants will respond to heat is challenging.
Reposted by Jorge A. Giraldo

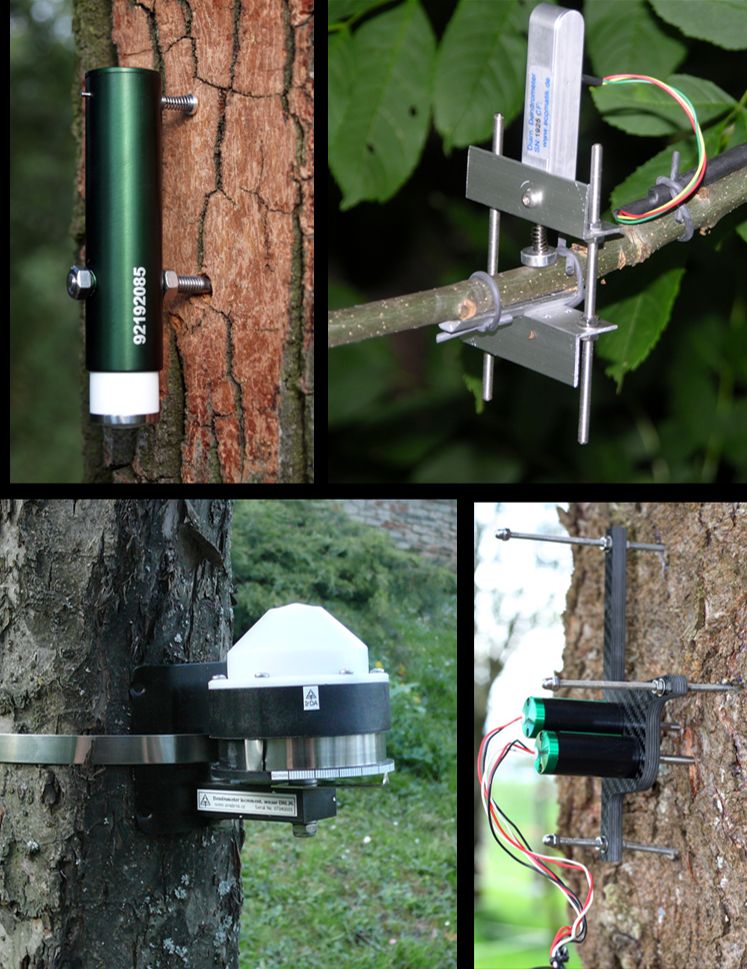
🪧Calling all researchers working with #dendrometers. The #NordicDendroNetwork is holding its first meeting 13-15 October in Norway. For more information and registration go to >>> shorturl.at/HqoFY
May 27, 2025 at 10:24 AM
🪧Calling all researchers working with #dendrometers. The #NordicDendroNetwork is holding its first meeting 13-15 October in Norway. For more information and registration go to >>> shorturl.at/HqoFY
Reposted by Jorge A. Giraldo

This tutorial will guide you through the core functionalities of PlotToSat. It will help you quickly extract Sentinel-1 🛰️ and Sentinel-2 🛰️ time series at multiple plot regions. The centres of the plots are defined in an input .csv file.
#EO #ML #time-series #forests 🌲
@drmiltiadou.bsky.social
#EO #ML #time-series #forests 🌲
@drmiltiadou.bsky.social

PlotToSat :)
YouTube video by Milto Miltiadou
www.youtube.com
May 24, 2025 at 6:46 PM
This tutorial will guide you through the core functionalities of PlotToSat. It will help you quickly extract Sentinel-1 🛰️ and Sentinel-2 🛰️ time series at multiple plot regions. The centres of the plots are defined in an input .csv file.
#EO #ML #time-series #forests 🌲
@drmiltiadou.bsky.social
#EO #ML #time-series #forests 🌲
@drmiltiadou.bsky.social
Reposted by Jorge A. Giraldo
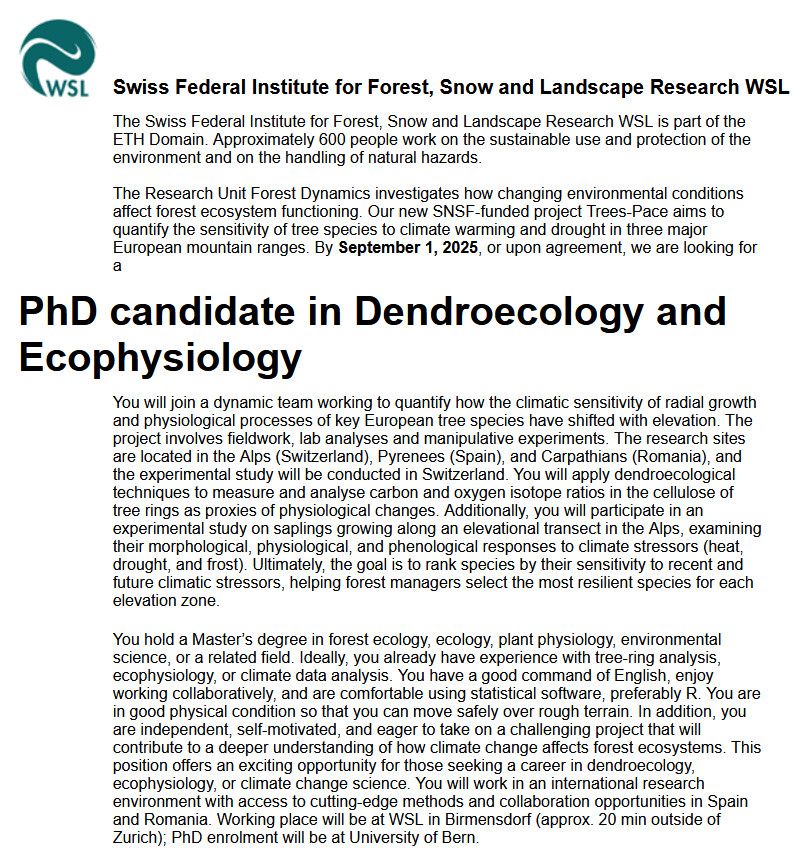
🌲🖥️ #PhDAlert! MSc in a #natural #science & experience with #tree-ring analysis and statistical software (R)? Fluent in English and ready for #fieldwork? Our #forest dynamics #research unit is looking for a #PhD candidate in #dendroecology and #ecophysiology! apply.refline.ch/273855/1736/...
May 14, 2025 at 8:13 AM
🌲🖥️ #PhDAlert! MSc in a #natural #science & experience with #tree-ring analysis and statistical software (R)? Fluent in English and ready for #fieldwork? Our #forest dynamics #research unit is looking for a #PhD candidate in #dendroecology and #ecophysiology! apply.refline.ch/273855/1736/...
Reposted by Jorge A. Giraldo

Please share. We are hiring domestic/international #PhD students to work on citizen science, insect migration/conservation at Monash University in Melbourne, Australia. If interested, please email me. You can find more about our research interests here. shawanchowdhury.com.
April 28, 2025 at 2:15 AM
Please share. We are hiring domestic/international #PhD students to work on citizen science, insect migration/conservation at Monash University in Melbourne, Australia. If interested, please email me. You can find more about our research interests here. shawanchowdhury.com.
Reposted by Jorge A. Giraldo

In my latest interview for @botany.one, @adricorrales.bsky.social reminds us that plants are not alone; they thrive in association with many other organisms such as fungi and bacteria. #SciComm #PlantScience #Botany 🧪🍄 botany.one/2025/04/adri...
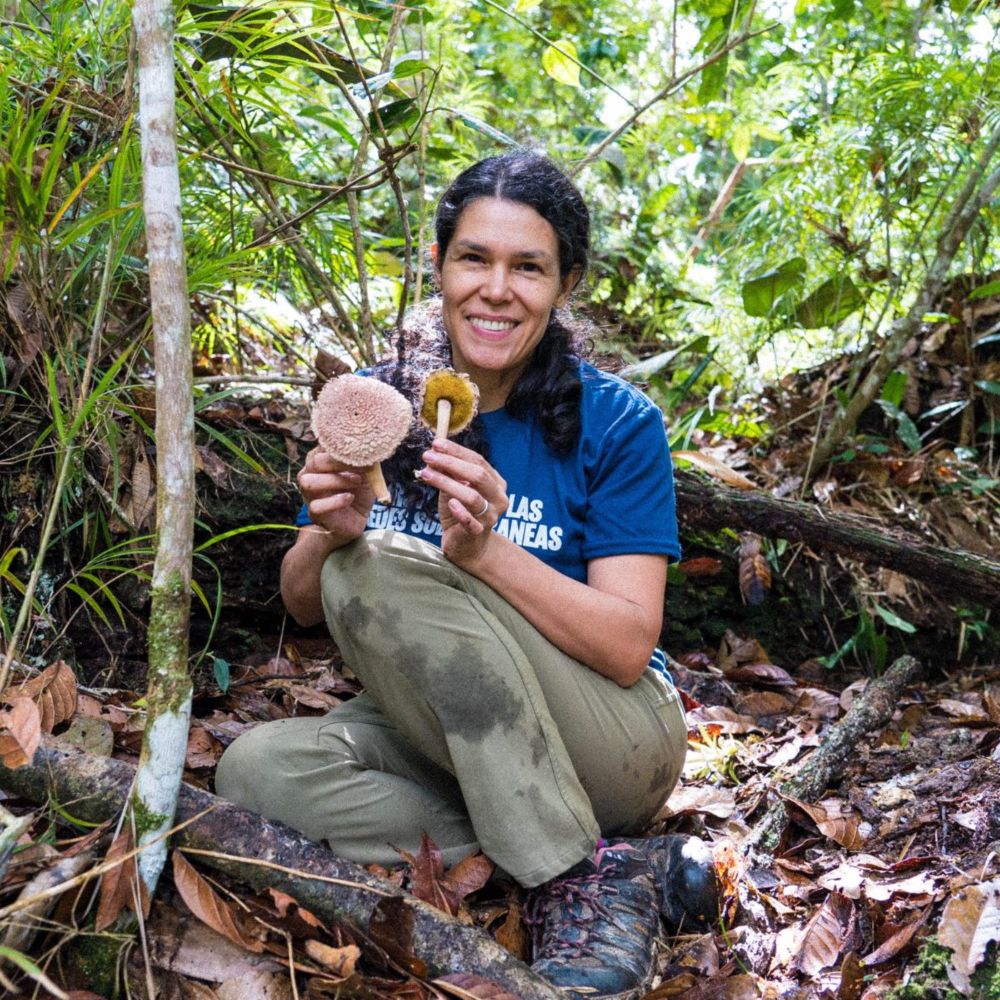
Adriana Corrales: Plants Are Not Alone
Botany One interviews Dr Adriana Corrales, a researcher fascinated with the intricate relationships between plants and fungi.
botany.one
April 22, 2025 at 11:55 AM
In my latest interview for @botany.one, @adricorrales.bsky.social reminds us that plants are not alone; they thrive in association with many other organisms such as fungi and bacteria. #SciComm #PlantScience #Botany 🧪🍄 botany.one/2025/04/adri...
Reposted by Jorge A. Giraldo

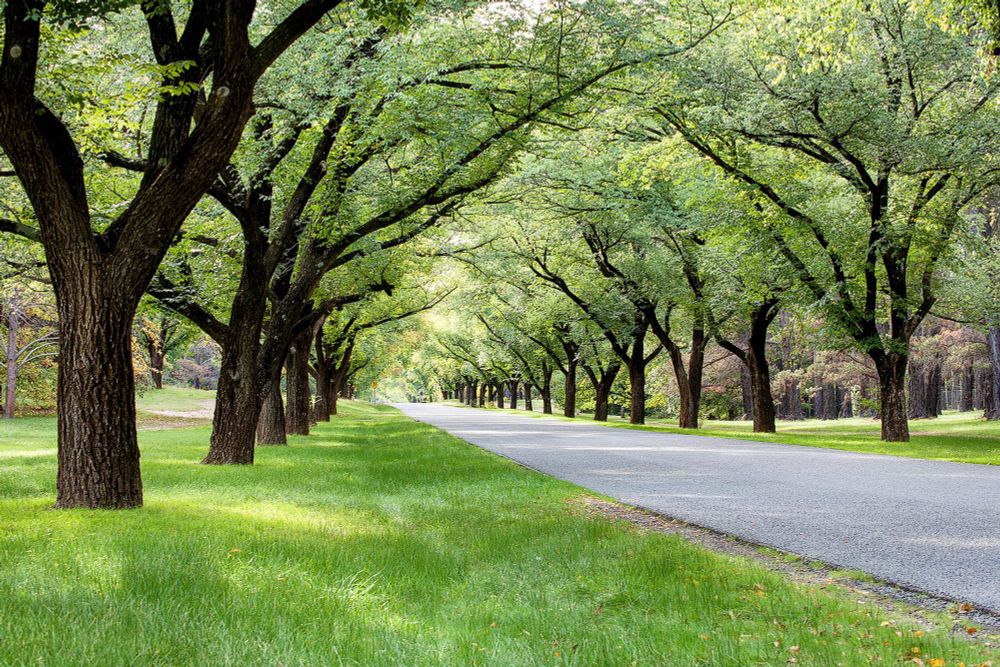
🌳Urban trees keep cooling - even during record-breaking heatwaves! We show that trees maintained high transpiration, defying model predictions. Tree cooling during heat may be underestimated 🌡️💦
Great study led by Christoph Bachofen @wslresearch.bsky.social doi.org/10.1016/j.uf...
Great study led by Christoph Bachofen @wslresearch.bsky.social doi.org/10.1016/j.uf...
April 22, 2025 at 7:52 AM
🌳Urban trees keep cooling - even during record-breaking heatwaves! We show that trees maintained high transpiration, defying model predictions. Tree cooling during heat may be underestimated 🌡️💦
Great study led by Christoph Bachofen @wslresearch.bsky.social doi.org/10.1016/j.uf...
Great study led by Christoph Bachofen @wslresearch.bsky.social doi.org/10.1016/j.uf...
Reposted by Jorge A. Giraldo

Nice commentary and perspective titled 'Challenges and Opportunities in Tropical Dendrochronology for Climate Reconstructions' by Jorge Giraldo et al. on the recent neotropical tree ring paper by @anaigmendez.bsky.social agupubs.onlinelibrary.wiley.com/doi/full/10....

Challenges and Opportunities in Tropical Dendrochronology for Climate Reconstructions
Dendrochronology is applicable in the tropics Several tree species exhibit annual tree rings across diverse environmental conditions The challenge in tropical dendrochronology is to create tree-...
agupubs.onlinelibrary.wiley.com
April 21, 2025 at 5:12 PM
Nice commentary and perspective titled 'Challenges and Opportunities in Tropical Dendrochronology for Climate Reconstructions' by Jorge Giraldo et al. on the recent neotropical tree ring paper by @anaigmendez.bsky.social agupubs.onlinelibrary.wiley.com/doi/full/10....
Reposted by Jorge A. Giraldo

I have written a small R-script to download all tree-ring data from the ITRDB (measurements and chronologies). Anyone can create a local copy, just in case the data might not be available anymore from @noaa.gov
github.com/RonaldVisser...
#dendrochronology #treering #opendata #share
github.com/RonaldVisser...
#dendrochronology #treering #opendata #share

GitHub - RonaldVisser/Download_ITRDB
Contribute to RonaldVisser/Download_ITRDB development by creating an account on GitHub.
github.com
April 20, 2025 at 6:57 PM
I have written a small R-script to download all tree-ring data from the ITRDB (measurements and chronologies). Anyone can create a local copy, just in case the data might not be available anymore from @noaa.gov
github.com/RonaldVisser...
#dendrochronology #treering #opendata #share
github.com/RonaldVisser...
#dendrochronology #treering #opendata #share
Reposted by Jorge A. Giraldo

Many living have their own "tree rings", including fish; the magnificient otolith! Learn more about this fantastic structure in this @theconversation.com article, written by our dear @otolithgirl.bsky.social #otolith #fish #treering #dendrochronology theconversation.com/most-animals...

Most animals have their own version of tree rings – here’s how we biologists use them to help species thrive
From whale earwax to bird feathers, almost all organisms keep a record of their existence.
theconversation.com
February 14, 2025 at 4:52 PM
Many living have their own "tree rings", including fish; the magnificient otolith! Learn more about this fantastic structure in this @theconversation.com article, written by our dear @otolithgirl.bsky.social #otolith #fish #treering #dendrochronology theconversation.com/most-animals...
Reposted by Jorge A. Giraldo

🌲 Sample of the day! 🌲
A late-Holocene subfossil larch from Aletsch Glacier, fresh from the sanding machine! 🥰
Can't wait to measure and date it! 💍⌛
#TreeRing #Dendrochronology #Art
A late-Holocene subfossil larch from Aletsch Glacier, fresh from the sanding machine! 🥰
Can't wait to measure and date it! 💍⌛
#TreeRing #Dendrochronology #Art

April 3, 2025 at 11:43 AM
🌲 Sample of the day! 🌲
A late-Holocene subfossil larch from Aletsch Glacier, fresh from the sanding machine! 🥰
Can't wait to measure and date it! 💍⌛
#TreeRing #Dendrochronology #Art
A late-Holocene subfossil larch from Aletsch Glacier, fresh from the sanding machine! 🥰
Can't wait to measure and date it! 💍⌛
#TreeRing #Dendrochronology #Art
Beautiful wood and tree rings of Albizia guachapele. #TreeRingTuesday #dendro #dendrochronology #TreeRings


April 1, 2025 at 12:57 PM
Beautiful wood and tree rings of Albizia guachapele. #TreeRingTuesday #dendro #dendrochronology #TreeRings
Productive day in the field with great sampling and data collection! #dendrometers #TreeRings
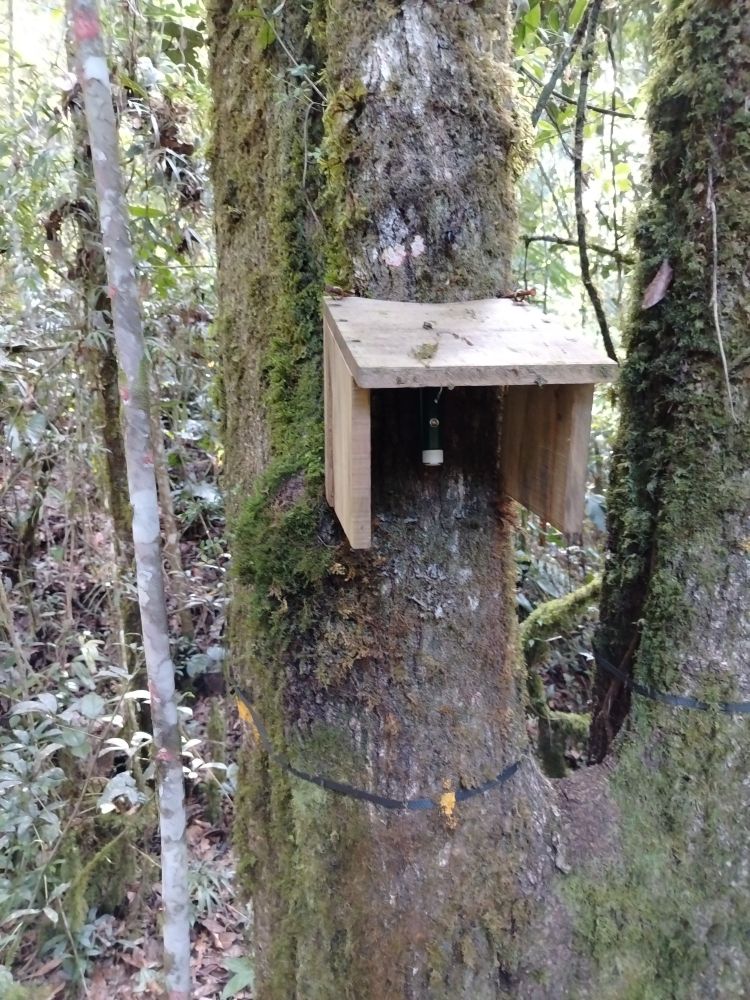

March 27, 2025 at 10:23 AM
Productive day in the field with great sampling and data collection! #dendrometers #TreeRings
Reposted by Jorge A. Giraldo

🌍 PhD student wanted in AI for Climate Extremes 🌿
Heatwaves, droughts, and heavy rain are intensifying—threatening vegetation, forestry, and agriculture. Join us to develop weakly supervised ML to detect and explain climate impacts in satellite data.
Heatwaves, droughts, and heavy rain are intensifying—threatening vegetation, forestry, and agriculture. Join us to develop weakly supervised ML to detect and explain climate impacts in satellite data.

@scadsai.bsky.social offers 34 open topics for Research Associates / PhD Students (f/m/x) within the Graduate School, together with mentors and host institutions. 👩🎓 In the upcoming days, we will introduce you to all of those areas and the corresponding topics.
👉 scads.ai/about-us/job...
👉 scads.ai/about-us/job...

March 23, 2025 at 10:17 PM
🌍 PhD student wanted in AI for Climate Extremes 🌿
Heatwaves, droughts, and heavy rain are intensifying—threatening vegetation, forestry, and agriculture. Join us to develop weakly supervised ML to detect and explain climate impacts in satellite data.
Heatwaves, droughts, and heavy rain are intensifying—threatening vegetation, forestry, and agriculture. Join us to develop weakly supervised ML to detect and explain climate impacts in satellite data.