


Chris Goldammer
@floorarearatio.bsky.social
Urban data, mostly NYC. I'm developing zonedinsights.com -- but in practice, I like to answer any question about NYC, as long as it's in public data. Ask away!
NYC has beautiful and efficient housing due to its zoning setbacks:
1. Front: To put your garbage bins
2. Height: To make the streetscape pretty
3. Side: To give you space to breathe
1. Front: To put your garbage bins
2. Height: To make the streetscape pretty
3. Side: To give you space to breathe


November 18, 2025 at 5:34 PM
NYC has beautiful and efficient housing due to its zoning setbacks:
1. Front: To put your garbage bins
2. Height: To make the streetscape pretty
3. Side: To give you space to breathe
1. Front: To put your garbage bins
2. Height: To make the streetscape pretty
3. Side: To give you space to breathe
Is there potential to combine the Inter-Borough-Express with upzoning?
Showing block-level averages.
First: Number of floors is mostly below 4, often below 1.
Second: The zoned floor-area-ratio is mostly below 4, often below 1.
(you might notice that these maps are similar)
Showing block-level averages.
First: Number of floors is mostly below 4, often below 1.
Second: The zoned floor-area-ratio is mostly below 4, often below 1.
(you might notice that these maps are similar)


November 18, 2025 at 3:38 PM
Is there potential to combine the Inter-Borough-Express with upzoning?
Showing block-level averages.
First: Number of floors is mostly below 4, often below 1.
Second: The zoned floor-area-ratio is mostly below 4, often below 1.
(you might notice that these maps are similar)
Showing block-level averages.
First: Number of floors is mostly below 4, often below 1.
Second: The zoned floor-area-ratio is mostly below 4, often below 1.
(you might notice that these maps are similar)
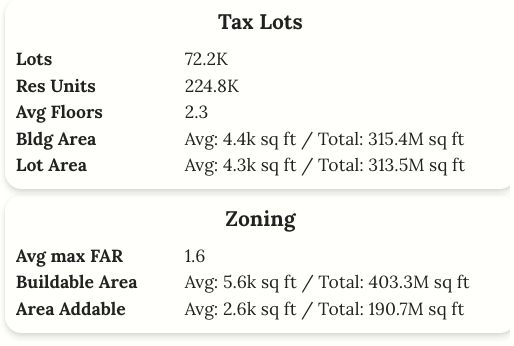
Let's do a quick upzoning analysis of the Inter-Borough-Express.
Within 0.5 miles of the IBX, we have 225,000 units, with average Floor-Area-Ratio of 1.6
If we doubled FAR and assumed that about 50% of the total FAR gets used over 10 years, we'd add:
200,000 units of housing!
🧵
Within 0.5 miles of the IBX, we have 225,000 units, with average Floor-Area-Ratio of 1.6
If we doubled FAR and assumed that about 50% of the total FAR gets used over 10 years, we'd add:
200,000 units of housing!
🧵

November 18, 2025 at 12:57 AM
Let's do a quick upzoning analysis of the Inter-Borough-Express.
Within 0.5 miles of the IBX, we have 225,000 units, with average Floor-Area-Ratio of 1.6
If we doubled FAR and assumed that about 50% of the total FAR gets used over 10 years, we'd add:
200,000 units of housing!
🧵
Within 0.5 miles of the IBX, we have 225,000 units, with average Floor-Area-Ratio of 1.6
If we doubled FAR and assumed that about 50% of the total FAR gets used over 10 years, we'd add:
200,000 units of housing!
🧵
In public projects we often make decisions based on some number, but that number is almost impossible to validate.
An example: IBX in NYC is estimated to have daily ridership of 115,000.
What assumptions go into this? I went through a 1,077 page report and still don't know.
An example: IBX in NYC is estimated to have daily ridership of 115,000.
What assumptions go into this? I went through a 1,077 page report and still don't know.

November 15, 2025 at 10:51 PM
In public projects we often make decisions based on some number, but that number is almost impossible to validate.
An example: IBX in NYC is estimated to have daily ridership of 115,000.
What assumptions go into this? I went through a 1,077 page report and still don't know.
An example: IBX in NYC is estimated to have daily ridership of 115,000.
What assumptions go into this? I went through a 1,077 page report and still don't know.
Lots of discussion of the Inter-Borough-Express (IBX) in NYC.
But I couldn't find a way to analyze the route on a map.
So I created a dataset of the route and stops. Feedback welcome!
Unofficial and using some hand coding, so give me feedback!
github.com/cgoldammer/i...
But I couldn't find a way to analyze the route on a map.
So I created a dataset of the route and stops. Feedback welcome!
Unofficial and using some hand coding, so give me feedback!
github.com/cgoldammer/i...

November 13, 2025 at 12:03 AM
Lots of discussion of the Inter-Borough-Express (IBX) in NYC.
But I couldn't find a way to analyze the route on a map.
So I created a dataset of the route and stops. Feedback welcome!
Unofficial and using some hand coding, so give me feedback!
github.com/cgoldammer/i...
But I couldn't find a way to analyze the route on a map.
So I created a dataset of the route and stops. Feedback welcome!
Unofficial and using some hand coding, so give me feedback!
github.com/cgoldammer/i...
Many people believe that a major driver for the NYC affordability crisis are townhouse conversions that decrease units.
This exists, but:
1. Alterations + dominate -
2. Alterations (+ and - together) are dominated by new construction (>20K/year).
Own chart, Housing DB
This exists, but:
1. Alterations + dominate -
2. Alterations (+ and - together) are dominated by new construction (>20K/year).
Own chart, Housing DB

November 10, 2025 at 9:15 PM
Many people believe that a major driver for the NYC affordability crisis are townhouse conversions that decrease units.
This exists, but:
1. Alterations + dominate -
2. Alterations (+ and - together) are dominated by new construction (>20K/year).
Own chart, Housing DB
This exists, but:
1. Alterations + dominate -
2. Alterations (+ and - together) are dominated by new construction (>20K/year).
Own chart, Housing DB
How much of your NYC neighborhood has been rezoned?
- ULURP actions since 1996
- % of units by neighborhood
- Warning: Many of these rezonings might be minor.
- This doesn't include changes through the zoning code (e.g. the contextual downzoning)
- ULURP actions since 1996
- % of units by neighborhood
- Warning: Many of these rezonings might be minor.
- This doesn't include changes through the zoning code (e.g. the contextual downzoning)

November 6, 2025 at 11:00 PM
How much of your NYC neighborhood has been rezoned?
- ULURP actions since 1996
- % of units by neighborhood
- Warning: Many of these rezonings might be minor.
- This doesn't include changes through the zoning code (e.g. the contextual downzoning)
- ULURP actions since 1996
- % of units by neighborhood
- Warning: Many of these rezonings might be minor.
- This doesn't include changes through the zoning code (e.g. the contextual downzoning)
Are there narrower homes in NYC? This lot is 9.5 ft.
Challenge accepted, lots of links to cute houses in thread.
If we restricted to residential units with lot frontage less than 11 ft, we get 88 results (link below).
🧵
Challenge accepted, lots of links to cute houses in thread.
If we restricted to residential units with lot frontage less than 11 ft, we get 88 results (link below).
🧵

The narrowest home in NYC (by many accounts) hits the market -- for a not-so-tiny price tag. Our latest Exclusive. Take a peek inside. #tinyhouses #tinyhouse #nycrealestate #greenwichvillage #manhattanrealestate #historichomes www.nytimes.com/2025/11/03/r...

A Famous Narrow House in the West Village Listed for $4.195 Million
www.nytimes.com
November 6, 2025 at 3:05 PM
Are there narrower homes in NYC? This lot is 9.5 ft.
Challenge accepted, lots of links to cute houses in thread.
If we restricted to residential units with lot frontage less than 11 ft, we get 88 results (link below).
🧵
Challenge accepted, lots of links to cute houses in thread.
If we restricted to residential units with lot frontage less than 11 ft, we get 88 results (link below).
🧵
Has anyone seen impact estimates for the NYC housing ballot questions? I hear quotes that it's a big deal, and I hope that's true, but do we have data?
November 5, 2025 at 11:00 PM
Has anyone seen impact estimates for the NYC housing ballot questions? I hear quotes that it's a big deal, and I hope that's true, but do we have data?
We've got live feeds for NYC!
Permits, sales, much more coming soon. Notifications coming soon! Beta, so give me feedback if stuff is going wrong. Will improve quickly!
citytracker.ai
Permits, sales, much more coming soon. Notifications coming soon! Beta, so give me feedback if stuff is going wrong. Will improve quickly!
citytracker.ai
November 5, 2025 at 7:49 PM
We've got live feeds for NYC!
Permits, sales, much more coming soon. Notifications coming soon! Beta, so give me feedback if stuff is going wrong. Will improve quickly!
citytracker.ai
Permits, sales, much more coming soon. Notifications coming soon! Beta, so give me feedback if stuff is going wrong. Will improve quickly!
citytracker.ai
The "noise" section is instructive, mandated by CEQR.
Result: "Increases of these magnitudes would not be perceptible".
But ... to get there, we required repeated in-person measurement and complex analysis.
We should be able to predict this result! It's pretty obvious.
Result: "Increases of these magnitudes would not be perceptible".
But ... to get there, we required repeated in-person measurement and complex analysis.
We should be able to predict this result! It's pretty obvious.
The City council's recent mailers talk about the "730 days" for City and Environmental Reviews.
So let's look at the environmental assessment for a recent "controversial" rezoning, Arrow Linen. 244 units in Brooklyn.
7 versions over 3 years, latest at 289 pages. Contents in image.
A 🧵
So let's look at the environmental assessment for a recent "controversial" rezoning, Arrow Linen. 244 units in Brooklyn.
7 versions over 3 years, latest at 289 pages. Contents in image.
A 🧵

November 3, 2025 at 3:37 PM
The "noise" section is instructive, mandated by CEQR.
Result: "Increases of these magnitudes would not be perceptible".
But ... to get there, we required repeated in-person measurement and complex analysis.
We should be able to predict this result! It's pretty obvious.
Result: "Increases of these magnitudes would not be perceptible".
But ... to get there, we required repeated in-person measurement and complex analysis.
We should be able to predict this result! It's pretty obvious.
The City council's recent mailers talk about the "730 days" for City and Environmental Reviews.
So let's look at the environmental assessment for a recent "controversial" rezoning, Arrow Linen. 244 units in Brooklyn.
7 versions over 3 years, latest at 289 pages. Contents in image.
A 🧵
So let's look at the environmental assessment for a recent "controversial" rezoning, Arrow Linen. 244 units in Brooklyn.
7 versions over 3 years, latest at 289 pages. Contents in image.
A 🧵
November 3, 2025 at 10:38 AM
The City council's recent mailers talk about the "730 days" for City and Environmental Reviews.
So let's look at the environmental assessment for a recent "controversial" rezoning, Arrow Linen. 244 units in Brooklyn.
7 versions over 3 years, latest at 289 pages. Contents in image.
A 🧵
So let's look at the environmental assessment for a recent "controversial" rezoning, Arrow Linen. 244 units in Brooklyn.
7 versions over 3 years, latest at 289 pages. Contents in image.
A 🧵
I'd love to see the source for this calculation.
Is the 730 days the ULURP process (filing => approval)? I'm getting very different answers.
(Not commenting on the politics of it for now)
Is the 730 days the ULURP process (filing => approval)? I'm getting very different answers.
(Not commenting on the politics of it for now)

November 2, 2025 at 7:07 PM
I'd love to see the source for this calculation.
Is the 730 days the ULURP process (filing => approval)? I'm getting very different answers.
(Not commenting on the politics of it for now)
Is the 730 days the ULURP process (filing => approval)? I'm getting very different answers.
(Not commenting on the politics of it for now)
There's nothing scarier than bad land usage.


November 2, 2025 at 11:49 AM
There's nothing scarier than bad land usage.
Some more examples:
Buildings in NYC with 1-2 floors in locations with price per square foot above $1,500.
Feast your eyes on this land use!
Buildings in NYC with 1-2 floors in locations with price per square foot above $1,500.
Feast your eyes on this land use!


November 1, 2025 at 11:24 PM
Some more examples:
Buildings in NYC with 1-2 floors in locations with price per square foot above $1,500.
Feast your eyes on this land use!
Buildings in NYC with 1-2 floors in locations with price per square foot above $1,500.
Feast your eyes on this land use!
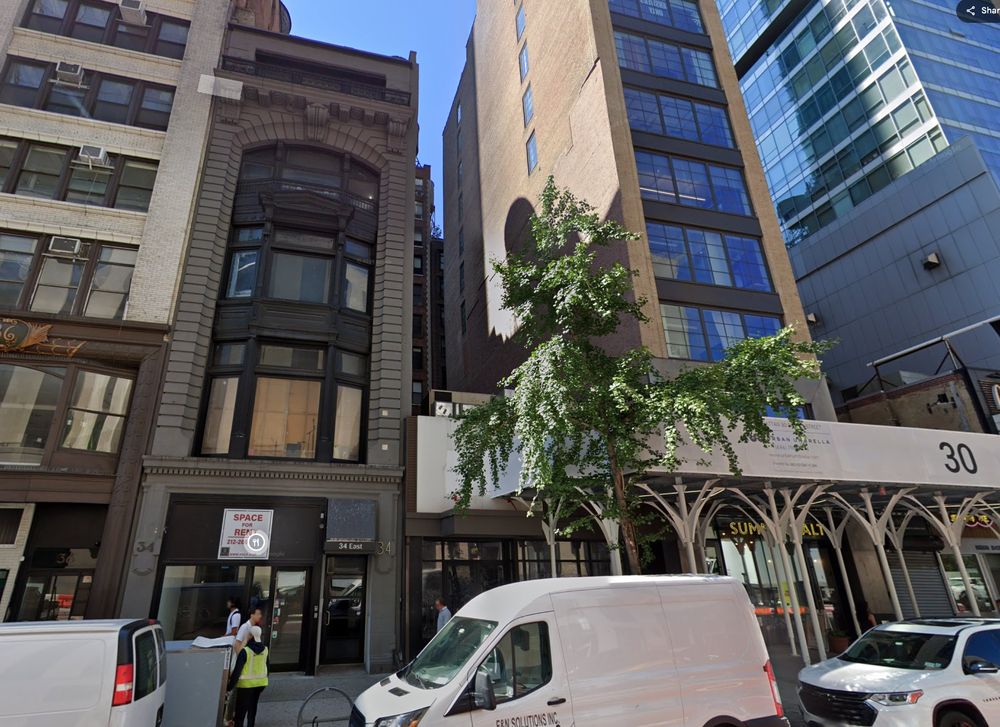
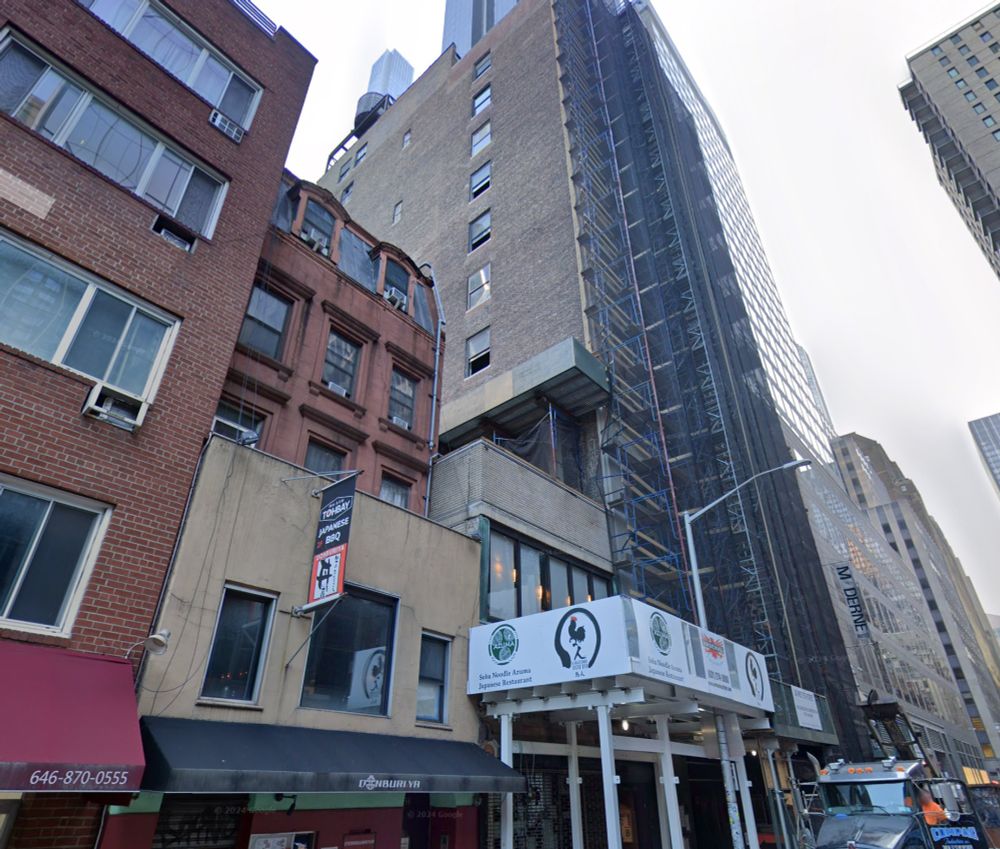
One of my favorite filters for NYC real estate:
Buildings with 1-2 floors in great locations: Predicted price per square foot above $1,000
There is 5,700 of them, excluding parking lots, churches, etc.
Examples in 🧵
Buildings with 1-2 floors in great locations: Predicted price per square foot above $1,000
There is 5,700 of them, excluding parking lots, churches, etc.
Examples in 🧵
October 31, 2025 at 10:11 PM
One of my favorite filters for NYC real estate:
Buildings with 1-2 floors in great locations: Predicted price per square foot above $1,000
There is 5,700 of them, excluding parking lots, churches, etc.
Examples in 🧵
Buildings with 1-2 floors in great locations: Predicted price per square foot above $1,000
There is 5,700 of them, excluding parking lots, churches, etc.
Examples in 🧵
Common in news reports: "We did urbanism (e.g. super-blocks in Barcelona), and rents increased by 20%. Bad, now it's no longer affordable".
Better framing: We found a cheap way of making a block 20% better. So let's do that everywhere, to get the benefits without displacement!
Better framing: We found a cheap way of making a block 20% better. So let's do that everywhere, to get the benefits without displacement!
October 31, 2025 at 6:40 PM
Common in news reports: "We did urbanism (e.g. super-blocks in Barcelona), and rents increased by 20%. Bad, now it's no longer affordable".
Better framing: We found a cheap way of making a block 20% better. So let's do that everywhere, to get the benefits without displacement!
Better framing: We found a cheap way of making a block 20% better. So let's do that everywhere, to get the benefits without displacement!
The application in Staten Island give us a good illustration of how neighborhoods change.
A developer said: We can turn 2 dwelling units into 10 (or 15, stylized timeline in image).
Other developers likely ... wait and see until new comps are set. *If* that's good, development explodes.
A developer said: We can turn 2 dwelling units into 10 (or 15, stylized timeline in image).
Other developers likely ... wait and see until new comps are set. *If* that's good, development explodes.

October 29, 2025 at 3:03 PM
The application in Staten Island give us a good illustration of how neighborhoods change.
A developer said: We can turn 2 dwelling units into 10 (or 15, stylized timeline in image).
Other developers likely ... wait and see until new comps are set. *If* that's good, development explodes.
A developer said: We can turn 2 dwelling units into 10 (or 15, stylized timeline in image).
Other developers likely ... wait and see until new comps are set. *If* that's good, development explodes.
In previous posts, I exaggerated and called the city of yes opposition in Staten Island a “protest”, but the actual protest has since happened! With mayoral candidate and all!
www.silive.com/news/2025/10...
www.silive.com/news/2025/10...

Elected officials, Sliwa slam first potential ‘City of Yes’ development on Staten Island
"What the City of Yes is, is the biggest giveaway to developers you’ve ever seen in the city’s history, with very little community input.”
www.silive.com
October 26, 2025 at 5:53 PM
In previous posts, I exaggerated and called the city of yes opposition in Staten Island a “protest”, but the actual protest has since happened! With mayoral candidate and all!
www.silive.com/news/2025/10...
www.silive.com/news/2025/10...
This city of yes application in Staten Island (see recent posts) is fascinating: 1 building => 5 buildings, 2 dwelling units => up to 15.
If this holds up, it should be possible almost anywhere in the neighborhood, see qualifying lots in image.
If this holds up, it should be possible almost anywhere in the neighborhood, see qualifying lots in image.

October 24, 2025 at 1:58 PM
This city of yes application in Staten Island (see recent posts) is fascinating: 1 building => 5 buildings, 2 dwelling units => up to 15.
If this holds up, it should be possible almost anywhere in the neighborhood, see qualifying lots in image.
If this holds up, it should be possible almost anywhere in the neighborhood, see qualifying lots in image.
Why are we seeing City of Yes protests in Staten Island?
It's because of how transit-oriented development (TOD) was handled, requiring a 5,000 sq ft lot. Common in SI, rare elsewhere.
The map shows % of lots that qualify for TOD
Thanks @3underscores.bsky.social for the lead!
It's because of how transit-oriented development (TOD) was handled, requiring a 5,000 sq ft lot. Common in SI, rare elsewhere.
The map shows % of lots that qualify for TOD
Thanks @3underscores.bsky.social for the lead!

October 23, 2025 at 9:42 PM
Why are we seeing City of Yes protests in Staten Island?
It's because of how transit-oriented development (TOD) was handled, requiring a 5,000 sq ft lot. Common in SI, rare elsewhere.
The map shows % of lots that qualify for TOD
Thanks @3underscores.bsky.social for the lead!
It's because of how transit-oriented development (TOD) was handled, requiring a 5,000 sq ft lot. Common in SI, rare elsewhere.
The map shows % of lots that qualify for TOD
Thanks @3underscores.bsky.social for the lead!
New housing and rent, V2: In places like NYC, we restricted supply (e.g. 1961 zoning), green -> purple.
If demand increases, we'll see sky-high rents. So it's "causing" high rents, right?
No! It's satisfying formerly unmet demand.
But the restrictions make this correlation *more* misleading.
If demand increases, we'll see sky-high rents. So it's "causing" high rents, right?
No! It's satisfying formerly unmet demand.
But the restrictions make this correlation *more* misleading.

October 22, 2025 at 9:38 AM
New housing and rent, V2: In places like NYC, we restricted supply (e.g. 1961 zoning), green -> purple.
If demand increases, we'll see sky-high rents. So it's "causing" high rents, right?
No! It's satisfying formerly unmet demand.
But the restrictions make this correlation *more* misleading.
If demand increases, we'll see sky-high rents. So it's "causing" high rents, right?
No! It's satisfying formerly unmet demand.
But the restrictions make this correlation *more* misleading.
NYC runs on steam. And even in 2024, there's still a good business from getting people connected.
On the left is the district steam system, run by ConEd.
On the right are ConEd's business leads.
On the left is the district steam system, run by ConEd.
On the right are ConEd's business leads.


October 21, 2025 at 1:54 PM
NYC runs on steam. And even in 2024, there's still a good business from getting people connected.
On the left is the district steam system, run by ConEd.
On the right are ConEd's business leads.
On the left is the district steam system, run by ConEd.
On the right are ConEd's business leads.
NYC property taxes:
Step 1: Do the inverse of a land value tax: lower taxes for lower density.
=> Not enough housing and vacant plots
=> Step 2: We need tax incentive program to build more, but it’s not so well designed
=> We get *some* large buildings, at exactly 99 units, nothing bigger
Step 1: Do the inverse of a land value tax: lower taxes for lower density.
=> Not enough housing and vacant plots
=> Step 2: We need tax incentive program to build more, but it’s not so well designed
=> We get *some* large buildings, at exactly 99 units, nothing bigger
October 20, 2025 at 4:14 PM
NYC property taxes:
Step 1: Do the inverse of a land value tax: lower taxes for lower density.
=> Not enough housing and vacant plots
=> Step 2: We need tax incentive program to build more, but it’s not so well designed
=> We get *some* large buildings, at exactly 99 units, nothing bigger
Step 1: Do the inverse of a land value tax: lower taxes for lower density.
=> Not enough housing and vacant plots
=> Step 2: We need tax incentive program to build more, but it’s not so well designed
=> We get *some* large buildings, at exactly 99 units, nothing bigger
The NYC property tax system is unequal *by design*.
The baseline effective tax rate for residential buildings (assessment rate x tax rate)
Class 1 (1-3 units) = 1.2%
Class 2 (> 3 units) = 5.6%
Example in image per CSS report:
The baseline effective tax rate for residential buildings (assessment rate x tax rate)
Class 1 (1-3 units) = 1.2%
Class 2 (> 3 units) = 5.6%
Example in image per CSS report:

October 20, 2025 at 11:32 AM
The NYC property tax system is unequal *by design*.
The baseline effective tax rate for residential buildings (assessment rate x tax rate)
Class 1 (1-3 units) = 1.2%
Class 2 (> 3 units) = 5.6%
Example in image per CSS report:
The baseline effective tax rate for residential buildings (assessment rate x tax rate)
Class 1 (1-3 units) = 1.2%
Class 2 (> 3 units) = 5.6%
Example in image per CSS report: