


Chris Goldammer
@floorarearatio.bsky.social
Urban data, mostly NYC. I'm developing citytracker.ai -- but in practice, I like to answer any question about NYC, as long as it's in public data. Ask away!
New ADU permit detected: 19 Truman St in Staten Island.
This is a basement unit, with an approved zoning document (ZD1).
CityTracker link to see updates: citytracker.ai/results/publ...
More details coming soon!
This is a basement unit, with an approved zoning document (ZD1).
CityTracker link to see updates: citytracker.ai/results/publ...
More details coming soon!


December 9, 2025 at 3:26 PM
New ADU permit detected: 19 Truman St in Staten Island.
This is a basement unit, with an approved zoning document (ZD1).
CityTracker link to see updates: citytracker.ai/results/publ...
More details coming soon!
This is a basement unit, with an approved zoning document (ZD1).
CityTracker link to see updates: citytracker.ai/results/publ...
More details coming soon!
The first season of the Netflix show "The Beast In Me" crucially involves a decision around (what looks like) a rezoning vote for a multi-billion mixed-use project in Manhattan.
Let's try to understand the situation of the NYC council member. All quotes except the last are from him.
🧵
Let's try to understand the situation of the NYC council member. All quotes except the last are from him.
🧵

December 9, 2025 at 12:52 AM
The first season of the Netflix show "The Beast In Me" crucially involves a decision around (what looks like) a rezoning vote for a multi-billion mixed-use project in Manhattan.
Let's try to understand the situation of the NYC council member. All quotes except the last are from him.
🧵
Let's try to understand the situation of the NYC council member. All quotes except the last are from him.
🧵
Let's wrap up 2025!
Sometimes you just want to understand how NYC is changing.
So I added the "Recap" tab, for any filter.
Afterwards, you want to see it on a map, and look at individual alterations in detail.
This is running live, and free to use, at citytracker.ai/results
Sometimes you just want to understand how NYC is changing.
So I added the "Recap" tab, for any filter.
Afterwards, you want to see it on a map, and look at individual alterations in detail.
This is running live, and free to use, at citytracker.ai/results


December 8, 2025 at 5:15 PM
Let's wrap up 2025!
Sometimes you just want to understand how NYC is changing.
So I added the "Recap" tab, for any filter.
Afterwards, you want to see it on a map, and look at individual alterations in detail.
This is running live, and free to use, at citytracker.ai/results
Sometimes you just want to understand how NYC is changing.
So I added the "Recap" tab, for any filter.
Afterwards, you want to see it on a map, and look at individual alterations in detail.
This is running live, and free to use, at citytracker.ai/results
A pattern in housing policy, e.g. measure ULA in LA:
- City passes law with benefits and downsides
- City doesn't evaluate
- Evaluation from independent researchers like
Mottsmith
- Laws (maybe) get adjusted, long overdue, if they look bad
We should do better!
(More about NYC in upcoming thread)
- City passes law with benefits and downsides
- City doesn't evaluate
- Evaluation from independent researchers like
Mottsmith
- Laws (maybe) get adjusted, long overdue, if they look bad
We should do better!
(More about NYC in upcoming thread)
December 8, 2025 at 4:16 PM
A pattern in housing policy, e.g. measure ULA in LA:
- City passes law with benefits and downsides
- City doesn't evaluate
- Evaluation from independent researchers like
Mottsmith
- Laws (maybe) get adjusted, long overdue, if they look bad
We should do better!
(More about NYC in upcoming thread)
- City passes law with benefits and downsides
- City doesn't evaluate
- Evaluation from independent researchers like
Mottsmith
- Laws (maybe) get adjusted, long overdue, if they look bad
We should do better!
(More about NYC in upcoming thread)
Trying to better understand the NYC charter changes from the recent passed ballot questions.
Here's my infographic for Q2: "Fast Track Affordable Housing to Build More Affordable Housing Across the City"
Feedback welcome!
Here's my infographic for Q2: "Fast Track Affordable Housing to Build More Affordable Housing Across the City"
Feedback welcome!

December 5, 2025 at 3:55 PM
Trying to better understand the NYC charter changes from the recent passed ballot questions.
Here's my infographic for Q2: "Fast Track Affordable Housing to Build More Affordable Housing Across the City"
Feedback welcome!
Here's my infographic for Q2: "Fast Track Affordable Housing to Build More Affordable Housing Across the City"
Feedback welcome!
The climate change energy trifecta for NYC permits:
Solar panels, Heat pumps, Batteries.
Solar panels, Heat pumps, Batteries.


December 4, 2025 at 6:00 PM
The climate change energy trifecta for NYC permits:
Solar panels, Heat pumps, Batteries.
Solar panels, Heat pumps, Batteries.
People seem to like the block-level maps of NYC.
The goal is that is that you can create these yourself.
For any search: See the whole city, then the blocks, then the lots.
Coming soon!
The goal is that is that you can create these yourself.
For any search: See the whole city, then the blocks, then the lots.
Coming soon!
December 3, 2025 at 11:37 PM
People seem to like the block-level maps of NYC.
The goal is that is that you can create these yourself.
For any search: See the whole city, then the blocks, then the lots.
Coming soon!
The goal is that is that you can create these yourself.
For any search: See the whole city, then the blocks, then the lots.
Coming soon!
The investigation into townhouse conversion continues.
This one at 124 W 31st, went from 12 units to 1, at 2,842 sq ft.
With its own Instagram ad instagram.com/reel/DOGxasG... and already under contract for $3.5M.
This one at 124 W 31st, went from 12 units to 1, at 2,842 sq ft.
With its own Instagram ad instagram.com/reel/DOGxasG... and already under contract for $3.5M.

December 3, 2025 at 2:45 PM
The investigation into townhouse conversion continues.
This one at 124 W 31st, went from 12 units to 1, at 2,842 sq ft.
With its own Instagram ad instagram.com/reel/DOGxasG... and already under contract for $3.5M.
This one at 124 W 31st, went from 12 units to 1, at 2,842 sq ft.
With its own Instagram ad instagram.com/reel/DOGxasG... and already under contract for $3.5M.
We've been talking a lot about the dreaded townhouse conversions: 2-3 units becoming one unit
Where are these happening?
The pattern is clear once we look at it on the block level and overlay historic districts.
Where are these happening?
The pattern is clear once we look at it on the block level and overlay historic districts.

December 2, 2025 at 10:31 PM
We've been talking a lot about the dreaded townhouse conversions: 2-3 units becoming one unit
Where are these happening?
The pattern is clear once we look at it on the block level and overlay historic districts.
Where are these happening?
The pattern is clear once we look at it on the block level and overlay historic districts.
New Construction filings (markers) and historic districts (yellow) in Brooklyn.
They clearly don't like each other!
They clearly don't like each other!

November 29, 2025 at 3:08 PM
New Construction filings (markers) and historic districts (yellow) in Brooklyn.
They clearly don't like each other!
They clearly don't like each other!
On moving chains, and the Honolulu paper, "The Downmarket Impact ... " (links below)
Why is this relevant? It's a common belief that market-rate housing has *no* benefits for non-rich people.
These benefits are indirect, from moving chains, and the article provides evidence for these benefits.
Why is this relevant? It's a common belief that market-rate housing has *no* benefits for non-rich people.
These benefits are indirect, from moving chains, and the article provides evidence for these benefits.

November 29, 2025 at 1:27 AM
On moving chains, and the Honolulu paper, "The Downmarket Impact ... " (links below)
Why is this relevant? It's a common belief that market-rate housing has *no* benefits for non-rich people.
These benefits are indirect, from moving chains, and the article provides evidence for these benefits.
Why is this relevant? It's a common belief that market-rate housing has *no* benefits for non-rich people.
These benefits are indirect, from moving chains, and the article provides evidence for these benefits.
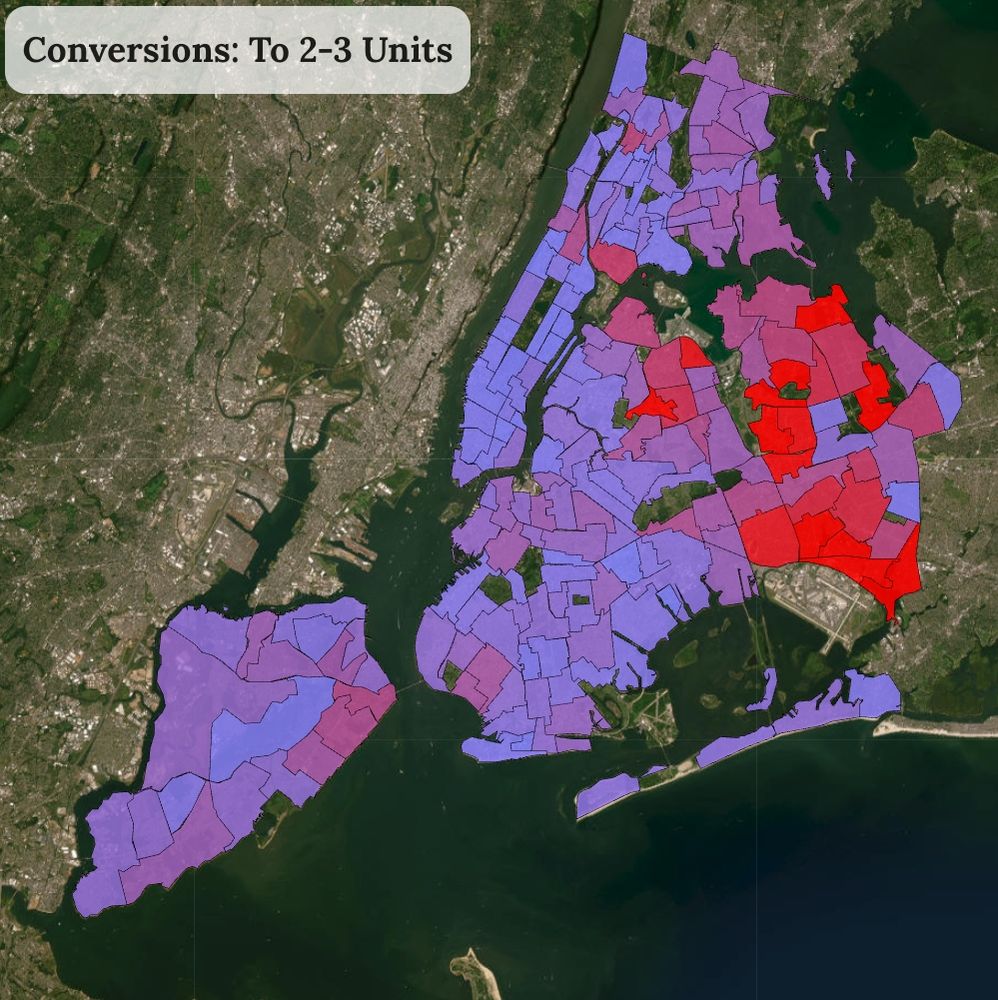
Where are we adding or removing units through alterations?
First image: From 2-3 units to 1 unit. Congratulations to the Upper East Side, Park Slope, and Homecrest.
Second Image: 1-Unit to 2-3 units. The outer boroughs are adding units!
First image: From 2-3 units to 1 unit. Congratulations to the Upper East Side, Park Slope, and Homecrest.
Second Image: 1-Unit to 2-3 units. The outer boroughs are adding units!

November 28, 2025 at 4:14 PM
Where are we adding or removing units through alterations?
First image: From 2-3 units to 1 unit. Congratulations to the Upper East Side, Park Slope, and Homecrest.
Second Image: 1-Unit to 2-3 units. The outer boroughs are adding units!
First image: From 2-3 units to 1 unit. Congratulations to the Upper East Side, Park Slope, and Homecrest.
Second Image: 1-Unit to 2-3 units. The outer boroughs are adding units!
I’ve heard this argument: “A big problem with upzoning is that we get new development that reduces units, e.g. pencil towers for the super-rich”
In practice, for NYC: New development increases units dramatically:
2.4 => 10.2
Data: PLUTO 2018-2024
In practice, for NYC: New development increases units dramatically:
2.4 => 10.2
Data: PLUTO 2018-2024
November 27, 2025 at 1:41 AM
I’ve heard this argument: “A big problem with upzoning is that we get new development that reduces units, e.g. pencil towers for the super-rich”
In practice, for NYC: New development increases units dramatically:
2.4 => 10.2
Data: PLUTO 2018-2024
In practice, for NYC: New development increases units dramatically:
2.4 => 10.2
Data: PLUTO 2018-2024
Want to understand *where* NYC permits are happening?
- Solar panels: Outer boroughs
- Sheds and scaffolding: Dense neighborhoods
- Plumbing: Manhattan
Filter by anything, and every filter becomes a map.
Coming soon:
citytracker.ai
- Solar panels: Outer boroughs
- Sheds and scaffolding: Dense neighborhoods
- Plumbing: Manhattan
Filter by anything, and every filter becomes a map.
Coming soon:
citytracker.ai


November 26, 2025 at 6:05 PM
Want to understand *where* NYC permits are happening?
- Solar panels: Outer boroughs
- Sheds and scaffolding: Dense neighborhoods
- Plumbing: Manhattan
Filter by anything, and every filter becomes a map.
Coming soon:
citytracker.ai
- Solar panels: Outer boroughs
- Sheds and scaffolding: Dense neighborhoods
- Plumbing: Manhattan
Filter by anything, and every filter becomes a map.
Coming soon:
citytracker.ai
In public discussion about parking, we take socialism for granted.
When people worry about parking, they invariably think of "free" street parking, subsidized by the government. Or about requiring parking lots for *others*, to not affect existing street parking.
When people worry about parking, they invariably think of "free" street parking, subsidized by the government. Or about requiring parking lots for *others*, to not affect existing street parking.
November 26, 2025 at 5:35 PM
In public discussion about parking, we take socialism for granted.
When people worry about parking, they invariably think of "free" street parking, subsidized by the government. Or about requiring parking lots for *others*, to not affect existing street parking.
When people worry about parking, they invariably think of "free" street parking, subsidized by the government. Or about requiring parking lots for *others*, to not affect existing street parking.
A recommendation for the MTA to increase support for the Inter-Borough-Express.
Many people doubt that this corridor will have lots of demand.
Commonly cited is this number: "115,000 daily riders".
But ... you're not helping us understand *how* you got to this estimate.
Many people doubt that this corridor will have lots of demand.
Commonly cited is this number: "115,000 daily riders".
But ... you're not helping us understand *how* you got to this estimate.

November 23, 2025 at 10:28 PM
A recommendation for the MTA to increase support for the Inter-Borough-Express.
Many people doubt that this corridor will have lots of demand.
Commonly cited is this number: "115,000 daily riders".
But ... you're not helping us understand *how* you got to this estimate.
Many people doubt that this corridor will have lots of demand.
Commonly cited is this number: "115,000 daily riders".
But ... you're not helping us understand *how* you got to this estimate.
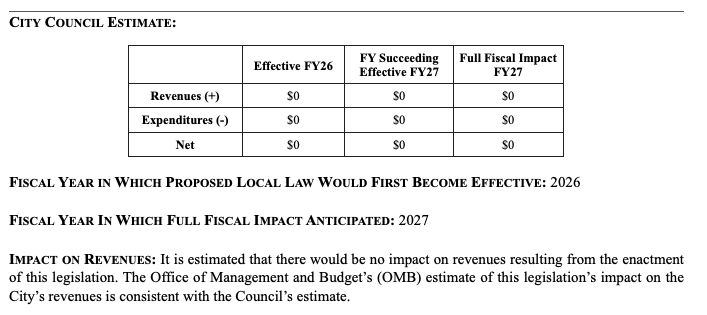
The estimated fiscal cost for the Community Opportunity to Purchase Act bill (902) that mandates a 6-month option to buy for qualifying organizations.
This just feels like it's not even trying:
1. A delay mechanically reduces transfer taxes
2. Sales prices (=> prop taxes) should go down
This just feels like it's not even trying:
1. A delay mechanically reduces transfer taxes
2. Sales prices (=> prop taxes) should go down
November 20, 2025 at 12:58 PM
The estimated fiscal cost for the Community Opportunity to Purchase Act bill (902) that mandates a 6-month option to buy for qualifying organizations.
This just feels like it's not even trying:
1. A delay mechanically reduces transfer taxes
2. Sales prices (=> prop taxes) should go down
This just feels like it's not even trying:
1. A delay mechanically reduces transfer taxes
2. Sales prices (=> prop taxes) should go down
Does anyone have more context on the proposed "FIRST OPPORTUNITY TO PURCHASE" (TOPA) bill from the NYC council?
It feels *extremely* impactful, creating a 6-month additional process for *all* sales of buildings with 3 or more units.
But maybe I'm misreading?
Legislation in link (attachment 2)
It feels *extremely* impactful, creating a 6-month additional process for *all* sales of buildings with 3 or more units.
But maybe I'm misreading?
Legislation in link (attachment 2)
The New York City Council - File #: Int 0902-2024
Title: A Local Law to amend the administrative code of the city of New York, in relation to giving qualified entities a first opportunity to purchase and an opportunity to submit an offer to purchase ...
legistar.council.nyc.gov
November 20, 2025 at 2:29 AM
Does anyone have more context on the proposed "FIRST OPPORTUNITY TO PURCHASE" (TOPA) bill from the NYC council?
It feels *extremely* impactful, creating a 6-month additional process for *all* sales of buildings with 3 or more units.
But maybe I'm misreading?
Legislation in link (attachment 2)
It feels *extremely* impactful, creating a 6-month additional process for *all* sales of buildings with 3 or more units.
But maybe I'm misreading?
Legislation in link (attachment 2)
We're ready to track NYC:
Sales, filings, permits.
Work types galore.
Everything's linked and tagged.
Log in to save your searches.
Vast majority of features are free.
citytracker.ai
Track away, and give me feedback!
Sales, filings, permits.
Work types galore.
Everything's linked and tagged.
Log in to save your searches.
Vast majority of features are free.
citytracker.ai
Track away, and give me feedback!
November 19, 2025 at 10:35 PM
We're ready to track NYC:
Sales, filings, permits.
Work types galore.
Everything's linked and tagged.
Log in to save your searches.
Vast majority of features are free.
citytracker.ai
Track away, and give me feedback!
Sales, filings, permits.
Work types galore.
Everything's linked and tagged.
Log in to save your searches.
Vast majority of features are free.
citytracker.ai
Track away, and give me feedback!
NYC has beautiful and efficient housing due to its zoning setbacks:
1. Front: To put your garbage bins
2. Height: To make the streetscape pretty
3. Side: To give you space to breathe
1. Front: To put your garbage bins
2. Height: To make the streetscape pretty
3. Side: To give you space to breathe


November 18, 2025 at 5:34 PM
NYC has beautiful and efficient housing due to its zoning setbacks:
1. Front: To put your garbage bins
2. Height: To make the streetscape pretty
3. Side: To give you space to breathe
1. Front: To put your garbage bins
2. Height: To make the streetscape pretty
3. Side: To give you space to breathe
Is there potential to combine the Inter-Borough-Express with upzoning?
Showing block-level averages.
First: Number of floors is mostly below 4, often below 1.
Second: The zoned floor-area-ratio is mostly below 4, often below 1.
(you might notice that these maps are similar)
Showing block-level averages.
First: Number of floors is mostly below 4, often below 1.
Second: The zoned floor-area-ratio is mostly below 4, often below 1.
(you might notice that these maps are similar)


November 18, 2025 at 3:38 PM
Is there potential to combine the Inter-Borough-Express with upzoning?
Showing block-level averages.
First: Number of floors is mostly below 4, often below 1.
Second: The zoned floor-area-ratio is mostly below 4, often below 1.
(you might notice that these maps are similar)
Showing block-level averages.
First: Number of floors is mostly below 4, often below 1.
Second: The zoned floor-area-ratio is mostly below 4, often below 1.
(you might notice that these maps are similar)
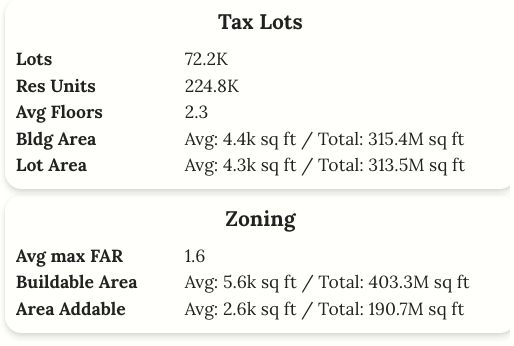
Let's do a quick upzoning analysis of the Inter-Borough-Express.
Within 0.5 miles of the IBX, we have 225,000 units, with average Floor-Area-Ratio of 1.6
If we doubled FAR and assumed that about 50% of the total FAR gets used over 10 years, we'd add:
200,000 units of housing!
🧵
Within 0.5 miles of the IBX, we have 225,000 units, with average Floor-Area-Ratio of 1.6
If we doubled FAR and assumed that about 50% of the total FAR gets used over 10 years, we'd add:
200,000 units of housing!
🧵

November 18, 2025 at 12:57 AM
Let's do a quick upzoning analysis of the Inter-Borough-Express.
Within 0.5 miles of the IBX, we have 225,000 units, with average Floor-Area-Ratio of 1.6
If we doubled FAR and assumed that about 50% of the total FAR gets used over 10 years, we'd add:
200,000 units of housing!
🧵
Within 0.5 miles of the IBX, we have 225,000 units, with average Floor-Area-Ratio of 1.6
If we doubled FAR and assumed that about 50% of the total FAR gets used over 10 years, we'd add:
200,000 units of housing!
🧵
In public projects we often make decisions based on some number, but that number is almost impossible to validate.
An example: IBX in NYC is estimated to have daily ridership of 115,000.
What assumptions go into this? I went through a 1,077 page report and still don't know.
An example: IBX in NYC is estimated to have daily ridership of 115,000.
What assumptions go into this? I went through a 1,077 page report and still don't know.

November 15, 2025 at 10:51 PM
In public projects we often make decisions based on some number, but that number is almost impossible to validate.
An example: IBX in NYC is estimated to have daily ridership of 115,000.
What assumptions go into this? I went through a 1,077 page report and still don't know.
An example: IBX in NYC is estimated to have daily ridership of 115,000.
What assumptions go into this? I went through a 1,077 page report and still don't know.
Lots of discussion of the Inter-Borough-Express (IBX) in NYC.
But I couldn't find a way to analyze the route on a map.
So I created a dataset of the route and stops. Feedback welcome!
Unofficial and using some hand coding, so give me feedback!
github.com/cgoldammer/i...
But I couldn't find a way to analyze the route on a map.
So I created a dataset of the route and stops. Feedback welcome!
Unofficial and using some hand coding, so give me feedback!
github.com/cgoldammer/i...

November 13, 2025 at 12:03 AM
Lots of discussion of the Inter-Borough-Express (IBX) in NYC.
But I couldn't find a way to analyze the route on a map.
So I created a dataset of the route and stops. Feedback welcome!
Unofficial and using some hand coding, so give me feedback!
github.com/cgoldammer/i...
But I couldn't find a way to analyze the route on a map.
So I created a dataset of the route and stops. Feedback welcome!
Unofficial and using some hand coding, so give me feedback!
github.com/cgoldammer/i...
Many people believe that a major driver for the NYC affordability crisis are townhouse conversions that decrease units.
This exists, but:
1. Alterations + dominate -
2. Alterations (+ and - together) are dominated by new construction (>20K/year).
Own chart, Housing DB
This exists, but:
1. Alterations + dominate -
2. Alterations (+ and - together) are dominated by new construction (>20K/year).
Own chart, Housing DB

November 10, 2025 at 9:15 PM
Many people believe that a major driver for the NYC affordability crisis are townhouse conversions that decrease units.
This exists, but:
1. Alterations + dominate -
2. Alterations (+ and - together) are dominated by new construction (>20K/year).
Own chart, Housing DB
This exists, but:
1. Alterations + dominate -
2. Alterations (+ and - together) are dominated by new construction (>20K/year).
Own chart, Housing DB