


Dan Chaltiel
@danchaltiel.bsky.social
R nerd, developer of the {crosstable} package.
Biostatistician (PharmD, PhD) in clinical cancer research.
https://github.com/DanChaltiel
Biostatistician (PharmD, PhD) in clinical cancer research.
https://github.com/DanChaltiel
Pinned
Dan Chaltiel
@danchaltiel.bsky.social
· Feb 7
Hey #Rstats!
Tired of manually adding @importFrom all over your 📦 #Rpackage?
Say hello to {autoimport}, now on CRAN! 🚀
It parses your code and adds the necessary tags automatically, at the function or package level.
Less typing, more coding! 🔥
github.com/DanChaltiel/...
Tired of manually adding @importFrom all over your 📦 #Rpackage?
Say hello to {autoimport}, now on CRAN! 🚀
It parses your code and adds the necessary tags automatically, at the function or package level.
Less typing, more coding! 🔥
github.com/DanChaltiel/...
Reposted by Dan Chaltiel

I’m hiring! 🎉 I’m building out my team and looking for someone who enjoys working in R (tidyverse), is comfortable with Git, and is excited about data. 🤓
#rstats #tidyverse #datascience
roche.wd3.myworkdayjobs.com/roche-ext/jo...
#rstats #tidyverse #datascience
roche.wd3.myworkdayjobs.com/roche-ext/jo...

RVA Specialist
At Roche you can show up as yourself, embraced for the unique qualities you bring. Our culture encourages personal expression, open dialogue, and genuine connections, where you are valued, accepted an...
roche.wd3.myworkdayjobs.com
January 26, 2026 at 7:53 PM
I’m hiring! 🎉 I’m building out my team and looking for someone who enjoys working in R (tidyverse), is comfortable with Git, and is excited about data. 🤓
#rstats #tidyverse #datascience
roche.wd3.myworkdayjobs.com/roche-ext/jo...
#rstats #tidyverse #datascience
roche.wd3.myworkdayjobs.com/roche-ext/jo...
The thing I didn’t know I needed — and it’s brilliant!

I’ve just published {typeR}, a small R package that lets you simulate live typing. It prints code
To install:
devtools::install_github("fgazzelloni/typeR")
If you teach or demo R, I’d love your feedback on how it works for you. #rstats #rpackages
To install:
devtools::install_github("fgazzelloni/typeR")
If you teach or demo R, I’d love your feedback on how it works for you. #rstats #rpackages
January 21, 2026 at 4:32 PM
The thing I didn’t know I needed — and it’s brilliant!
Reposted by Dan Chaltiel

January 20, 2026 at 10:13 AM
Awesome!

{ggview} can print plots to Viewer (Rstudio or Positron) with true scaling. Adjust plot settings and see the final proportions immediately.
Save the plot once 👌
e.g.:
ggplot(...) +
ggview::canvas(width = 220, height = 220*2/3, units = "mm", dpi = 300)
per @nrennie.bsky.social #datavis #rstats
Save the plot once 👌
e.g.:
ggplot(...) +
ggview::canvas(width = 220, height = 220*2/3, units = "mm", dpi = 300)
per @nrennie.bsky.social #datavis #rstats
December 17, 2025 at 4:47 PM
Awesome!
Hey #Rstats!
What is your favorite #tidyverse way to turn a logical into a factor?
I'm using `factor(ifelse(x, "Yes", "No"))`, but it feels a bit ugly, and `fct_recode()` doesn't work on logicals.
What is your favorite #tidyverse way to turn a logical into a factor?
I'm using `factor(ifelse(x, "Yes", "No"))`, but it feels a bit ugly, and `fct_recode()` doesn't work on logicals.
November 17, 2025 at 10:30 AM
Hey #Rstats!
What is your favorite #tidyverse way to turn a logical into a factor?
I'm using `factor(ifelse(x, "Yes", "No"))`, but it feels a bit ugly, and `fct_recode()` doesn't work on logicals.
What is your favorite #tidyverse way to turn a logical into a factor?
I'm using `factor(ifelse(x, "Yes", "No"))`, but it feels a bit ugly, and `fct_recode()` doesn't work on logicals.
Can't wait to test this one!

I'm excited to share side::kick(), an experimental open-source coding agent for RStudio built entirely in R. It can interact with your files, communicate with your active #rstats session, and run code.
Check it out: github.com/simonpcouch/...
Check it out: github.com/simonpcouch/...
November 6, 2025 at 2:38 PM
Can't wait to test this one!
Reposted by Dan Chaltiel

Still fascinated with #webR and its potential for teaching stats
Here students can play (even from their phones) and find out themselves how the p-value depends on sample size
pakillo.github.io/LM-GLM-GLMM-... #rstats
Here students can play (even from their phones) and find out themselves how the p-value depends on sample size
pakillo.github.io/LM-GLM-GLMM-... #rstats

October 22, 2025 at 6:36 AM
Still fascinated with #webR and its potential for teaching stats
Here students can play (even from their phones) and find out themselves how the p-value depends on sample size
pakillo.github.io/LM-GLM-GLMM-... #rstats
Here students can play (even from their phones) and find out themselves how the p-value depends on sample size
pakillo.github.io/LM-GLM-GLMM-... #rstats
Salut tout le monde !
On cherche un·e stagiaire M2/ingé pour un projet R.
Pas besoin de formation pointue en stats.
À Gustave Roussy, près de Paris (métro 14). Le/la stagiaire apprendra plein de choses !
oncostat.github.io/internships_...
N'hésitez pas à partager ou à me demander des précisions 😊
On cherche un·e stagiaire M2/ingé pour un projet R.
Pas besoin de formation pointue en stats.
À Gustave Roussy, près de Paris (métro 14). Le/la stagiaire apprendra plein de choses !
oncostat.github.io/internships_...
N'hésitez pas à partager ou à me demander des précisions 😊
oncostat.github.io
October 21, 2025 at 2:47 PM
Salut tout le monde !
On cherche un·e stagiaire M2/ingé pour un projet R.
Pas besoin de formation pointue en stats.
À Gustave Roussy, près de Paris (métro 14). Le/la stagiaire apprendra plein de choses !
oncostat.github.io/internships_...
N'hésitez pas à partager ou à me demander des précisions 😊
On cherche un·e stagiaire M2/ingé pour un projet R.
Pas besoin de formation pointue en stats.
À Gustave Roussy, près de Paris (métro 14). Le/la stagiaire apprendra plein de choses !
oncostat.github.io/internships_...
N'hésitez pas à partager ou à me demander des précisions 😊
Reposted by Dan Chaltiel

Wondering if you can outsource your data viz work to ChatGPT? 📊
I tested out a few different generative AI tools, giving them prompts to visualise two different data sets. If you're interested in the results, you can read them here: nrennie.rbind.io/blog/gen-ai-...
#RStats #Python #DataViz #GenAI
I tested out a few different generative AI tools, giving them prompts to visualise two different data sets. If you're interested in the results, you can read them here: nrennie.rbind.io/blog/gen-ai-...
#RStats #Python #DataViz #GenAI

Generative AI for Data Visualisation – Nicola Rennie
Can generative AI create good data visualisations? This blog post compares the performance of ChatGPT, Claude, Copilot, and Gemini when presented with a generic request to visualise a dataset.
nrennie.rbind.io
October 9, 2025 at 9:57 AM
Wondering if you can outsource your data viz work to ChatGPT? 📊
I tested out a few different generative AI tools, giving them prompts to visualise two different data sets. If you're interested in the results, you can read them here: nrennie.rbind.io/blog/gen-ai-...
#RStats #Python #DataViz #GenAI
I tested out a few different generative AI tools, giving them prompts to visualise two different data sets. If you're interested in the results, you can read them here: nrennie.rbind.io/blog/gen-ai-...
#RStats #Python #DataViz #GenAI
Reposted by Dan Chaltiel

When I see a report filled with p-values and no effect sizes, I worry. When I see model metrics and no baseline comparison, I worry. Statistics is more than math. It’s the discipline of contextual honesty.
#DataScience #MachineLearning #AI #RStats
#DataScience #MachineLearning #AI #RStats
October 1, 2025 at 5:30 PM
When I see a report filled with p-values and no effect sizes, I worry. When I see model metrics and no baseline comparison, I worry. Statistics is more than math. It’s the discipline of contextual honesty.
#DataScience #MachineLearning #AI #RStats
#DataScience #MachineLearning #AI #RStats
Reposted by Dan Chaltiel

If doughnuts are coming back into fashion, let me bring this one back. #rstats #ShowYourStripes #ShowYourTorus

September 30, 2025 at 11:07 AM
If doughnuts are coming back into fashion, let me bring this one back. #rstats #ShowYourStripes #ShowYourTorus
Reposted by Dan Chaltiel

Really insightful post from Julie Tibshirani (spotted in LinkedIn, can't find on Bsky) reflecting on #rstats 's unique governance structure and what can be learned for other languages
jtibs.substack.com/p/if-all-the...
jtibs.substack.com/p/if-all-the...

If all the world were a monorepo
The R ecosystem and the case for extreme empathy in software maintenance
jtibs.substack.com
September 14, 2025 at 11:29 PM
Really insightful post from Julie Tibshirani (spotted in LinkedIn, can't find on Bsky) reflecting on #rstats 's unique governance structure and what can be learned for other languages
jtibs.substack.com/p/if-all-the...
jtibs.substack.com/p/if-all-the...
Reposted by Dan Chaltiel

By request: Same #rshiny app → native #electron desktop app workflow now on #Windows11
shinyelectron::export() → #rshinylive → installer → app.exe
[Worth the Parallels license to record this from my Mac]
Still no #rstats dependencies for end users. Living the cross-platform life (virtually).
shinyelectron::export() → #rshinylive → installer → app.exe
[Worth the Parallels license to record this from my Mac]
Still no #rstats dependencies for end users. Living the cross-platform life (virtually).
September 7, 2025 at 5:57 AM
By request: Same #rshiny app → native #electron desktop app workflow now on #Windows11
shinyelectron::export() → #rshinylive → installer → app.exe
[Worth the Parallels license to record this from my Mac]
Still no #rstats dependencies for end users. Living the cross-platform life (virtually).
shinyelectron::export() → #rshinylive → installer → app.exe
[Worth the Parallels license to record this from my Mac]
Still no #rstats dependencies for end users. Living the cross-platform life (virtually).
💡 Tips wanted! #RStats
You're working on a package 📦 and improving a function. What's your development workflow?
I usually put a minimal example in a helper file, so every time I run `devtools::load_all()` it loads my changes and shows their effect.
But I wonder if there's a cleaner way to do it...
You're working on a package 📦 and improving a function. What's your development workflow?
I usually put a minimal example in a helper file, so every time I run `devtools::load_all()` it loads my changes and shows their effect.
But I wonder if there's a cleaner way to do it...
July 31, 2025 at 6:22 AM
💡 Tips wanted! #RStats
You're working on a package 📦 and improving a function. What's your development workflow?
I usually put a minimal example in a helper file, so every time I run `devtools::load_all()` it loads my changes and shows their effect.
But I wonder if there's a cleaner way to do it...
You're working on a package 📦 and improving a function. What's your development workflow?
I usually put a minimal example in a helper file, so every time I run `devtools::load_all()` it loads my changes and shows their effect.
But I wonder if there's a cleaner way to do it...
Hey #Rstats!
Just discovered `testthat::describe()`, it seems so much cleaner and more structured than `testthat::test_that()` for organizing tests🤩
But… why isn’t it more common? Even tidyverse packages barely use it. Am I missing something?
Just discovered `testthat::describe()`, it seems so much cleaner and more structured than `testthat::test_that()` for organizing tests🤩
But… why isn’t it more common? Even tidyverse packages barely use it. Am I missing something?
July 6, 2025 at 7:57 AM
Hey #Rstats!
Just discovered `testthat::describe()`, it seems so much cleaner and more structured than `testthat::test_that()` for organizing tests🤩
But… why isn’t it more common? Even tidyverse packages barely use it. Am I missing something?
Just discovered `testthat::describe()`, it seems so much cleaner and more structured than `testthat::test_that()` for organizing tests🤩
But… why isn’t it more common? Even tidyverse packages barely use it. Am I missing something?
Reposted by Dan Chaltiel
#RShiny devs, don't miss this post by Mike Page about an useful and simple tool to draft your apps!
"Introducing shinydraw: a no-code tool for shiny wireframing"
cynkra.com/blog/2025-05...
#RStats
"Introducing shinydraw: a no-code tool for shiny wireframing"
cynkra.com/blog/2025-05...
#RStats

Introducing shinydraw: a no-code tool for shiny wireframing - cynkra
Streamline your Shiny app design: Introducing shinydraw for effortless wireframing
cynkra.com
May 13, 2025 at 7:12 AM
#RShiny devs, don't miss this post by Mike Page about an useful and simple tool to draft your apps!
"Introducing shinydraw: a no-code tool for shiny wireframing"
cynkra.com/blog/2025-05...
#RStats
"Introducing shinydraw: a no-code tool for shiny wireframing"
cynkra.com/blog/2025-05...
#RStats
Reposted by Dan Chaltiel

New unhinged #rstats rant about NSE just dropped:
🔗 kbodwin.github.io/paRticles/po...
tl;dr - some cute (?) tricks for iterating over unquoted columns
see below to skip the stream-of-consiousness blog and go straight to code snippets
🔗 kbodwin.github.io/paRticles/po...
tl;dr - some cute (?) tricks for iterating over unquoted columns
see below to skip the stream-of-consiousness blog and go straight to code snippets
Punctuation and Other Problems – paRticles
kbodwin.github.io
April 25, 2025 at 6:30 AM
New unhinged #rstats rant about NSE just dropped:
🔗 kbodwin.github.io/paRticles/po...
tl;dr - some cute (?) tricks for iterating over unquoted columns
see below to skip the stream-of-consiousness blog and go straight to code snippets
🔗 kbodwin.github.io/paRticles/po...
tl;dr - some cute (?) tricks for iterating over unquoted columns
see below to skip the stream-of-consiousness blog and go straight to code snippets

Reposted by Dan Chaltiel

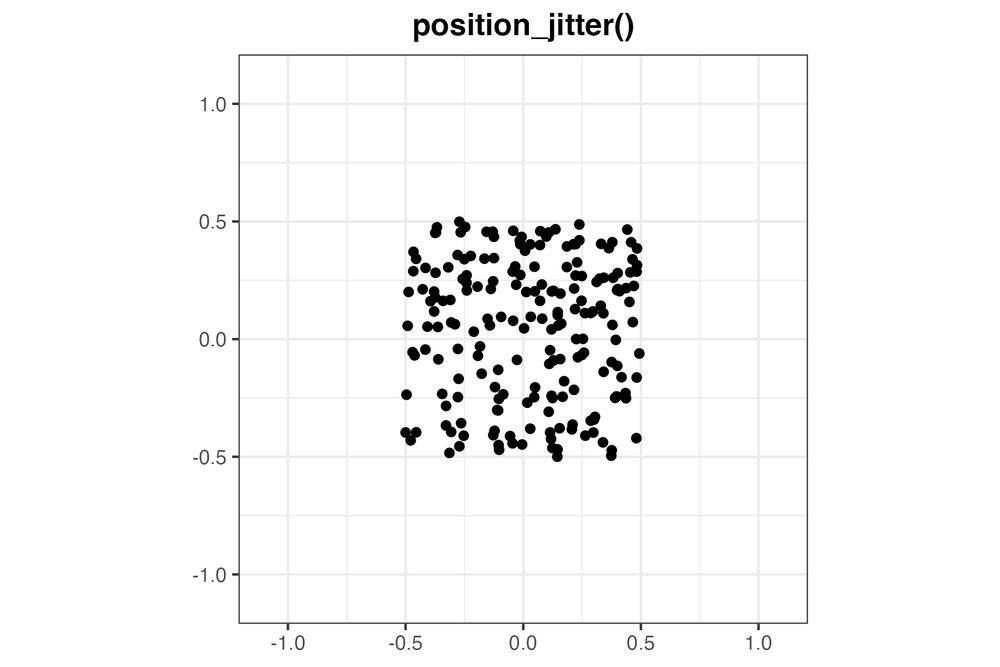
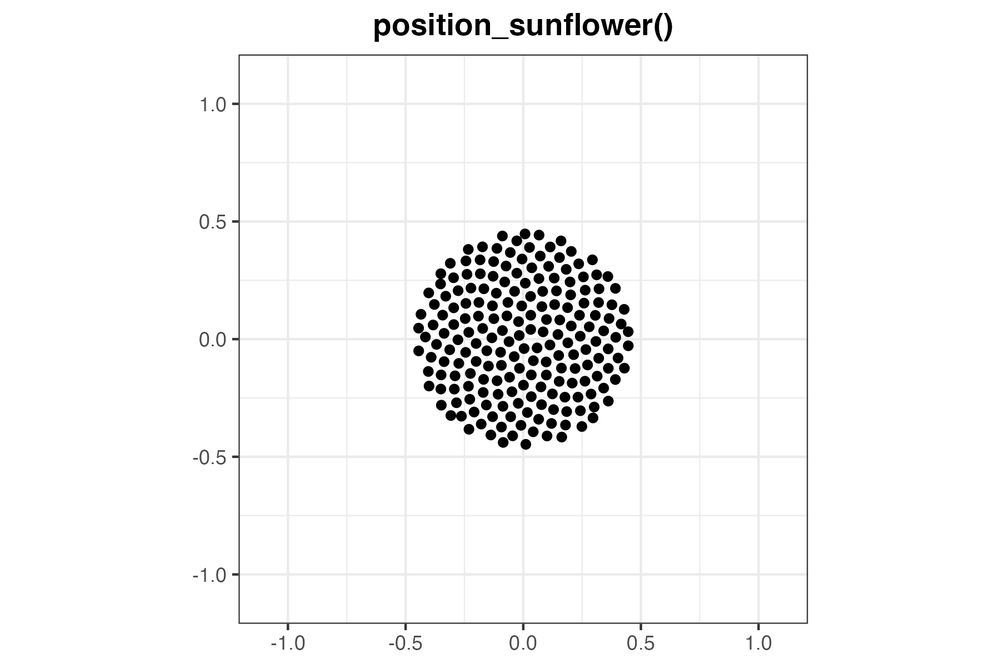
New visualization tool alert!
The vayr package version 1.0.0 is now on CRAN.
It contains position adjustments for ggplot2 that help with overplotting in pleasing ways. My favorite is position_sunflower().
- install.packages("vayr")
- alexandercoppock.com/vayr
#rstats #ggplot2 #dataviz
The vayr package version 1.0.0 is now on CRAN.
It contains position adjustments for ggplot2 that help with overplotting in pleasing ways. My favorite is position_sunflower().
- install.packages("vayr")
- alexandercoppock.com/vayr
#rstats #ggplot2 #dataviz


April 16, 2025 at 7:53 PM
New visualization tool alert!
The vayr package version 1.0.0 is now on CRAN.
It contains position adjustments for ggplot2 that help with overplotting in pleasing ways. My favorite is position_sunflower().
- install.packages("vayr")
- alexandercoppock.com/vayr
#rstats #ggplot2 #dataviz
The vayr package version 1.0.0 is now on CRAN.
It contains position adjustments for ggplot2 that help with overplotting in pleasing ways. My favorite is position_sunflower().
- install.packages("vayr")
- alexandercoppock.com/vayr
#rstats #ggplot2 #dataviz
Hey #rstats, time for a poll!
What's your go-to name for a folder that stores your saved plots?
I use "plots", "graphs", "figures", … and I crave convergence 😩
What's your go-to name for a folder that stores your saved plots?
I use "plots", "graphs", "figures", … and I crave convergence 😩
April 9, 2025 at 12:59 PM
Hey #rstats, time for a poll!
What's your go-to name for a folder that stores your saved plots?
I use "plots", "graphs", "figures", … and I crave convergence 😩
What's your go-to name for a folder that stores your saved plots?
I use "plots", "graphs", "figures", … and I crave convergence 😩
Reposted by Dan Chaltiel

When you say something is an assumption (e.g., linear regression assumes conditional normality) you need to specify what properties are actually being preserved with this assumption. 1/3
March 10, 2025 at 4:09 PM
When you say something is an assumption (e.g., linear regression assumes conditional normality) you need to specify what properties are actually being preserved with this assumption. 1/3