


Brenden
@beesm.bsky.social
#rstats & public health
brendenmsmith.com
brendenmsmith.com
Reposted by Brenden

With the most robust rail network in the American Midwest, Chicago has the 2nd largest number of car-free households of any metro area (behind only NYC)
Most of those households live around the L, especially the Red Line and western parts of the Blue & Green Lines
Most of those households live around the L, especially the Red Line and western parts of the Blue & Green Lines

February 6, 2026 at 11:56 PM
With the most robust rail network in the American Midwest, Chicago has the 2nd largest number of car-free households of any metro area (behind only NYC)
Most of those households live around the L, especially the Red Line and western parts of the Blue & Green Lines
Most of those households live around the L, especially the Red Line and western parts of the Blue & Green Lines
Any #rstats folks interested in testing out a package for SQL linting in R workflows?
I made a package that wraps SQLFluff into R with reticulate. I've tried it on a few machines I own but would appreciate some experimentation before I try to send it to CRAN.
github.com/brendensm/sq...
I made a package that wraps SQLFluff into R with reticulate. I've tried it on a few machines I own but would appreciate some experimentation before I try to send it to CRAN.
github.com/brendensm/sq...
GitHub - brendensm/sqlfluffr: R Wrapper to the SQL Linter and Formatter 'sqlfluff'
R Wrapper to the SQL Linter and Formatter 'sqlfluff' - brendensm/sqlfluffr
github.com
February 6, 2026 at 9:13 PM
Any #rstats folks interested in testing out a package for SQL linting in R workflows?
I made a package that wraps SQLFluff into R with reticulate. I've tried it on a few machines I own but would appreciate some experimentation before I try to send it to CRAN.
github.com/brendensm/sq...
I made a package that wraps SQLFluff into R with reticulate. I've tried it on a few machines I own but would appreciate some experimentation before I try to send it to CRAN.
github.com/brendensm/sq...
First #TidyTuesday using python 🐍 🫣

February 4, 2026 at 10:12 PM
First #TidyTuesday using python 🐍 🫣
Reposted by Brenden


December 15, 2025 at 6:08 PM
This one looks so fun omg

@dslc.io welcomes you to week 50 of #TidyTuesday! We're exploring Roundabouts across the world!
📂 https://tidytues.day/2025/2025-12-16
📰 https://www.kittelson.com/ideas/how-many-roundabouts-are-in-the-united-states/
#RStats #PyData #JuliaLang #DataViz #tidyverse #r4ds
📂 https://tidytues.day/2025/2025-12-16
📰 https://www.kittelson.com/ideas/how-many-roundabouts-are-in-the-united-states/
#RStats #PyData #JuliaLang #DataViz #tidyverse #r4ds

December 16, 2025 at 1:50 PM
This one looks so fun omg
Reposted by Brenden

Reposted by Brenden

There are a number of issues with this analysis but I found one that I haven't seen anyone else mention: Kaufmann estimates gender ID from the FIRE data without using the survey weights
When the weights are used as designed, the evidence for his core claim disappears
When the weights are used as designed, the evidence for his core claim disappears

October 15, 2025 at 5:12 AM
There are a number of issues with this analysis but I found one that I haven't seen anyone else mention: Kaufmann estimates gender ID from the FIRE data without using the survey weights
When the weights are used as designed, the evidence for his core claim disappears
When the weights are used as designed, the evidence for his core claim disappears

Reposted by Brenden

Bayesianism is ZuTara while Frequentism is KatAang.
August 30, 2025 at 10:13 AM
Bayesianism is ZuTara while Frequentism is KatAang.
Reposted by Brenden

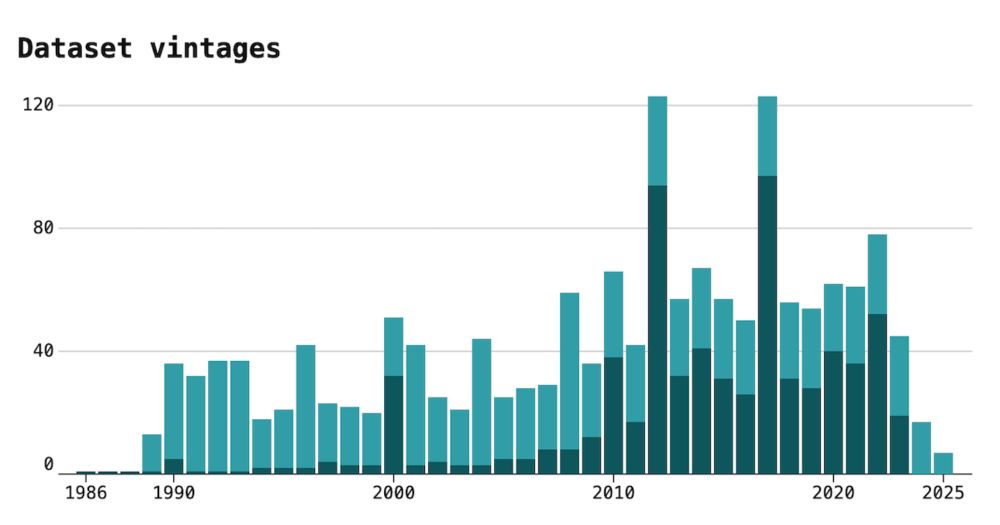
🚀 I made a tracker that shows when the Census Bureau adds or removes datasets from their APIs.
Dashboard at www.hrecht.com/census-api-d... and follow @censusapitracker.bsky.social for major updates.
I've been wanting to build this for years but now seemed an especially important time to keep track.
Dashboard at www.hrecht.com/census-api-d... and follow @censusapitracker.bsky.social for major updates.
I've been wanting to build this for years but now seemed an especially important time to keep track.
Tracking Census Dataset Changes
See when the U.S. Census Bureau adds or removes datasets.
www.hrecht.com
August 11, 2025 at 5:09 PM
🚀 I made a tracker that shows when the Census Bureau adds or removes datasets from their APIs.
Dashboard at www.hrecht.com/census-api-d... and follow @censusapitracker.bsky.social for major updates.
I've been wanting to build this for years but now seemed an especially important time to keep track.
Dashboard at www.hrecht.com/census-api-d... and follow @censusapitracker.bsky.social for major updates.
I've been wanting to build this for years but now seemed an especially important time to keep track.
Reposted by Brenden

One day when I’m grown up I want to understand targeted learning.
July 24, 2025 at 2:00 PM
One day when I’m grown up I want to understand targeted learning.
Quick look at the most common adjectives used among the top identified colors in the xkcd color survey. #TidyTuesday #rstats

July 10, 2025 at 1:38 AM
Quick look at the most common adjectives used among the top identified colors in the xkcd color survey. #TidyTuesday #rstats
#TidyTuesday week 26 - It ain't much but it's honest work.
I chose to look at the average differences in prices between conventional and reformulated gasoline -- which honestly I have not ever thought much about! Interesting to see such differences increase over the years. #rstats #dataviz
I chose to look at the average differences in prices between conventional and reformulated gasoline -- which honestly I have not ever thought much about! Interesting to see such differences increase over the years. #rstats #dataviz

July 2, 2025 at 2:18 AM
#TidyTuesday week 26 - It ain't much but it's honest work.
I chose to look at the average differences in prices between conventional and reformulated gasoline -- which honestly I have not ever thought much about! Interesting to see such differences increase over the years. #rstats #dataviz
I chose to look at the average differences in prices between conventional and reformulated gasoline -- which honestly I have not ever thought much about! Interesting to see such differences increase over the years. #rstats #dataviz
Reposted by Brenden

Keen to start up and running with #TidyTuesday this week? Try this command line method to create a #rstats script template.
Or if you want a quarto template, try my version...
github.com/jenrichmond/...
Or if you want a quarto template, try my version...
github.com/jenrichmond/...
June 21, 2025 at 1:49 AM
Keen to start up and running with #TidyTuesday this week? Try this command line method to create a #rstats script template.
Or if you want a quarto template, try my version...
github.com/jenrichmond/...
Or if you want a quarto template, try my version...
github.com/jenrichmond/...
Put together this (probably overkill) #TidyTuesday CLI tool to browse data sets and create template scripts. Maybe this will motivate me to participate more 😅
You can check it out here: github.com/brendensm/tt
You can check it out here: github.com/brendensm/tt

GitHub - brendensm/tt
Contribute to brendensm/tt development by creating an account on GitHub.
github.com
June 20, 2025 at 11:49 AM
Put together this (probably overkill) #TidyTuesday CLI tool to browse data sets and create template scripts. Maybe this will motivate me to participate more 😅
You can check it out here: github.com/brendensm/tt
You can check it out here: github.com/brendensm/tt
Reposted by Brenden

We're looking at Pokemon data for #TidyTuesday this week!
📊 Stream plot showing speed and colour using {ggstream}
📷 Image added with {ggimage}
🎉 Aiming for a minimalist, fun, and arty chart
Code: github.com/nrennie/tidy...
#RStats #DataViz #ggplot2
📊 Stream plot showing speed and colour using {ggstream}
📷 Image added with {ggimage}
🎉 Aiming for a minimalist, fun, and arty chart
Code: github.com/nrennie/tidy...
#RStats #DataViz #ggplot2

April 2, 2025 at 5:51 PM
We're looking at Pokemon data for #TidyTuesday this week!
📊 Stream plot showing speed and colour using {ggstream}
📷 Image added with {ggimage}
🎉 Aiming for a minimalist, fun, and arty chart
Code: github.com/nrennie/tidy...
#RStats #DataViz #ggplot2
📊 Stream plot showing speed and colour using {ggstream}
📷 Image added with {ggimage}
🎉 Aiming for a minimalist, fun, and arty chart
Code: github.com/nrennie/tidy...
#RStats #DataViz #ggplot2


Does anybody in the #rstats world have advice on using a custom docx template with Quarto? I’m looking to be able to customize the header of the docx from the qmd too.
March 25, 2025 at 2:16 PM
Does anybody in the #rstats world have advice on using a custom docx template with Quarto? I’m looking to be able to customize the header of the docx from the qmd too.
Reposted by Brenden

hereR 📦 v1.1.0 is now on CRAN! 🚀
- Add speed limit configuration for isolines & routes ⏱️
- Expand isoline transport modes: bicycle, bus & more 🚴
- Migrate deprecated mocking functions and fix test coverage ⚙️
Details: cran.r-project.org/package=hereR
#rstats #rspatial #routing #datascience
- Add speed limit configuration for isolines & routes ⏱️
- Expand isoline transport modes: bicycle, bus & more 🚴
- Migrate deprecated mocking functions and fix test coverage ⚙️
Details: cran.r-project.org/package=hereR
#rstats #rspatial #routing #datascience

hereR: 'sf'-Based Interface to the 'HERE' REST APIs
Interface to the 'HERE' REST APIs <<a href="https://developer.here.com/develop/rest-apis" target="_top">https://developer.here.com/develop/rest-apis</a>>: (1) geocode and autosuggest addresses o...
cran.r-project.org
February 23, 2025 at 3:22 PM
hereR 📦 v1.1.0 is now on CRAN! 🚀
- Add speed limit configuration for isolines & routes ⏱️
- Expand isoline transport modes: bicycle, bus & more 🚴
- Migrate deprecated mocking functions and fix test coverage ⚙️
Details: cran.r-project.org/package=hereR
#rstats #rspatial #routing #datascience
- Add speed limit configuration for isolines & routes ⏱️
- Expand isoline transport modes: bicycle, bus & more 🚴
- Migrate deprecated mocking functions and fix test coverage ⚙️
Details: cran.r-project.org/package=hereR
#rstats #rspatial #routing #datascience
Reposted by Brenden
I'm really looking forward to running this "Git and GitHub for R Users" workshop for @r-ladies-stl.bsky.social!
📅 April 23rd 2025
⏰ 11am CST / 5pm BST
📍 Online
Register: www.meetup.com/rladies-st-l...
#RStats #Git #GitHub #RLadies
📅 April 23rd 2025
⏰ 11am CST / 5pm BST
📍 Online
Register: www.meetup.com/rladies-st-l...
#RStats #Git #GitHub #RLadies
February 16, 2025 at 8:40 PM
I'm really looking forward to running this "Git and GitHub for R Users" workshop for @r-ladies-stl.bsky.social!
📅 April 23rd 2025
⏰ 11am CST / 5pm BST
📍 Online
Register: www.meetup.com/rladies-st-l...
#RStats #Git #GitHub #RLadies
📅 April 23rd 2025
⏰ 11am CST / 5pm BST
📍 Online
Register: www.meetup.com/rladies-st-l...
#RStats #Git #GitHub #RLadies
Reposted by Brenden

New: If enhanced federal payments for the ACA Medicaid expansion are eliminated, states have two choices:
1. Make up for the cut, at a cost of $626 billion over a decade.
2. Rollback the expansion, leading to 20 million people losing Medicaid.
www.kff.org/medicaid/iss...
1. Make up for the cut, at a cost of $626 billion over a decade.
2. Rollback the expansion, leading to 20 million people losing Medicaid.
www.kff.org/medicaid/iss...
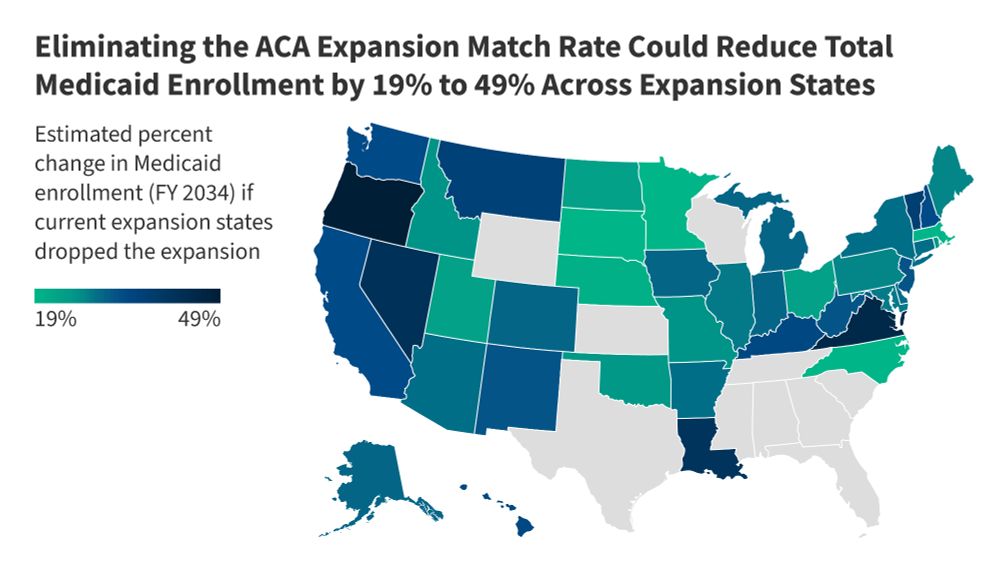
Eliminating the Medicaid Expansion Federal Match Rate: State-by-State Estimates | KFF
This analysis examines the potential impacts on states and Medicaid enrollees of eliminating the 90% federal match rate for the Affordable Care Act (ACA) expansion. Eliminating the federal match rate ...
www.kff.org
February 13, 2025 at 3:04 PM
New: If enhanced federal payments for the ACA Medicaid expansion are eliminated, states have two choices:
1. Make up for the cut, at a cost of $626 billion over a decade.
2. Rollback the expansion, leading to 20 million people losing Medicaid.
www.kff.org/medicaid/iss...
1. Make up for the cut, at a cost of $626 billion over a decade.
2. Rollback the expansion, leading to 20 million people losing Medicaid.
www.kff.org/medicaid/iss...
Yaay we are staying on CRAN
CRAN updates: CDCPLACES #rstats
February 10, 2025 at 10:51 PM
Yaay we are staying on CRAN