


Ali Salman, MBBS
@alisalman-et-al.bsky.social
Dow Medical College | Head Research Analyst @ RCOP | Biostatistician | Aspiring Cardiologist | Polymath
Sociology
20%
Political science
20%
The gap between what we know works and what actually reaches communities is where we must focus our efforts.
📖 Full study: doi.org/10.1016/j.cp...
📖 Full study: doi.org/10.1016/j.cp...
💡 The CHAP trial demonstrated that targeting BP <140/90 in pregnant women significantly reduces adverse outcomes.
We have evidence-based treatments that work, but only when patients can access quality care consistently.
We have evidence-based treatments that work, but only when patients can access quality care consistently.
🎯 What gives me hope: Research shows African-born Black women have birth outcomes similar to White women, while US-born Black women face these stark differences.
This points to social and environmental factors we can actually address.
This points to social and environmental factors we can actually address.
The most sobering finding? When we adjusted for clinical factors, the disparities remained.
This isn't about individual choices, it's about how the healthcare system delivers care.
This isn't about individual choices, it's about how the healthcare system delivers care.
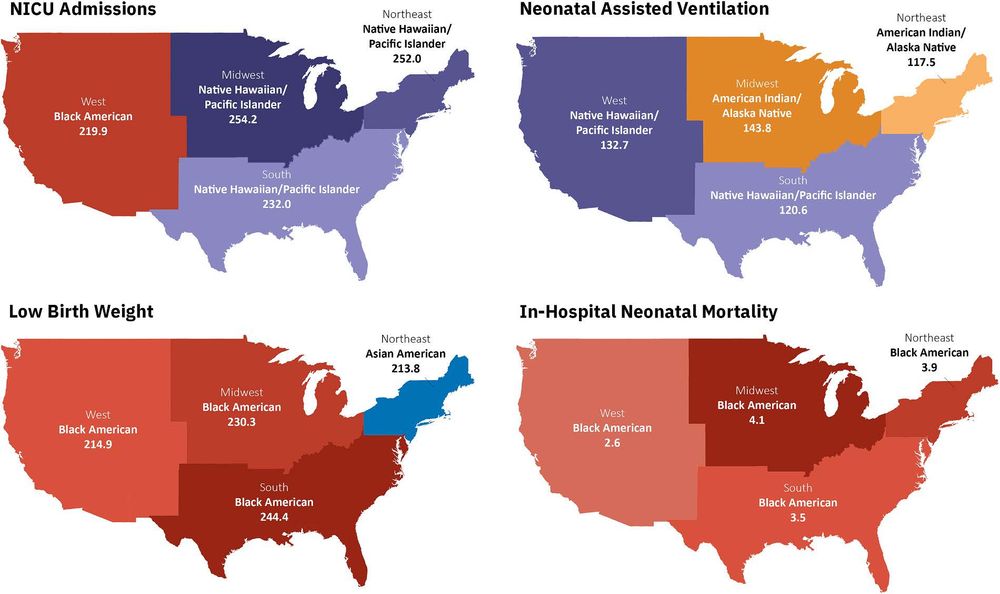
🔍 The data doesn't lie:
- Low birth weight: 235.1 per 1,000 (Black) vs 121.8 per 1,000 (White)
- NICU admissions: 217.2 per 1,000 (Black) vs 156.0 per 1,000 (White)
- Regional patterns: Midwest and South consistently worse
- Low birth weight: 235.1 per 1,000 (Black) vs 121.8 per 1,000 (White)
- NICU admissions: 217.2 per 1,000 (Black) vs 156.0 per 1,000 (White)
- Regional patterns: Midwest and South consistently worse
⚖️ Black American mothers experienced neonatal mortality rates 2.4x higher than White mothers (3.6 vs 1.5 per 1,000 births).
These disparities held even after controlling for maternal age, diabetes, smoking, and BMI.
These disparities held even after controlling for maternal age, diabetes, smoking, and BMI.

📊 2.4 million births. 7 years of data. One unavoidable conclusion: we have a maternal health crisis hiding in plain sight.
Our new study in Current Problems in Cardiology analyzed every birth to hypertensive mothers in the US (2016-2022).
Thread 👇
#MedSky
Our new study in Current Problems in Cardiology analyzed every birth to hypertensive mothers in the US (2016-2022).
Thread 👇
#MedSky

Where Adults With Heart Failure Die: Insights From the CDC-WONDER Database | Circulation: Heart Failure
BACKGROUND: Heart failure (HF) is associated with high mortality rates and substantial health
care costs. While there is growing emphasis on integrating palliative care for patients
with HF, limited d...
doi.org
6/6 This isn’t just about death.
It’s about the care people get in their final days, and who’s left behind.
📖 Read the full study:
doi.org/10.1161/CIRC...
#CardioSky #MedSky #AHAJournals #Cardiology #HeartFailure #PalliativeCare #HealthEquity #EndOfLifeCare
It’s about the care people get in their final days, and who’s left behind.
📖 Read the full study:
doi.org/10.1161/CIRC...
#CardioSky #MedSky #AHAJournals #Cardiology #HeartFailure #PalliativeCare #HealthEquity #EndOfLifeCare
5/6 These aren’t just numbers.
They reflect patterns — in access, trust, and structural care gaps.
📍 Place of death is a proxy:
For dignity.
For inequity.
For how systems succeed — or fall short.
They reflect patterns — in access, trust, and structural care gaps.
📍 Place of death is a proxy:
For dignity.
For inequity.
For how systems succeed — or fall short.
4/6 ⚠️ Where you die depends on who you are
🧑🎓 Age (20–34):
• 56.2% died in hospitals
👨 Men:
• 37% less likely to die in hospice
🧑🏿 Black adults:
• 61% more likely to die in ED/outpatient
• 47% less likely to receive hospice
📍 Rural/small metro:
• More likely to die in hospice (ORs: 1.21, 1.09)
🧑🎓 Age (20–34):
• 56.2% died in hospitals
👨 Men:
• 37% less likely to die in hospice
🧑🏿 Black adults:
• 61% more likely to die in ED/outpatient
• 47% less likely to receive hospice
📍 Rural/small metro:
• More likely to die in hospice (ORs: 1.21, 1.09)
3/6 📉 Hospice is declining, and we don’t fully know why
Hospice/nursing home deaths:
• Peaked in 2017 at 34.7%
• Dropped to 29.5% by 2023
➤ 5.2-point fall in just 6 years
This decline started before COVID.
What changed?
Hospice/nursing home deaths:
• Peaked in 2017 at 34.7%
• Dropped to 29.5% by 2023
➤ 5.2-point fall in just 6 years
This decline started before COVID.
What changed?
2/6 🏠 Home is now the most common place of death
In 1999:
• Hospital = 45.1%
• Home = 18.4%
By 2023:
• Hospital = 32.4%
• Home = 33.5%
A shift toward home — but is it a supported choice, or a system gap?
In 1999:
• Hospital = 45.1%
• Home = 18.4%
By 2023:
• Hospital = 32.4%
• Home = 33.5%
A shift toward home — but is it a supported choice, or a system gap?
1/6 🫀 Where you die shapes how you die.
And the U.S. healthcare system is quietly rewriting that story.
We analyzed 7.6 million death certificates (1999–2023) to find out where adults with heart failure spend their final days.
What we found raises hard questions.
And the U.S. healthcare system is quietly rewriting that story.
We analyzed 7.6 million death certificates (1999–2023) to find out where adults with heart failure spend their final days.
What we found raises hard questions.
8/8 Measuring how patients feel shouldn’t be an afterthought.
We can — and must — do better.
We can — and must — do better.

Patient-Reported Outcomes as End Points in Heart Failure Trials | Circulation
Heart failure is a growing health-care concern affecting tens of millions of individuals
globally. Although traditional therapeutic strategies have focused on reducing the
risk for hospitalization and...
www.ahajournals.org
7/8 So what do we need in #HeartFailure trials?
✅ Define what “better” really means
📊 Measure who improves — and for how long
⚰️ Count everyone — including those who die
🧪 Test treatments in real-world populations
📄 Full paper: www.ahajournals.org/doi/10.1161/...
✅ Define what “better” really means
📊 Measure who improves — and for how long
⚰️ Count everyone — including those who die
🧪 Test treatments in real-world populations
📄 Full paper: www.ahajournals.org/doi/10.1161/...
6/8 Fifth: Are trial patients real patients?
Trials often enroll younger, healthier folks.
But in the real world, heart failure hits older, sicker adults.
If it works in a trial, will it work for your patients?
Trials often enroll younger, healthier folks.
But in the real world, heart failure hits older, sicker adults.
If it works in a trial, will it work for your patients?
5/8 Fourth: What about the patients who die?
KCCQ can’t be filled out by people who die.
So some trials exclude them from the results.
If more people die on a drug… shouldn’t that count?
KCCQ can’t be filled out by people who die.
So some trials exclude them from the results.
If more people die on a drug… shouldn’t that count?
4/8 Third: Do those gains last?
A drug that makes you feel better for 2 weeks — then stops?
Most trials don’t thoroughly check if KCCQ improvements are durable.
Shouldn’t we be asking that before approval?
A drug that makes you feel better for 2 weeks — then stops?
Most trials don’t thoroughly check if KCCQ improvements are durable.
Shouldn’t we be asking that before approval?
3/8 Second: The average hides the truth.
If the average KCCQ gain is 3 points… who’s getting better?
Maybe a few patients feel great, others feel nothing.
Averages don’t tell us who benefits — and that’s what matters.
If the average KCCQ gain is 3 points… who’s getting better?
Maybe a few patients feel great, others feel nothing.
Averages don’t tell us who benefits — and that’s what matters.
2/8 First: What counts as "better"?
Trials say a 5-point KCCQ boost is meaningful.
But newer data? Patients may need 10–16 points to actually feel a difference.
So are we approving drugs that don’t help enough?
Trials say a 5-point KCCQ boost is meaningful.
But newer data? Patients may need 10–16 points to actually feel a difference.
So are we approving drugs that don’t help enough?


1/8 What if the way we measure “feeling better” in heart failure trials is broken?
In our new @ahajournals.bsky.social paper, we dig into how patient-reported outcomes (like KCCQ) are used — and what may be going wrong. 🧵
#CardioSky #MedSky #Circulation #AHAJournals #Cardiology
In our new @ahajournals.bsky.social paper, we dig into how patient-reported outcomes (like KCCQ) are used — and what may be going wrong. 🧵
#CardioSky #MedSky #Circulation #AHAJournals #Cardiology

6/ And here’s the contradiction:
We accept statins for primary prevention based on subgroup data…
So why do we treat SGLT-2 inhibitors differently?
We accept statins for primary prevention based on subgroup data…
So why do we treat SGLT-2 inhibitors differently?
5/ Meanwhile, older adults face the highest burden of heart failure & kidney disease.
What are we waiting for? A perfect RCT? In the meantime, patients are dying without optimal treatment.
What are we waiting for? A perfect RCT? In the meantime, patients are dying without optimal treatment.
4/ The hesitation? “We don’t have dedicated RCTs in older adults.”
✔️ True—most trials focus on younger patients and only include older adults in subgroup analyses.
✔️ But does that justify withholding a therapy that consistently reduces mortality & hospitalizations?
✔️ True—most trials focus on younger patients and only include older adults in subgroup analyses.
✔️ But does that justify withholding a therapy that consistently reduces mortality & hospitalizations?
3/ So, if the data is this strong… why aren’t more clinicians using them?
2/ Here’s what we found:
✔️ 12% drop in all-cause mortality (RR 0.88, 95% CI: 0.83–0.95)
✔️ 18% lower CV death (RR 0.82, 95% CI: 0.74–0.92)
✔️ 28% fewer heart failure hospitalizations (RR 0.72, 95% CI: 0.66–0.79)
✔️ Lower serious adverse events overall (RR 0.92, 95% CI: 0.89–0.95)
✔️ 12% drop in all-cause mortality (RR 0.88, 95% CI: 0.83–0.95)
✔️ 18% lower CV death (RR 0.82, 95% CI: 0.74–0.92)
✔️ 28% fewer heart failure hospitalizations (RR 0.72, 95% CI: 0.66–0.79)
✔️ Lower serious adverse events overall (RR 0.92, 95% CI: 0.89–0.95)
1/ 🚨 Are we denying older adults a life-saving therapy?
Our meta-analysis (32,541 older adults) shows SGLT-2 inhibitors significantly reduce mortality, heart failure hospitalizations, and major cardiac events.
Yet, they remain underused. Why? 🧵👇
#CardioSky
Our meta-analysis (32,541 older adults) shows SGLT-2 inhibitors significantly reduce mortality, heart failure hospitalizations, and major cardiac events.
Yet, they remain underused. Why? 🧵👇
#CardioSky

Obesity paradox in coronary artery disease: national... : Coronary Artery Disease
CAD from 2018 to 2020. The study cohort was stratified into six BMI categories: underweight, normal weight, overweight, class I obesity, class II obesity, and class III obesity. Using multivariable lo...
journals.lww.com
4/4
💡 We also found underweight & normal-weight groups had the longest median LOS (5 days), while overweight patients accrued the highest total charges (~$53K). Check out the full article below 📖
journals.lww.com/coronary-art...
💡 We also found underweight & normal-weight groups had the longest median LOS (5 days), while overweight patients accrued the highest total charges (~$53K). Check out the full article below 📖
journals.lww.com/coronary-art...
3/4
🔍 After adjusting for confounders, underweight status was linked to higher mortality (OR=1.38) vs. normal weight, while overweight/obesity showed lower odds (e.g., class I obesity OR=0.54). Could a higher BMI be protective in #CAD?
🔍 After adjusting for confounders, underweight status was linked to higher mortality (OR=1.38) vs. normal weight, while overweight/obesity showed lower odds (e.g., class I obesity OR=0.54). Could a higher BMI be protective in #CAD?